
Key Insights
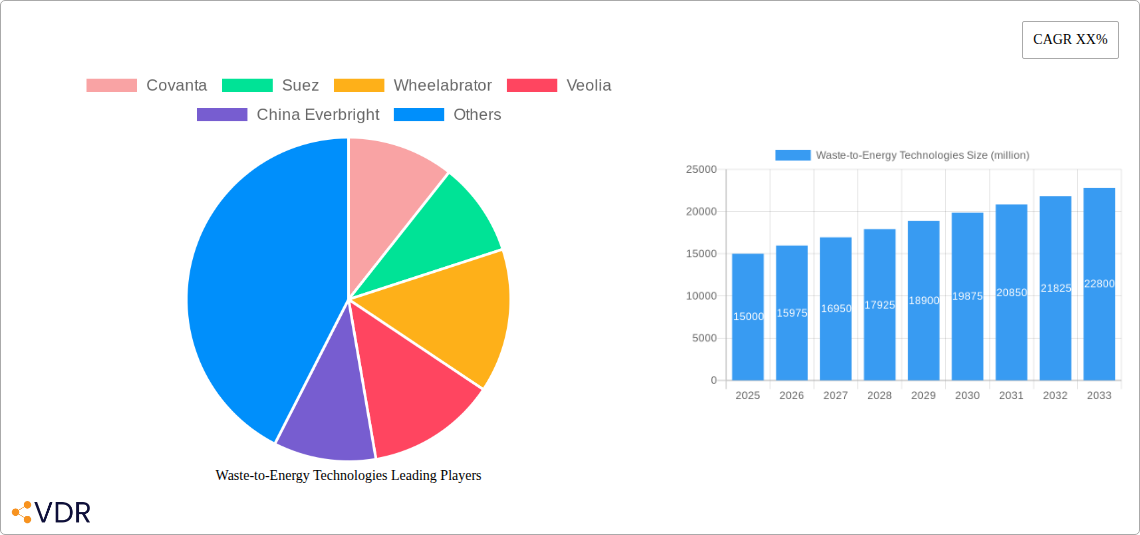
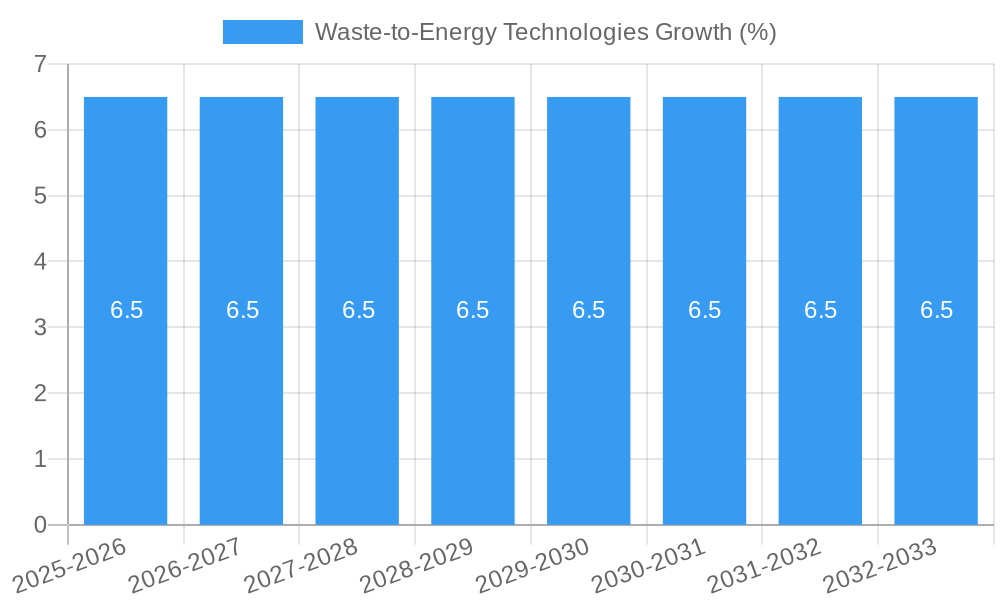
The global Waste-to-Energy (WTE) Technologies market is poised for substantial growth, projected to reach an estimated $15,000 million by 2025, and is anticipated to expand at a Compound Annual Growth Rate (CAGR) of 6.5% through 2033. This robust expansion is primarily driven by increasing global waste generation, the urgent need for sustainable waste management solutions, and supportive government regulations promoting renewable energy sources. The growing environmental consciousness among both governments and citizens is a significant tailwind, pushing for the adoption of WTE technologies to mitigate landfill dependency and reduce greenhouse gas emissions. Furthermore, advancements in thermal and biochemical WTE processes are enhancing efficiency and cost-effectiveness, making these solutions increasingly attractive for both developed and developing economies. Power plants and heating plants represent the dominant applications, leveraging WTE for reliable and renewable energy generation.
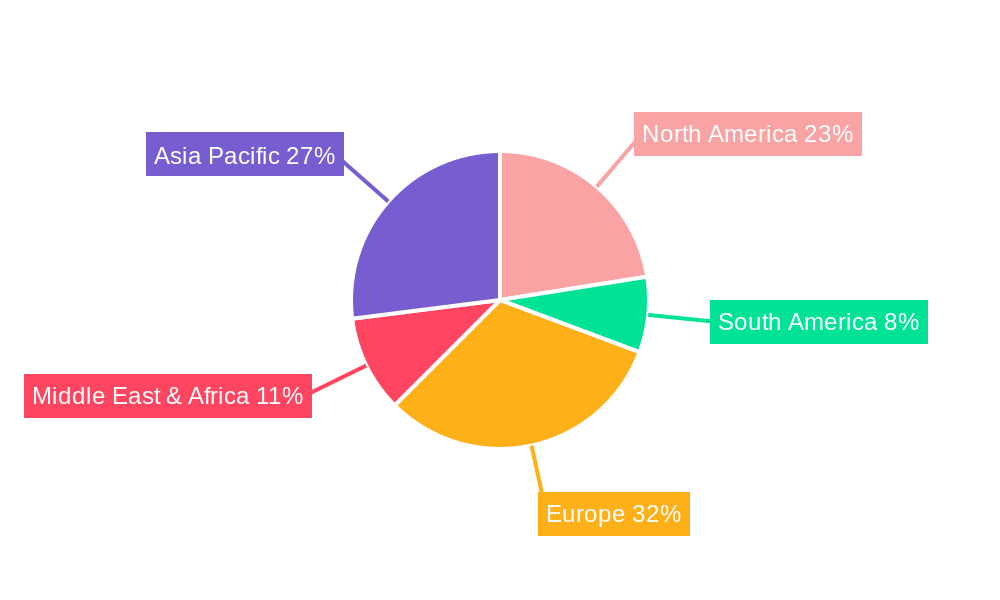
The market landscape is characterized by strong competition and strategic collaborations among key players like Covanta, Suez, Wheelabrator, and Veolia, who are investing heavily in research and development to innovate and scale up their operations. Europe and Asia Pacific are leading the adoption of WTE technologies, with significant investments in new facilities and upgrades to existing ones. While the market is driven by strong fundamentals, challenges such as high initial capital investment for WTE facilities and public perception concerns regarding emissions can act as restraints. However, ongoing technological improvements in emission control and energy recovery are steadily addressing these issues. The increasing focus on circular economy principles further bolsters the WTE sector, positioning it as a critical component of future sustainable infrastructure.
This comprehensive report provides an in-depth analysis of the global Waste-to-Energy (WtE) technologies market, a critical sector driving the transition towards a circular economy and sustainable energy generation. Covering the Study Period 2019–2033, with a Base Year of 2025, this report offers unparalleled insights into market dynamics, growth trends, regional dominance, product landscape, key drivers, challenges, emerging opportunities, and future outlook. With a focus on Thermal Technologies and Biochemical Reactions, and applications spanning Power Plants, Heating Plants, and Others, this report is an essential resource for industry professionals, investors, and policymakers. The market is segmented into parent markets and child markets, providing a granular view of growth drivers and opportunities.
Waste-to-Energy Technologies Market Dynamics & Structure
The global Waste-to-Energy (WtE) technologies market is characterized by a moderate to high concentration, with established players dominating significant portions of the parent market. Technological innovation is a key driver, fueled by advancements in combustion efficiency, waste pre-treatment, and emissions control technologies. Regulatory frameworks, including waste management policies and renewable energy mandates, play a crucial role in shaping market growth and investment. Competitive product substitutes include traditional landfilling and other renewable energy sources, though the unique value proposition of WtE in waste reduction and energy generation provides a distinct advantage. End-user demographics are evolving, with increasing demand from municipalities and industrial sectors seeking sustainable waste management solutions. Mergers and Acquisitions (M&A) trends are active as companies seek to expand their geographic reach and technological capabilities.
- Market Concentration: Leading companies like Covanta, Suez, and Veolia hold substantial market share.
- Technological Innovation Drivers: Focus on improving energy conversion efficiency, reducing environmental impact, and handling diverse waste streams.
- Regulatory Frameworks: Government incentives, landfill diversion targets, and carbon pricing mechanisms are key influencers.
- Competitive Product Substitutes: Landfilling, recycling, composting, and other renewable energy sources (solar, wind).
- End-User Demographics: Municipal solid waste (MSW) operators, industrial facilities, and power utilities.
- M&A Trends: Strategic acquisitions to gain market access, acquire new technologies, and consolidate operations. The child market of advanced gasification technologies is witnessing increased M&A activity.
Waste-to-Energy Technologies Growth Trends & Insights
The Waste-to-Energy (WtE) technologies market is poised for significant growth over the Forecast Period 2025–2033. Driven by a global imperative to reduce landfill dependency and combat climate change, market size is projected to expand robustly. Adoption rates are escalating as cities and industries recognize the dual benefits of waste valorization and sustainable energy production. Technological disruptions are continuously emerging, with innovations in plasma gasification, pyrolysis, and advanced anaerobic digestion enhancing the efficiency and environmental performance of WtE processes. Consumer behavior is shifting towards a greater appreciation for circular economy principles, indirectly boosting the demand for WtE solutions. The child market of biochemical waste-to-energy is experiencing accelerated adoption due to its potential for producing biogas and biofuels. The Estimated Year 2025 market value is anticipated to reach approximately $XX billion, with a Compound Annual Growth Rate (CAGR) of XX% during the forecast period. Market penetration is expected to deepen, particularly in developing economies with rapidly growing waste generation. The Historical Period 2019–2024 laid the foundation for this growth, with consistent investment in new WtE facilities and upgrades to existing infrastructure. The parent market of thermal WtE technologies continues to hold the largest share, but biochemical methods are rapidly gaining traction.
Dominant Regions, Countries, or Segments in Waste-to-Energy Technologies
Europe and Asia-Pacific currently dominate the global Waste-to-Energy (WtE) technologies market, driven by stringent environmental regulations, high population densities, and established waste management infrastructures. Within these regions, countries like Germany, the UK, Japan, and China are at the forefront of WtE adoption. The Power Plant Application segment within the parent market is the largest, accounting for an estimated XX% of the total market revenue in 2025. This dominance is attributed to the significant energy output and grid integration capabilities of WtE power plants. However, the Heating Plant Application is gaining momentum, particularly in colder climates where district heating networks are prevalent, representing approximately XX% of the market.
Thermal Technologies continue to be the most prevalent type of WtE technology, encompassing incineration and gasification. This segment holds an estimated XX% market share, driven by its proven reliability and scalability for handling large volumes of municipal solid waste (MSW). The child market of advanced thermal technologies, such as fluidized bed combustion, is seeing increased investment. Biochemical Reactions, including anaerobic digestion and gasification of specific waste streams, represent a growing segment, with an estimated XX% market share. This segment is fueled by the increasing demand for biogas for electricity generation and biomethane for fuel.
Key drivers for regional dominance include:
- Economic Policies: Government subsidies, feed-in tariffs, and tax incentives for renewable energy generation.
- Infrastructure: Well-developed waste collection and transportation systems, alongside robust power grid infrastructure for WtE plant integration.
- Environmental Regulations: Strict waste disposal regulations, landfill taxes, and emissions standards promoting cleaner alternatives.
- Public Acceptance: Growing public awareness and acceptance of WtE as a viable waste management solution.
- Urbanization and Industrialization: Rapid growth in waste generation in densely populated urban areas and industrial hubs.
China, with its massive waste generation and ambitious renewable energy targets, is projected to be the fastest-growing country market, followed by India and Southeast Asian nations. The CA Tokyo 23 and City of Kobe exemplify well-established WtE infrastructure in Japan.
Waste-to-Energy Technologies Product Landscape
The Waste-to-Energy (WtE) technologies market is characterized by a diverse product landscape focusing on efficient conversion of waste into valuable energy resources. Innovations in grate furnace technology, advanced boiler designs, and sophisticated flue gas treatment systems are enhancing the performance of WtE power plants, optimizing energy output and minimizing emissions. Fluidized bed incinerators offer greater flexibility in handling various waste types. In the child market of biochemical reactions, advanced anaerobic digesters are being developed for improved biogas yields and higher methane content. Plasma gasification technologies, though still in development for large-scale commercial applications, offer the potential for complete waste destruction and syngas production with minimal environmental impact. Key product innovations focus on increasing thermal efficiency, reducing operational costs, and adapting to evolving waste compositions, making WtE a competitive and sustainable energy solution.
Key Drivers, Barriers & Challenges in Waste-to-Energy Technologies
Key Drivers:
- Growing Global Waste Generation: Escalating volumes of municipal and industrial waste necessitate innovative disposal solutions.
- Need for Sustainable Energy: The global push for renewable energy sources to reduce reliance on fossil fuels.
- Stringent Environmental Regulations: Policies aimed at reducing landfill usage and controlling emissions from waste disposal.
- Economic Benefits: Revenue generation from electricity and heat sales, as well as potential for recovered materials.
- Landfill Space Scarcity: Limited availability of suitable landfill sites in many urbanized regions.
Key Barriers & Challenges:
- High Initial Capital Investment: The construction of WtE facilities requires substantial upfront funding.
- Public Perception and NIMBYism: Concerns regarding emissions, odor, and traffic can lead to local opposition.
- Waste Composition Variability: Inconsistent waste streams can impact the efficiency and operational stability of WtE plants.
- Regulatory Complexities: Navigating diverse and evolving environmental permits and operational standards.
- Competition from Recycling and Composting: While complementary, these initiatives can sometimes be perceived as competing for waste streams.
- Supply Chain Issues: Securing reliable and consistent feedstock, as well as managing ash and residue disposal. The child market for specialized catalysts in biochemical WtE faces supply chain volatility.
Emerging Opportunities in Waste-to-Energy Technologies
Emerging opportunities in the Waste-to-Energy (WtE) technologies sector are concentrated on enhancing efficiency, expanding applications, and leveraging advanced technologies. The development of smaller-scale, modular WtE units presents opportunities for decentralized waste management and energy generation in remote or smaller communities. Advancements in gasification and pyrolysis are opening doors for the production of advanced biofuels and valuable chemical feedstocks, moving beyond simple electricity generation. The integration of WtE with carbon capture technologies offers a pathway to near-zero or negative emissions, aligning with ambitious climate goals. Furthermore, the increasing focus on the circular economy is driving opportunities for recovering valuable materials from the residual waste after energy conversion, creating new revenue streams and minimizing landfill impact. The child market of waste-to-hydrogen technologies represents a nascent but significant future opportunity.
Growth Accelerators in the Waste-to-Energy Technologies Industry
The Waste-to-Energy (WtE) industry's long-term growth is being accelerated by a confluence of technological breakthroughs, strategic partnerships, and evolving market demands. Innovations in combustion efficiency, such as advanced grate designs and optimized air-fuel ratios, are continuously improving energy recovery rates. The development of more efficient and cost-effective flue gas treatment systems is crucial for meeting increasingly stringent emission standards. Strategic partnerships between WtE technology providers, waste management companies, and energy utilities are facilitating the development of integrated waste-to-energy solutions. Government initiatives, including renewable energy mandates and incentives for waste diversion, act as significant catalysts. Furthermore, the growing recognition of WtE's role in achieving climate targets and reducing reliance on fossil fuels is spurring further investment and market expansion. The parent market is seeing growth acceleration through policy support, while the child market benefits from research and development funding.
Key Players Shaping the Waste-to-Energy Technologies Market
- Covanta
- Suez
- Wheelabrator
- Veolia
- China Everbright
- A2A
- EEW Efw
- CA Tokyo 23
- Attero
- TIRU
- MVV Energie
- NEAS
- Viridor
- AEB Amsterdam
- AVR
- Tianjin Teda
- City of Kobe
- Shenzhen Energy
- Grandblue
- Osaka City Hall
- MCC
Notable Milestones in Waste-to-Energy Technologies Sector
- 2019: Increased global focus on circular economy principles and waste reduction strategies.
- 2020: Significant investments in R&D for advanced waste-to-hydrogen technologies.
- 2021: Launch of several large-scale Waste-to-Energy projects in emerging economies.
- 2022: Enhanced regulatory frameworks in Europe mandating higher recycling rates and WtE utilization.
- 2023: Advancements in plasma gasification technology demonstrated for industrial applications.
- 2024: Growing adoption of biochemical WtE solutions for biogas and biofuel production.
In-Depth Waste-to-Energy Technologies Market Outlook
The future outlook for the Waste-to-Energy (WtE) technologies market is exceptionally positive, driven by the ongoing global imperative for sustainable waste management and clean energy generation. Growth accelerators, including technological advancements in energy conversion efficiency and emission control, will continue to bolster market expansion. Strategic partnerships and collaborations will play a pivotal role in developing integrated solutions and unlocking new market segments. The increasing demand for renewable energy, coupled with stringent environmental regulations, will further solidify WtE's position as a critical component of the global energy mix. Opportunities for market expansion into developing economies with rapidly increasing waste streams remain significant. The child market for innovative waste-to-chemicals applications is expected to see substantial growth. The parent market will continue to be driven by large-scale infrastructure development. Overall, the WtE sector is well-positioned for sustained growth, contributing significantly to both waste reduction and energy security.
Waste-to-Energy Technologies Segmentation
-
1. Application
- 1.1. Power Plant
- 1.2. Heating Plant
- 1.3. Others
-
2. Types
- 2.1. Thermal Technologies
- 2.2. Biochemical Reactions
Waste-to-Energy Technologies Segmentation By Geography
-
1. North America
- 1.1. United States
- 1.2. Canada
- 1.3. Mexico
-
2. South America
- 2.1. Brazil
- 2.2. Argentina
- 2.3. Rest of South America
-
3. Europe
- 3.1. United Kingdom
- 3.2. Germany
- 3.3. France
- 3.4. Italy
- 3.5. Spain
- 3.6. Russia
- 3.7. Benelux
- 3.8. Nordics
- 3.9. Rest of Europe
-
4. Middle East & Africa
- 4.1. Turkey
- 4.2. Israel
- 4.3. GCC
- 4.4. North Africa
- 4.5. South Africa
- 4.6. Rest of Middle East & Africa
-
5. Asia Pacific
- 5.1. China
- 5.2. India
- 5.3. Japan
- 5.4. South Korea
- 5.5. ASEAN
- 5.6. Oceania
- 5.7. Rest of Asia Pacific
Waste-to-Energy Technologies REPORT HIGHLIGHTS
| Aspects | Details |
|---|---|
| Study Period | 2019-2033 |
| Base Year | 2024 |
| Estimated Year | 2025 |
| Forecast Period | 2025-2033 |
| Historical Period | 2019-2024 |
| Growth Rate | CAGR of XX% from 2019-2033 |
| Segmentation |
|
Table of Contents
- 1. Introduction
- 1.1. Research Scope
- 1.2. Market Segmentation
- 1.3. Research Methodology
- 1.4. Definitions and Assumptions
- 2. Executive Summary
- 2.1. Introduction
- 3. Market Dynamics
- 3.1. Introduction
- 3.2. Market Drivers
- 3.3. Market Restrains
- 3.4. Market Trends
- 4. Market Factor Analysis
- 4.1. Porters Five Forces
- 4.2. Supply/Value Chain
- 4.3. PESTEL analysis
- 4.4. Market Entropy
- 4.5. Patent/Trademark Analysis
- 5. Global Waste-to-Energy Technologies Analysis, Insights and Forecast, 2019-2031
- 5.1. Market Analysis, Insights and Forecast - by Application
- 5.1.1. Power Plant
- 5.1.2. Heating Plant
- 5.1.3. Others
- 5.2. Market Analysis, Insights and Forecast - by Types
- 5.2.1. Thermal Technologies
- 5.2.2. Biochemical Reactions
- 5.3. Market Analysis, Insights and Forecast - by Region
- 5.3.1. North America
- 5.3.2. South America
- 5.3.3. Europe
- 5.3.4. Middle East & Africa
- 5.3.5. Asia Pacific
- 5.1. Market Analysis, Insights and Forecast - by Application
- 6. North America Waste-to-Energy Technologies Analysis, Insights and Forecast, 2019-2031
- 6.1. Market Analysis, Insights and Forecast - by Application
- 6.1.1. Power Plant
- 6.1.2. Heating Plant
- 6.1.3. Others
- 6.2. Market Analysis, Insights and Forecast - by Types
- 6.2.1. Thermal Technologies
- 6.2.2. Biochemical Reactions
- 6.1. Market Analysis, Insights and Forecast - by Application
- 7. South America Waste-to-Energy Technologies Analysis, Insights and Forecast, 2019-2031
- 7.1. Market Analysis, Insights and Forecast - by Application
- 7.1.1. Power Plant
- 7.1.2. Heating Plant
- 7.1.3. Others
- 7.2. Market Analysis, Insights and Forecast - by Types
- 7.2.1. Thermal Technologies
- 7.2.2. Biochemical Reactions
- 7.1. Market Analysis, Insights and Forecast - by Application
- 8. Europe Waste-to-Energy Technologies Analysis, Insights and Forecast, 2019-2031
- 8.1. Market Analysis, Insights and Forecast - by Application
- 8.1.1. Power Plant
- 8.1.2. Heating Plant
- 8.1.3. Others
- 8.2. Market Analysis, Insights and Forecast - by Types
- 8.2.1. Thermal Technologies
- 8.2.2. Biochemical Reactions
- 8.1. Market Analysis, Insights and Forecast - by Application
- 9. Middle East & Africa Waste-to-Energy Technologies Analysis, Insights and Forecast, 2019-2031
- 9.1. Market Analysis, Insights and Forecast - by Application
- 9.1.1. Power Plant
- 9.1.2. Heating Plant
- 9.1.3. Others
- 9.2. Market Analysis, Insights and Forecast - by Types
- 9.2.1. Thermal Technologies
- 9.2.2. Biochemical Reactions
- 9.1. Market Analysis, Insights and Forecast - by Application
- 10. Asia Pacific Waste-to-Energy Technologies Analysis, Insights and Forecast, 2019-2031
- 10.1. Market Analysis, Insights and Forecast - by Application
- 10.1.1. Power Plant
- 10.1.2. Heating Plant
- 10.1.3. Others
- 10.2. Market Analysis, Insights and Forecast - by Types
- 10.2.1. Thermal Technologies
- 10.2.2. Biochemical Reactions
- 10.1. Market Analysis, Insights and Forecast - by Application
- 11. Competitive Analysis
- 11.1. Global Market Share Analysis 2024
- 11.2. Company Profiles
- 11.2.1 Covanta
- 11.2.1.1. Overview
- 11.2.1.2. Products
- 11.2.1.3. SWOT Analysis
- 11.2.1.4. Recent Developments
- 11.2.1.5. Financials (Based on Availability)
- 11.2.2 Suez
- 11.2.2.1. Overview
- 11.2.2.2. Products
- 11.2.2.3. SWOT Analysis
- 11.2.2.4. Recent Developments
- 11.2.2.5. Financials (Based on Availability)
- 11.2.3 Wheelabrator
- 11.2.3.1. Overview
- 11.2.3.2. Products
- 11.2.3.3. SWOT Analysis
- 11.2.3.4. Recent Developments
- 11.2.3.5. Financials (Based on Availability)
- 11.2.4 Veolia
- 11.2.4.1. Overview
- 11.2.4.2. Products
- 11.2.4.3. SWOT Analysis
- 11.2.4.4. Recent Developments
- 11.2.4.5. Financials (Based on Availability)
- 11.2.5 China Everbright
- 11.2.5.1. Overview
- 11.2.5.2. Products
- 11.2.5.3. SWOT Analysis
- 11.2.5.4. Recent Developments
- 11.2.5.5. Financials (Based on Availability)
- 11.2.6 A2A
- 11.2.6.1. Overview
- 11.2.6.2. Products
- 11.2.6.3. SWOT Analysis
- 11.2.6.4. Recent Developments
- 11.2.6.5. Financials (Based on Availability)
- 11.2.7 EEW Efw
- 11.2.7.1. Overview
- 11.2.7.2. Products
- 11.2.7.3. SWOT Analysis
- 11.2.7.4. Recent Developments
- 11.2.7.5. Financials (Based on Availability)
- 11.2.8 CA Tokyo 23
- 11.2.8.1. Overview
- 11.2.8.2. Products
- 11.2.8.3. SWOT Analysis
- 11.2.8.4. Recent Developments
- 11.2.8.5. Financials (Based on Availability)
- 11.2.9 Attero
- 11.2.9.1. Overview
- 11.2.9.2. Products
- 11.2.9.3. SWOT Analysis
- 11.2.9.4. Recent Developments
- 11.2.9.5. Financials (Based on Availability)
- 11.2.10 TIRU
- 11.2.10.1. Overview
- 11.2.10.2. Products
- 11.2.10.3. SWOT Analysis
- 11.2.10.4. Recent Developments
- 11.2.10.5. Financials (Based on Availability)
- 11.2.11 MVV Energie
- 11.2.11.1. Overview
- 11.2.11.2. Products
- 11.2.11.3. SWOT Analysis
- 11.2.11.4. Recent Developments
- 11.2.11.5. Financials (Based on Availability)
- 11.2.12 NEAS
- 11.2.12.1. Overview
- 11.2.12.2. Products
- 11.2.12.3. SWOT Analysis
- 11.2.12.4. Recent Developments
- 11.2.12.5. Financials (Based on Availability)
- 11.2.13 Viridor
- 11.2.13.1. Overview
- 11.2.13.2. Products
- 11.2.13.3. SWOT Analysis
- 11.2.13.4. Recent Developments
- 11.2.13.5. Financials (Based on Availability)
- 11.2.14 AEB Amsterdam
- 11.2.14.1. Overview
- 11.2.14.2. Products
- 11.2.14.3. SWOT Analysis
- 11.2.14.4. Recent Developments
- 11.2.14.5. Financials (Based on Availability)
- 11.2.15 AVR
- 11.2.15.1. Overview
- 11.2.15.2. Products
- 11.2.15.3. SWOT Analysis
- 11.2.15.4. Recent Developments
- 11.2.15.5. Financials (Based on Availability)
- 11.2.16 Tianjin Teda
- 11.2.16.1. Overview
- 11.2.16.2. Products
- 11.2.16.3. SWOT Analysis
- 11.2.16.4. Recent Developments
- 11.2.16.5. Financials (Based on Availability)
- 11.2.17 City of Kobe
- 11.2.17.1. Overview
- 11.2.17.2. Products
- 11.2.17.3. SWOT Analysis
- 11.2.17.4. Recent Developments
- 11.2.17.5. Financials (Based on Availability)
- 11.2.18 Shenzhen Energy
- 11.2.18.1. Overview
- 11.2.18.2. Products
- 11.2.18.3. SWOT Analysis
- 11.2.18.4. Recent Developments
- 11.2.18.5. Financials (Based on Availability)
- 11.2.19 Grandblue
- 11.2.19.1. Overview
- 11.2.19.2. Products
- 11.2.19.3. SWOT Analysis
- 11.2.19.4. Recent Developments
- 11.2.19.5. Financials (Based on Availability)
- 11.2.20 Osaka City Hall
- 11.2.20.1. Overview
- 11.2.20.2. Products
- 11.2.20.3. SWOT Analysis
- 11.2.20.4. Recent Developments
- 11.2.20.5. Financials (Based on Availability)
- 11.2.21 MCC
- 11.2.21.1. Overview
- 11.2.21.2. Products
- 11.2.21.3. SWOT Analysis
- 11.2.21.4. Recent Developments
- 11.2.21.5. Financials (Based on Availability)
- 11.2.1 Covanta
List of Figures
- Figure 1: Global Waste-to-Energy Technologies Revenue Breakdown (million, %) by Region 2024 & 2032
- Figure 2: North America Waste-to-Energy Technologies Revenue (million), by Application 2024 & 2032
- Figure 3: North America Waste-to-Energy Technologies Revenue Share (%), by Application 2024 & 2032
- Figure 4: North America Waste-to-Energy Technologies Revenue (million), by Types 2024 & 2032
- Figure 5: North America Waste-to-Energy Technologies Revenue Share (%), by Types 2024 & 2032
- Figure 6: North America Waste-to-Energy Technologies Revenue (million), by Country 2024 & 2032
- Figure 7: North America Waste-to-Energy Technologies Revenue Share (%), by Country 2024 & 2032
- Figure 8: South America Waste-to-Energy Technologies Revenue (million), by Application 2024 & 2032
- Figure 9: South America Waste-to-Energy Technologies Revenue Share (%), by Application 2024 & 2032
- Figure 10: South America Waste-to-Energy Technologies Revenue (million), by Types 2024 & 2032
- Figure 11: South America Waste-to-Energy Technologies Revenue Share (%), by Types 2024 & 2032
- Figure 12: South America Waste-to-Energy Technologies Revenue (million), by Country 2024 & 2032
- Figure 13: South America Waste-to-Energy Technologies Revenue Share (%), by Country 2024 & 2032
- Figure 14: Europe Waste-to-Energy Technologies Revenue (million), by Application 2024 & 2032
- Figure 15: Europe Waste-to-Energy Technologies Revenue Share (%), by Application 2024 & 2032
- Figure 16: Europe Waste-to-Energy Technologies Revenue (million), by Types 2024 & 2032
- Figure 17: Europe Waste-to-Energy Technologies Revenue Share (%), by Types 2024 & 2032
- Figure 18: Europe Waste-to-Energy Technologies Revenue (million), by Country 2024 & 2032
- Figure 19: Europe Waste-to-Energy Technologies Revenue Share (%), by Country 2024 & 2032
- Figure 20: Middle East & Africa Waste-to-Energy Technologies Revenue (million), by Application 2024 & 2032
- Figure 21: Middle East & Africa Waste-to-Energy Technologies Revenue Share (%), by Application 2024 & 2032
- Figure 22: Middle East & Africa Waste-to-Energy Technologies Revenue (million), by Types 2024 & 2032
- Figure 23: Middle East & Africa Waste-to-Energy Technologies Revenue Share (%), by Types 2024 & 2032
- Figure 24: Middle East & Africa Waste-to-Energy Technologies Revenue (million), by Country 2024 & 2032
- Figure 25: Middle East & Africa Waste-to-Energy Technologies Revenue Share (%), by Country 2024 & 2032
- Figure 26: Asia Pacific Waste-to-Energy Technologies Revenue (million), by Application 2024 & 2032
- Figure 27: Asia Pacific Waste-to-Energy Technologies Revenue Share (%), by Application 2024 & 2032
- Figure 28: Asia Pacific Waste-to-Energy Technologies Revenue (million), by Types 2024 & 2032
- Figure 29: Asia Pacific Waste-to-Energy Technologies Revenue Share (%), by Types 2024 & 2032
- Figure 30: Asia Pacific Waste-to-Energy Technologies Revenue (million), by Country 2024 & 2032
- Figure 31: Asia Pacific Waste-to-Energy Technologies Revenue Share (%), by Country 2024 & 2032
List of Tables
- Table 1: Global Waste-to-Energy Technologies Revenue million Forecast, by Region 2019 & 2032
- Table 2: Global Waste-to-Energy Technologies Revenue million Forecast, by Application 2019 & 2032
- Table 3: Global Waste-to-Energy Technologies Revenue million Forecast, by Types 2019 & 2032
- Table 4: Global Waste-to-Energy Technologies Revenue million Forecast, by Region 2019 & 2032
- Table 5: Global Waste-to-Energy Technologies Revenue million Forecast, by Application 2019 & 2032
- Table 6: Global Waste-to-Energy Technologies Revenue million Forecast, by Types 2019 & 2032
- Table 7: Global Waste-to-Energy Technologies Revenue million Forecast, by Country 2019 & 2032
- Table 8: United States Waste-to-Energy Technologies Revenue (million) Forecast, by Application 2019 & 2032
- Table 9: Canada Waste-to-Energy Technologies Revenue (million) Forecast, by Application 2019 & 2032
- Table 10: Mexico Waste-to-Energy Technologies Revenue (million) Forecast, by Application 2019 & 2032
- Table 11: Global Waste-to-Energy Technologies Revenue million Forecast, by Application 2019 & 2032
- Table 12: Global Waste-to-Energy Technologies Revenue million Forecast, by Types 2019 & 2032
- Table 13: Global Waste-to-Energy Technologies Revenue million Forecast, by Country 2019 & 2032
- Table 14: Brazil Waste-to-Energy Technologies Revenue (million) Forecast, by Application 2019 & 2032
- Table 15: Argentina Waste-to-Energy Technologies Revenue (million) Forecast, by Application 2019 & 2032
- Table 16: Rest of South America Waste-to-Energy Technologies Revenue (million) Forecast, by Application 2019 & 2032
- Table 17: Global Waste-to-Energy Technologies Revenue million Forecast, by Application 2019 & 2032
- Table 18: Global Waste-to-Energy Technologies Revenue million Forecast, by Types 2019 & 2032
- Table 19: Global Waste-to-Energy Technologies Revenue million Forecast, by Country 2019 & 2032
- Table 20: United Kingdom Waste-to-Energy Technologies Revenue (million) Forecast, by Application 2019 & 2032
- Table 21: Germany Waste-to-Energy Technologies Revenue (million) Forecast, by Application 2019 & 2032
- Table 22: France Waste-to-Energy Technologies Revenue (million) Forecast, by Application 2019 & 2032
- Table 23: Italy Waste-to-Energy Technologies Revenue (million) Forecast, by Application 2019 & 2032
- Table 24: Spain Waste-to-Energy Technologies Revenue (million) Forecast, by Application 2019 & 2032
- Table 25: Russia Waste-to-Energy Technologies Revenue (million) Forecast, by Application 2019 & 2032
- Table 26: Benelux Waste-to-Energy Technologies Revenue (million) Forecast, by Application 2019 & 2032
- Table 27: Nordics Waste-to-Energy Technologies Revenue (million) Forecast, by Application 2019 & 2032
- Table 28: Rest of Europe Waste-to-Energy Technologies Revenue (million) Forecast, by Application 2019 & 2032
- Table 29: Global Waste-to-Energy Technologies Revenue million Forecast, by Application 2019 & 2032
- Table 30: Global Waste-to-Energy Technologies Revenue million Forecast, by Types 2019 & 2032
- Table 31: Global Waste-to-Energy Technologies Revenue million Forecast, by Country 2019 & 2032
- Table 32: Turkey Waste-to-Energy Technologies Revenue (million) Forecast, by Application 2019 & 2032
- Table 33: Israel Waste-to-Energy Technologies Revenue (million) Forecast, by Application 2019 & 2032
- Table 34: GCC Waste-to-Energy Technologies Revenue (million) Forecast, by Application 2019 & 2032
- Table 35: North Africa Waste-to-Energy Technologies Revenue (million) Forecast, by Application 2019 & 2032
- Table 36: South Africa Waste-to-Energy Technologies Revenue (million) Forecast, by Application 2019 & 2032
- Table 37: Rest of Middle East & Africa Waste-to-Energy Technologies Revenue (million) Forecast, by Application 2019 & 2032
- Table 38: Global Waste-to-Energy Technologies Revenue million Forecast, by Application 2019 & 2032
- Table 39: Global Waste-to-Energy Technologies Revenue million Forecast, by Types 2019 & 2032
- Table 40: Global Waste-to-Energy Technologies Revenue million Forecast, by Country 2019 & 2032
- Table 41: China Waste-to-Energy Technologies Revenue (million) Forecast, by Application 2019 & 2032
- Table 42: India Waste-to-Energy Technologies Revenue (million) Forecast, by Application 2019 & 2032
- Table 43: Japan Waste-to-Energy Technologies Revenue (million) Forecast, by Application 2019 & 2032
- Table 44: South Korea Waste-to-Energy Technologies Revenue (million) Forecast, by Application 2019 & 2032
- Table 45: ASEAN Waste-to-Energy Technologies Revenue (million) Forecast, by Application 2019 & 2032
- Table 46: Oceania Waste-to-Energy Technologies Revenue (million) Forecast, by Application 2019 & 2032
- Table 47: Rest of Asia Pacific Waste-to-Energy Technologies Revenue (million) Forecast, by Application 2019 & 2032
Frequently Asked Questions
1. What is the projected Compound Annual Growth Rate (CAGR) of the Waste-to-Energy Technologies?
The projected CAGR is approximately XX%.
2. Which companies are prominent players in the Waste-to-Energy Technologies?
Key companies in the market include Covanta, Suez, Wheelabrator, Veolia, China Everbright, A2A, EEW Efw, CA Tokyo 23, Attero, TIRU, MVV Energie, NEAS, Viridor, AEB Amsterdam, AVR, Tianjin Teda, City of Kobe, Shenzhen Energy, Grandblue, Osaka City Hall, MCC.
3. What are the main segments of the Waste-to-Energy Technologies?
The market segments include Application, Types.
4. Can you provide details about the market size?
The market size is estimated to be USD XXX million as of 2022.
5. What are some drivers contributing to market growth?
N/A
6. What are the notable trends driving market growth?
N/A
7. Are there any restraints impacting market growth?
N/A
8. Can you provide examples of recent developments in the market?
N/A
9. What pricing options are available for accessing the report?
Pricing options include single-user, multi-user, and enterprise licenses priced at USD 3350.00, USD 5025.00, and USD 6700.00 respectively.
10. Is the market size provided in terms of value or volume?
The market size is provided in terms of value, measured in million.
11. Are there any specific market keywords associated with the report?
Yes, the market keyword associated with the report is "Waste-to-Energy Technologies," which aids in identifying and referencing the specific market segment covered.
12. How do I determine which pricing option suits my needs best?
The pricing options vary based on user requirements and access needs. Individual users may opt for single-user licenses, while businesses requiring broader access may choose multi-user or enterprise licenses for cost-effective access to the report.
13. Are there any additional resources or data provided in the Waste-to-Energy Technologies report?
While the report offers comprehensive insights, it's advisable to review the specific contents or supplementary materials provided to ascertain if additional resources or data are available.
14. How can I stay updated on further developments or reports in the Waste-to-Energy Technologies?
To stay informed about further developments, trends, and reports in the Waste-to-Energy Technologies, consider subscribing to industry newsletters, following relevant companies and organizations, or regularly checking reputable industry news sources and publications.
Methodology
Step 1 - Identification of Relevant Samples Size from Population Database


Step 2 - Approaches for Defining Global Market Size (Value, Volume* & Price*)

Note*: In applicable scenarios
Step 3 - Data Sources
Primary Research
- Web Analytics
- Survey Reports
- Research Institute
- Latest Research Reports
- Opinion Leaders
Secondary Research
- Annual Reports
- White Paper
- Latest Press Release
- Industry Association
- Paid Database
- Investor Presentations

Step 4 - Data Triangulation
Involves using different sources of information in order to increase the validity of a study
These sources are likely to be stakeholders in a program - participants, other researchers, program staff, other community members, and so on.
Then we put all data in single framework & apply various statistical tools to find out the dynamic on the market.
During the analysis stage, feedback from the stakeholder groups would be compared to determine areas of agreement as well as areas of divergence


