

Key Insights
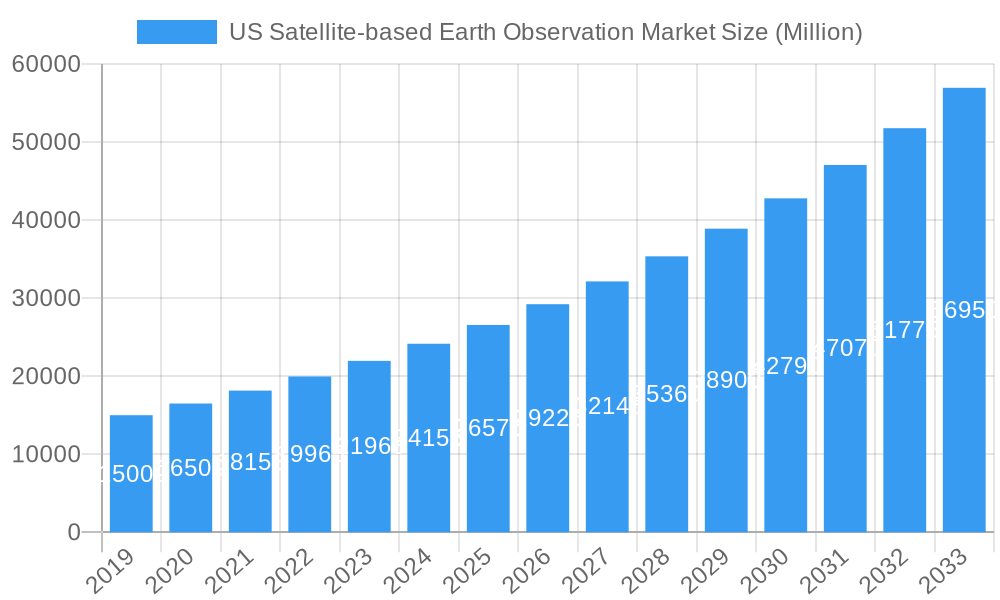
The US Satellite-based Earth Observation market is projected for significant expansion, anticipated to reach $3.9 billion by 2025, with a Compound Annual Growth Rate (CAGR) of 5.9% through 2033. This growth is propelled by increasing demand for high-resolution imagery and advanced analytical services across various industries. Key drivers include the critical need for precise environmental monitoring, the expanding geospatial data analytics sector, and technological advancements in satellite capabilities for more frequent and comprehensive data acquisition. The market is shifting towards value-added services, transitioning from raw data provision to sophisticated interpretation and actionable intelligence. This evolution is vital for sectors like climate services, where detailed earth observation data is indispensable for climate modeling and adaptation strategies.
US Satellite-based Earth Observation Market Market Size (In Billion)
The integration of Earth Observation (EO) data into urban development, infrastructure management, and precision agriculture is accelerating market adoption. Innovations in AI and machine learning are enhancing EO data's analytical capabilities, creating new applications and revenue opportunities. While Low Earth Orbit (LEO) satellites dominate due to high revisit rates and spatial resolution, Medium Earth Orbit (MEO) and Geostationary Orbit (GEO) satellites remain essential for applications requiring broad coverage and continuous monitoring. The competitive landscape features established aerospace and defense firms alongside agile, data-focused startups, all competing through innovation and strategic alliances. The US market is particularly strengthened by robust government investment in space programs and a dynamic private sector ecosystem.
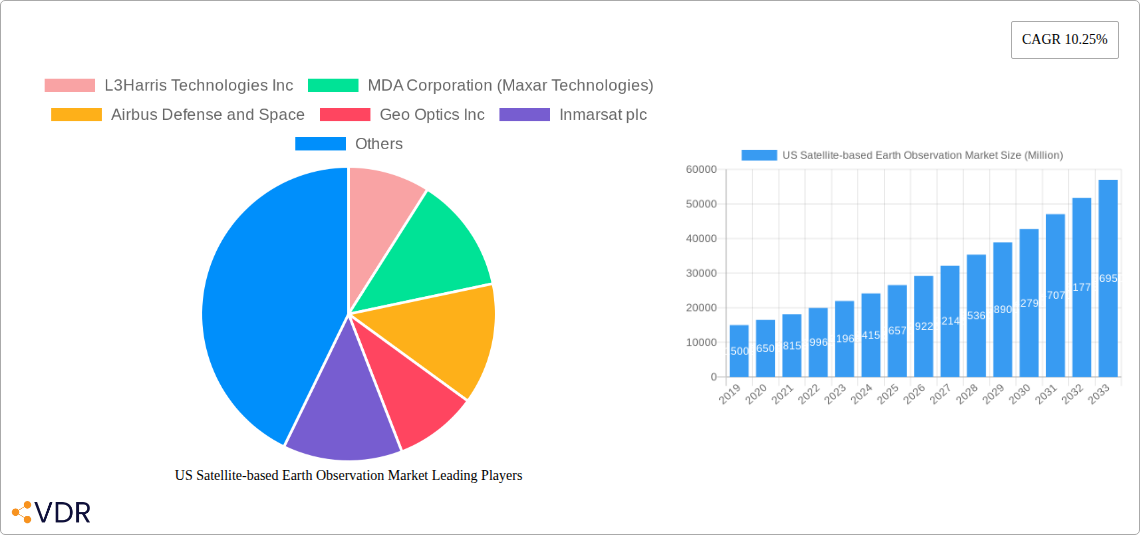
US Satellite-based Earth Observation Market Company Market Share
US Satellite-based Earth Observation Market Report: Unlocking Growth in a Dynamic Landscape
This comprehensive report delves into the US Satellite-based Earth Observation Market, providing critical insights and actionable intelligence for stakeholders. Spanning from 2019 to 2033, with a base year of 2025, this analysis leverages historical data, current trends, and future projections to illuminate market dynamics, growth trajectories, and competitive landscapes. Our deep dive into Earth Observation Data and Value Added Services, considering Low Earth Orbit (LEO), Medium Earth Orbit (MEO), and Geostationary Orbit (GEO) satellites, offers a holistic view of this rapidly evolving sector. We meticulously examine the influence of key end-users such as Urban Development and Cultural Heritage, Agriculture, Climate Services, Energy and Raw Materials, and Infrastructure.
US Satellite-based Earth Observation Market Market Dynamics & Structure
The US Satellite-based Earth Observation Market is characterized by a dynamic and evolving structure, influenced by significant technological advancements, stringent regulatory frameworks, and a competitive landscape featuring both established giants and agile innovators. Market concentration remains moderate, with a few key players holding substantial influence while a growing number of specialized firms contribute to innovation. Technological innovation is primarily driven by the demand for higher resolution imagery, increased data processing capabilities, and the integration of artificial intelligence (AI) and machine learning (ML) for advanced analytics. Regulatory frameworks, particularly those from agencies like the FCC and NOAA, play a crucial role in shaping operational standards and market access. Competitive product substitutes, while limited in direct satellite observation, emerge from alternative data sources like drone imagery and ground-based sensors, necessitating continuous innovation from satellite operators. End-user demographics are diversifying, with increased adoption across various sectors, fueling demand for tailored solutions. Mergers and acquisitions (M&A) are a significant trend, with companies seeking to consolidate capabilities, expand their data portfolios, and gain a competitive edge. For instance, the acquisition of smaller data providers by larger entities can significantly alter market share. Barriers to innovation include high upfront investment costs for satellite development and launch, as well as the long lead times associated with technological development and deployment. The market share of major players is closely guarded, but significant consolidation has been observed in recent years, with companies like Maxar Technologies and Airbus Defense and Space actively engaging in strategic acquisitions.
- Market Concentration: Moderate, with key players like L3Harris Technologies, MDA Corporation, and Airbus Defense and Space holding significant shares.
- Technological Innovation Drivers: Demand for high-resolution data, AI/ML integration, advanced analytics, and miniaturization of satellite technology.
- Regulatory Frameworks: FCC licensing, NOAA data policies, and national security considerations significantly impact market operations.
- Competitive Product Substitutes: Drone-based imagery, ground sensor networks, and aerial photography.
- End-User Demographics: Growing adoption across agriculture, urban planning, climate research, energy exploration, and defense.
- M&A Trends: Active consolidation to acquire new technologies, expand service offerings, and enhance market reach.
US Satellite-based Earth Observation Market Growth Trends & Insights
The US Satellite-based Earth Observation Market is poised for substantial growth, fueled by an ever-increasing demand for actionable insights derived from geospatial data. The market size is projected to witness robust expansion, with adoption rates accelerating across various industries as organizations recognize the transformative potential of satellite imagery and derived services. Technological disruptions, such as the proliferation of small satellites, advancements in sensor technology, and the integration of sophisticated AI algorithms, are reshaping the market's capabilities and accessibility. Consumer behavior shifts are evident as end-users move from merely purchasing raw imagery to seeking comprehensive, value-added solutions that provide direct answers to complex questions. The market's trajectory is characterized by a sustained Compound Annual Growth Rate (CAGR) that reflects the deepening integration of earth observation data into critical decision-making processes. For example, advancements in machine learning for object detection and change analysis are enabling more efficient and precise monitoring of agricultural yields, infrastructure development, and environmental changes, thereby driving higher adoption rates. Furthermore, the increasing accessibility of data through cloud-based platforms and standardized APIs is democratizing the use of satellite-derived information, bringing new users into the market. The evolution of satellite constellations, moving towards constellations with higher revisit rates and broader coverage, further enhances the value proposition for time-sensitive applications like disaster response and precision agriculture. The market penetration of sophisticated analytics tools, which enable users to extract complex patterns and predict future trends from raw data, is a key indicator of this evolving landscape.
Dominant Regions, Countries, or Segments in US Satellite-based Earth Observation Market
Within the US Satellite-based Earth Observation Market, several key segments and end-users are demonstrating exceptional growth and influence. The Earth Observation Data segment remains foundational, providing the raw material for all subsequent applications. However, the Value Added Services segment is experiencing a significant surge, as end-users increasingly demand processed, analyzed, and actionable insights rather than just raw imagery. This shift is driven by the complexity of data interpretation and the need for specialized expertise. Among satellite orbits, Low Earth Orbit (LEO) constellations are gaining significant traction due to their ability to provide higher revisit rates and thus more frequent data acquisition, which is crucial for applications requiring near real-time monitoring. While Geostationary Orbit (GEO) satellites continue to be vital for broad-area, continuous monitoring, and specific applications like meteorology, the agility and detail offered by LEO are increasingly sought after.
In terms of end-users, Agriculture stands out as a dominant driver of market growth. Precision agriculture, enabled by satellite data for crop health monitoring, yield prediction, soil analysis, and irrigation management, is revolutionizing farming practices, leading to increased efficiency and reduced environmental impact. Following closely is Climate Services, where satellite observations are indispensable for monitoring climate change indicators, tracking extreme weather events, assessing carbon emissions, and supporting climate modeling efforts. Infrastructure development and monitoring, including urban planning, construction progress tracking, and the assessment of critical infrastructure integrity, also represent a substantial and growing segment.
- Dominant Segment (Type): Value Added Services, driven by demand for analytics and actionable insights.
- Dominant Orbit: Low Earth Orbit (LEO) due to its high revisit rates for frequent monitoring.
- Key End-User Segments Driving Growth:
- Agriculture: Precision farming, crop health monitoring, yield prediction.
- Climate Services: Climate change monitoring, weather forecasting, environmental assessment.
- Infrastructure: Urban planning, construction monitoring, asset management.
- Energy and Raw Materials: Exploration, extraction monitoring, environmental impact assessment.
The economic policies that incentivize sustainable practices and technological adoption, coupled with robust government investment in environmental monitoring and infrastructure development, further bolster the growth of these segments. The market share within these dominant segments is influenced by the quality and resolution of data, the sophistication of analytical tools, and the ability of service providers to tailor solutions to specific industry needs. The growth potential in these areas remains substantial, promising continued innovation and investment.
US Satellite-based Earth Observation Market Product Landscape
The US Satellite-based Earth Observation Market product landscape is characterized by continuous innovation, expanding applications, and improving performance metrics. High-resolution optical imagery, synthetic aperture radar (SAR) data, and hyperspectral sensors are at the forefront, offering unprecedented detail for various applications. Innovations are focused on miniaturization, increased spectral and temporal resolution, and enhanced data processing capabilities. Unique selling propositions often lie in the ability to integrate multiple data streams, leverage AI for automated feature extraction and change detection, and provide near real-time data delivery. Technological advancements are enabling more precise applications in areas like crop stress detection, infrastructure deformation monitoring, and urban sprawl analysis. For example, Planet Labs Inc. offers daily imaging of the entire Earth, providing unparalleled temporal resolution for monitoring dynamic environments. The performance metrics are constantly being pushed, with improvements in spatial resolution down to sub-meter levels and significant reductions in revisit times.
Key Drivers, Barriers & Challenges in US Satellite-based Earth Observation Market
The US Satellite-based Earth Observation Market is propelled by several key drivers. Technological advancements in satellite and sensor technology, including miniaturization and increased resolution, are fundamental. The growing global demand for data-driven decision-making across sectors like agriculture, climate monitoring, and urban planning further fuels growth. Government initiatives and investments in space exploration and Earth observation programs, alongside increasing private sector investment, act as significant catalysts. Furthermore, the rising awareness of environmental challenges and the need for sustainable resource management are creating a robust demand for satellite-derived insights.
However, the market faces notable barriers and challenges. The substantial upfront capital investment required for satellite development, launch, and ground infrastructure remains a significant hurdle. Regulatory complexities and the need for international cooperation for data sharing and spectrum allocation can also pose challenges. Supply chain issues, particularly for specialized components and launch services, can lead to project delays and increased costs. Competitive pressures from alternative data sources like drone imagery and ground-based sensors necessitate continuous innovation and cost optimization. Data processing and analysis can be computationally intensive and require specialized expertise, limiting adoption for some users.
Emerging Opportunities in US Satellite-based Earth Observation Market
Emerging opportunities in the US Satellite-based Earth Observation Market lie in several key areas. The growing demand for AI-powered analytics and automated insights presents a significant avenue for value creation. The development of integrated platforms that combine satellite data with other geospatial information sources, such as IoT sensor data, is poised for growth. Untapped markets in developing nations, where the need for agricultural optimization, infrastructure development, and disaster management is paramount, offer substantial potential. Furthermore, innovative applications in areas like precision forestry, maritime surveillance, and the monitoring of renewable energy infrastructure are emerging. The increasing focus on sustainability and ESG (Environmental, Social, and Governance) reporting is creating new opportunities for companies providing data to track environmental impact and corporate responsibility.
Growth Accelerators in the US Satellite-based Earth Observation Market Industry
Several factors are accelerating long-term growth in the US Satellite-based Earth Observation Market Industry. Continuous technological breakthroughs in sensor design, on-orbit processing capabilities, and data transmission are enhancing the utility and accessibility of satellite data. Strategic partnerships between satellite operators, data analytics providers, and end-users are crucial for developing tailored solutions and fostering wider adoption. Market expansion strategies, including the development of user-friendly platforms and accessible pricing models, are broadening the customer base. The increasing role of cloud computing in data storage, processing, and dissemination is a significant growth accelerator, enabling scalability and reducing the technical barriers for users. Moreover, the growing recognition of the strategic importance of space-based assets for national security and economic competitiveness is driving sustained government support and investment, further stimulating market expansion.
Key Players Shaping the US Satellite-based Earth Observation Market Market
- L3Harris Technologies Inc
- MDA Corporation (Maxar Technologies)
- Airbus Defense and Space
- Geo Optics Inc
- Inmarsat plc
- PlanetIQ LLC
- Aytheon Technologies Corporation
- Thales Group
- Satcom Technologies
- Planet Labs Inc
Notable Milestones in US Satellite-based Earth Observation Market Sector
- April 2023: SpaceX launches the Intelsat 40e satellite as part of a NASA Earth-observation program. Intelsat 40e is a high-throughput geostationary satellite that will serve the company's government and corporate customers in North and Central America, enhancing geostationary observation capabilities.
- November 2022: GeoOptics Inc. was awarded a National Aeronautics and Space Administration (NASA) contract for up to USD 7 million over a five-year period. The contract aims to provide academics with data collected by the company's small satellite constellation. GeoOptics will specifically provide radio occultation data for weather forecasting to the National Oceanic and Atmospheric Administration (NOAA), highlighting the growing importance of specialized data for weather prediction.
In-Depth US Satellite-based Earth Observation Market Market Outlook
The US Satellite-based Earth Observation Market outlook is exceptionally promising, driven by sustained innovation and expanding applications. Growth accelerators such as the integration of advanced AI for automated data interpretation, the proliferation of constellations offering enhanced revisit rates, and the development of end-to-end geospatial solutions will continue to shape the market. Strategic partnerships and the increasing commoditization of data will further democratize access, driving adoption across a wider range of industries and government agencies. The market's future potential lies in its ability to provide increasingly precise, timely, and actionable intelligence for critical global challenges, from climate change mitigation to sustainable resource management and infrastructure resilience. This will foster a period of significant investment and technological advancement.
US Satellite-based Earth Observation Market Segmentation
-
1. Type
- 1.1. Earth Observation Data
- 1.2. Value Added Services
-
2. Satellite Orbit
- 2.1. Low Earth Orbit
- 2.2. Medium Earth Orbit
- 2.3. Geostationary Orbit
-
3. End-User
- 3.1. Urban Development and Cultural Heritage
- 3.2. Agriculture
- 3.3. Climate Services
- 3.4. Energy and Raw Materials
- 3.5. Infrastructure
- 3.6. Other End-Users
US Satellite-based Earth Observation Market Segmentation By Geography
-
1. North America
- 1.1. United States
- 1.2. Canada
- 1.3. Mexico
-
2. South America
- 2.1. Brazil
- 2.2. Argentina
- 2.3. Rest of South America
-
3. Europe
- 3.1. United Kingdom
- 3.2. Germany
- 3.3. France
- 3.4. Italy
- 3.5. Spain
- 3.6. Russia
- 3.7. Benelux
- 3.8. Nordics
- 3.9. Rest of Europe
-
4. Middle East & Africa
- 4.1. Turkey
- 4.2. Israel
- 4.3. GCC
- 4.4. North Africa
- 4.5. South Africa
- 4.6. Rest of Middle East & Africa
-
5. Asia Pacific
- 5.1. China
- 5.2. India
- 5.3. Japan
- 5.4. South Korea
- 5.5. ASEAN
- 5.6. Oceania
- 5.7. Rest of Asia Pacific
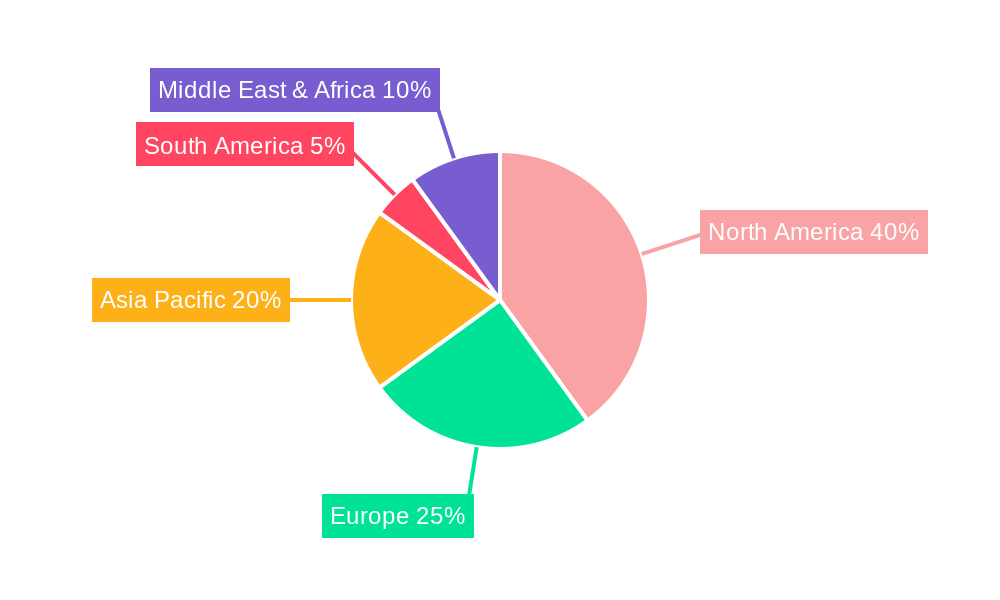
US Satellite-based Earth Observation Market Regional Market Share
Geographic Coverage of US Satellite-based Earth Observation Market
US Satellite-based Earth Observation Market REPORT HIGHLIGHTS
| Aspects | Details |
|---|---|
| Study Period | 2020-2034 |
| Base Year | 2025 |
| Estimated Year | 2026 |
| Forecast Period | 2026-2034 |
| Historical Period | 2020-2025 |
| Growth Rate | CAGR of 5.9% from 2020-2034 |
| Segmentation |
|
Table of Contents
- 1. Introduction
- 1.1. Research Scope
- 1.2. Market Segmentation
- 1.3. Research Objective
- 1.4. Definitions and Assumptions
- 2. Executive Summary
- 2.1. Market Snapshot
- 3. Market Dynamics
- 3.1. Market Drivers
- 3.2. Market Restrains
- 3.3. Market Trends
- 3.4. Market Opportunities
- 4. Market Factor Analysis
- 4.1. Porters Five Forces
- 4.1.1. Bargaining Power of Suppliers
- 4.1.2. Bargaining Power of Buyers
- 4.1.3. Threat of New Entrants
- 4.1.4. Threat of Substitutes
- 4.1.5. Competitive Rivalry
- 4.2. PESTEL analysis
- 4.3. BCG Analysis
- 4.3.1. Stars (High Growth, High Market Share)
- 4.3.2. Cash Cows (Low Growth, High Market Share)
- 4.3.3. Question Mark (High Growth, Low Market Share)
- 4.3.4. Dogs (Low Growth, Low Market Share)
- 4.4. Ansoff Matrix Analysis
- 4.5. Supply Chain Analysis
- 4.6. Regulatory Landscape
- 4.7. Current Market Potential and Opportunity Assessment (TAM–SAM–SOM Framework)
- 4.8. VDR Analyst Note
- 4.1. Porters Five Forces
- 5. Market Analysis, Insights and Forecast 2021-2033
- 5.1. Market Analysis, Insights and Forecast - by Type
- 5.1.1. Earth Observation Data
- 5.1.2. Value Added Services
- 5.2. Market Analysis, Insights and Forecast - by Satellite Orbit
- 5.2.1. Low Earth Orbit
- 5.2.2. Medium Earth Orbit
- 5.2.3. Geostationary Orbit
- 5.3. Market Analysis, Insights and Forecast - by End-User
- 5.3.1. Urban Development and Cultural Heritage
- 5.3.2. Agriculture
- 5.3.3. Climate Services
- 5.3.4. Energy and Raw Materials
- 5.3.5. Infrastructure
- 5.3.6. Other End-Users
- 5.4. Market Analysis, Insights and Forecast - by Region
- 5.4.1. North America
- 5.4.2. South America
- 5.4.3. Europe
- 5.4.4. Middle East & Africa
- 5.4.5. Asia Pacific
- 5.1. Market Analysis, Insights and Forecast - by Type
- 6. Global US Satellite-based Earth Observation Market Analysis, Insights and Forecast, 2021-2033
- 6.1. Market Analysis, Insights and Forecast - by Type
- 6.1.1. Earth Observation Data
- 6.1.2. Value Added Services
- 6.2. Market Analysis, Insights and Forecast - by Satellite Orbit
- 6.2.1. Low Earth Orbit
- 6.2.2. Medium Earth Orbit
- 6.2.3. Geostationary Orbit
- 6.3. Market Analysis, Insights and Forecast - by End-User
- 6.3.1. Urban Development and Cultural Heritage
- 6.3.2. Agriculture
- 6.3.3. Climate Services
- 6.3.4. Energy and Raw Materials
- 6.3.5. Infrastructure
- 6.3.6. Other End-Users
- 6.1. Market Analysis, Insights and Forecast - by Type
- 7. North America US Satellite-based Earth Observation Market Analysis, Insights and Forecast, 2021-2033
- 7.1. Market Analysis, Insights and Forecast - by Type
- 7.1.1. Earth Observation Data
- 7.1.2. Value Added Services
- 7.2. Market Analysis, Insights and Forecast - by Satellite Orbit
- 7.2.1. Low Earth Orbit
- 7.2.2. Medium Earth Orbit
- 7.2.3. Geostationary Orbit
- 7.3. Market Analysis, Insights and Forecast - by End-User
- 7.3.1. Urban Development and Cultural Heritage
- 7.3.2. Agriculture
- 7.3.3. Climate Services
- 7.3.4. Energy and Raw Materials
- 7.3.5. Infrastructure
- 7.3.6. Other End-Users
- 7.1. Market Analysis, Insights and Forecast - by Type
- 8. South America US Satellite-based Earth Observation Market Analysis, Insights and Forecast, 2021-2033
- 8.1. Market Analysis, Insights and Forecast - by Type
- 8.1.1. Earth Observation Data
- 8.1.2. Value Added Services
- 8.2. Market Analysis, Insights and Forecast - by Satellite Orbit
- 8.2.1. Low Earth Orbit
- 8.2.2. Medium Earth Orbit
- 8.2.3. Geostationary Orbit
- 8.3. Market Analysis, Insights and Forecast - by End-User
- 8.3.1. Urban Development and Cultural Heritage
- 8.3.2. Agriculture
- 8.3.3. Climate Services
- 8.3.4. Energy and Raw Materials
- 8.3.5. Infrastructure
- 8.3.6. Other End-Users
- 8.1. Market Analysis, Insights and Forecast - by Type
- 9. Europe US Satellite-based Earth Observation Market Analysis, Insights and Forecast, 2021-2033
- 9.1. Market Analysis, Insights and Forecast - by Type
- 9.1.1. Earth Observation Data
- 9.1.2. Value Added Services
- 9.2. Market Analysis, Insights and Forecast - by Satellite Orbit
- 9.2.1. Low Earth Orbit
- 9.2.2. Medium Earth Orbit
- 9.2.3. Geostationary Orbit
- 9.3. Market Analysis, Insights and Forecast - by End-User
- 9.3.1. Urban Development and Cultural Heritage
- 9.3.2. Agriculture
- 9.3.3. Climate Services
- 9.3.4. Energy and Raw Materials
- 9.3.5. Infrastructure
- 9.3.6. Other End-Users
- 9.1. Market Analysis, Insights and Forecast - by Type
- 10. Middle East & Africa US Satellite-based Earth Observation Market Analysis, Insights and Forecast, 2021-2033
- 10.1. Market Analysis, Insights and Forecast - by Type
- 10.1.1. Earth Observation Data
- 10.1.2. Value Added Services
- 10.2. Market Analysis, Insights and Forecast - by Satellite Orbit
- 10.2.1. Low Earth Orbit
- 10.2.2. Medium Earth Orbit
- 10.2.3. Geostationary Orbit
- 10.3. Market Analysis, Insights and Forecast - by End-User
- 10.3.1. Urban Development and Cultural Heritage
- 10.3.2. Agriculture
- 10.3.3. Climate Services
- 10.3.4. Energy and Raw Materials
- 10.3.5. Infrastructure
- 10.3.6. Other End-Users
- 10.1. Market Analysis, Insights and Forecast - by Type
- 11. Asia Pacific US Satellite-based Earth Observation Market Analysis, Insights and Forecast, 2021-2033
- 11.1. Market Analysis, Insights and Forecast - by Type
- 11.1.1. Earth Observation Data
- 11.1.2. Value Added Services
- 11.2. Market Analysis, Insights and Forecast - by Satellite Orbit
- 11.2.1. Low Earth Orbit
- 11.2.2. Medium Earth Orbit
- 11.2.3. Geostationary Orbit
- 11.3. Market Analysis, Insights and Forecast - by End-User
- 11.3.1. Urban Development and Cultural Heritage
- 11.3.2. Agriculture
- 11.3.3. Climate Services
- 11.3.4. Energy and Raw Materials
- 11.3.5. Infrastructure
- 11.3.6. Other End-Users
- 11.1. Market Analysis, Insights and Forecast - by Type
- 12. Competitive Analysis
- 12.1. Company Profiles
- 12.1.1 L3Harris Technologies Inc
- 12.1.1.1. Company Overview
- 12.1.1.2. Products
- 12.1.1.3. Company Financials
- 12.1.1.4. SWOT Analysis
- 12.1.2 MDA Corporation (Maxar Technologies)
- 12.1.2.1. Company Overview
- 12.1.2.2. Products
- 12.1.2.3. Company Financials
- 12.1.2.4. SWOT Analysis
- 12.1.3 Airbus Defense and Space
- 12.1.3.1. Company Overview
- 12.1.3.2. Products
- 12.1.3.3. Company Financials
- 12.1.3.4. SWOT Analysis
- 12.1.4 Geo Optics Inc
- 12.1.4.1. Company Overview
- 12.1.4.2. Products
- 12.1.4.3. Company Financials
- 12.1.4.4. SWOT Analysis
- 12.1.5 Inmarsat plc
- 12.1.5.1. Company Overview
- 12.1.5.2. Products
- 12.1.5.3. Company Financials
- 12.1.5.4. SWOT Analysis
- 12.1.6 PlanetIQ LLC
- 12.1.6.1. Company Overview
- 12.1.6.2. Products
- 12.1.6.3. Company Financials
- 12.1.6.4. SWOT Analysis
- 12.1.7 Aytheon Technologies Corporation7 2
- 12.1.7.1. Company Overview
- 12.1.7.2. Products
- 12.1.7.3. Company Financials
- 12.1.7.4. SWOT Analysis
- 12.1.8 Thales Group
- 12.1.8.1. Company Overview
- 12.1.8.2. Products
- 12.1.8.3. Company Financials
- 12.1.8.4. SWOT Analysis
- 12.1.9 Satcom Technologies
- 12.1.9.1. Company Overview
- 12.1.9.2. Products
- 12.1.9.3. Company Financials
- 12.1.9.4. SWOT Analysis
- 12.1.10 Planet Labs Inc
- 12.1.10.1. Company Overview
- 12.1.10.2. Products
- 12.1.10.3. Company Financials
- 12.1.10.4. SWOT Analysis
- 12.1.1 L3Harris Technologies Inc
- 12.2. Market Entropy
- 12.2.1 Company's Key Areas Served
- 12.2.2 Recent Developments
- 12.3. Company Market Share Analysis 2025
- 12.3.1 Top 5 Companies Market Share Analysis
- 12.3.2 Top 3 Companies Market Share Analysis
- 12.4. List of Potential Customers
- 13. Research Methodology
List of Figures
- Figure 1: Global US Satellite-based Earth Observation Market Revenue Breakdown (billion, %) by Region 2025 & 2033
- Figure 2: Global US Satellite-based Earth Observation Market Volume Breakdown (K Unit, %) by Region 2025 & 2033
- Figure 3: North America US Satellite-based Earth Observation Market Revenue (billion), by Type 2025 & 2033
- Figure 4: North America US Satellite-based Earth Observation Market Volume (K Unit), by Type 2025 & 2033
- Figure 5: North America US Satellite-based Earth Observation Market Revenue Share (%), by Type 2025 & 2033
- Figure 6: North America US Satellite-based Earth Observation Market Volume Share (%), by Type 2025 & 2033
- Figure 7: North America US Satellite-based Earth Observation Market Revenue (billion), by Satellite Orbit 2025 & 2033
- Figure 8: North America US Satellite-based Earth Observation Market Volume (K Unit), by Satellite Orbit 2025 & 2033
- Figure 9: North America US Satellite-based Earth Observation Market Revenue Share (%), by Satellite Orbit 2025 & 2033
- Figure 10: North America US Satellite-based Earth Observation Market Volume Share (%), by Satellite Orbit 2025 & 2033
- Figure 11: North America US Satellite-based Earth Observation Market Revenue (billion), by End-User 2025 & 2033
- Figure 12: North America US Satellite-based Earth Observation Market Volume (K Unit), by End-User 2025 & 2033
- Figure 13: North America US Satellite-based Earth Observation Market Revenue Share (%), by End-User 2025 & 2033
- Figure 14: North America US Satellite-based Earth Observation Market Volume Share (%), by End-User 2025 & 2033
- Figure 15: North America US Satellite-based Earth Observation Market Revenue (billion), by Country 2025 & 2033
- Figure 16: North America US Satellite-based Earth Observation Market Volume (K Unit), by Country 2025 & 2033
- Figure 17: North America US Satellite-based Earth Observation Market Revenue Share (%), by Country 2025 & 2033
- Figure 18: North America US Satellite-based Earth Observation Market Volume Share (%), by Country 2025 & 2033
- Figure 19: South America US Satellite-based Earth Observation Market Revenue (billion), by Type 2025 & 2033
- Figure 20: South America US Satellite-based Earth Observation Market Volume (K Unit), by Type 2025 & 2033
- Figure 21: South America US Satellite-based Earth Observation Market Revenue Share (%), by Type 2025 & 2033
- Figure 22: South America US Satellite-based Earth Observation Market Volume Share (%), by Type 2025 & 2033
- Figure 23: South America US Satellite-based Earth Observation Market Revenue (billion), by Satellite Orbit 2025 & 2033
- Figure 24: South America US Satellite-based Earth Observation Market Volume (K Unit), by Satellite Orbit 2025 & 2033
- Figure 25: South America US Satellite-based Earth Observation Market Revenue Share (%), by Satellite Orbit 2025 & 2033
- Figure 26: South America US Satellite-based Earth Observation Market Volume Share (%), by Satellite Orbit 2025 & 2033
- Figure 27: South America US Satellite-based Earth Observation Market Revenue (billion), by End-User 2025 & 2033
- Figure 28: South America US Satellite-based Earth Observation Market Volume (K Unit), by End-User 2025 & 2033
- Figure 29: South America US Satellite-based Earth Observation Market Revenue Share (%), by End-User 2025 & 2033
- Figure 30: South America US Satellite-based Earth Observation Market Volume Share (%), by End-User 2025 & 2033
- Figure 31: South America US Satellite-based Earth Observation Market Revenue (billion), by Country 2025 & 2033
- Figure 32: South America US Satellite-based Earth Observation Market Volume (K Unit), by Country 2025 & 2033
- Figure 33: South America US Satellite-based Earth Observation Market Revenue Share (%), by Country 2025 & 2033
- Figure 34: South America US Satellite-based Earth Observation Market Volume Share (%), by Country 2025 & 2033
- Figure 35: Europe US Satellite-based Earth Observation Market Revenue (billion), by Type 2025 & 2033
- Figure 36: Europe US Satellite-based Earth Observation Market Volume (K Unit), by Type 2025 & 2033
- Figure 37: Europe US Satellite-based Earth Observation Market Revenue Share (%), by Type 2025 & 2033
- Figure 38: Europe US Satellite-based Earth Observation Market Volume Share (%), by Type 2025 & 2033
- Figure 39: Europe US Satellite-based Earth Observation Market Revenue (billion), by Satellite Orbit 2025 & 2033
- Figure 40: Europe US Satellite-based Earth Observation Market Volume (K Unit), by Satellite Orbit 2025 & 2033
- Figure 41: Europe US Satellite-based Earth Observation Market Revenue Share (%), by Satellite Orbit 2025 & 2033
- Figure 42: Europe US Satellite-based Earth Observation Market Volume Share (%), by Satellite Orbit 2025 & 2033
- Figure 43: Europe US Satellite-based Earth Observation Market Revenue (billion), by End-User 2025 & 2033
- Figure 44: Europe US Satellite-based Earth Observation Market Volume (K Unit), by End-User 2025 & 2033
- Figure 45: Europe US Satellite-based Earth Observation Market Revenue Share (%), by End-User 2025 & 2033
- Figure 46: Europe US Satellite-based Earth Observation Market Volume Share (%), by End-User 2025 & 2033
- Figure 47: Europe US Satellite-based Earth Observation Market Revenue (billion), by Country 2025 & 2033
- Figure 48: Europe US Satellite-based Earth Observation Market Volume (K Unit), by Country 2025 & 2033
- Figure 49: Europe US Satellite-based Earth Observation Market Revenue Share (%), by Country 2025 & 2033
- Figure 50: Europe US Satellite-based Earth Observation Market Volume Share (%), by Country 2025 & 2033
- Figure 51: Middle East & Africa US Satellite-based Earth Observation Market Revenue (billion), by Type 2025 & 2033
- Figure 52: Middle East & Africa US Satellite-based Earth Observation Market Volume (K Unit), by Type 2025 & 2033
- Figure 53: Middle East & Africa US Satellite-based Earth Observation Market Revenue Share (%), by Type 2025 & 2033
- Figure 54: Middle East & Africa US Satellite-based Earth Observation Market Volume Share (%), by Type 2025 & 2033
- Figure 55: Middle East & Africa US Satellite-based Earth Observation Market Revenue (billion), by Satellite Orbit 2025 & 2033
- Figure 56: Middle East & Africa US Satellite-based Earth Observation Market Volume (K Unit), by Satellite Orbit 2025 & 2033
- Figure 57: Middle East & Africa US Satellite-based Earth Observation Market Revenue Share (%), by Satellite Orbit 2025 & 2033
- Figure 58: Middle East & Africa US Satellite-based Earth Observation Market Volume Share (%), by Satellite Orbit 2025 & 2033
- Figure 59: Middle East & Africa US Satellite-based Earth Observation Market Revenue (billion), by End-User 2025 & 2033
- Figure 60: Middle East & Africa US Satellite-based Earth Observation Market Volume (K Unit), by End-User 2025 & 2033
- Figure 61: Middle East & Africa US Satellite-based Earth Observation Market Revenue Share (%), by End-User 2025 & 2033
- Figure 62: Middle East & Africa US Satellite-based Earth Observation Market Volume Share (%), by End-User 2025 & 2033
- Figure 63: Middle East & Africa US Satellite-based Earth Observation Market Revenue (billion), by Country 2025 & 2033
- Figure 64: Middle East & Africa US Satellite-based Earth Observation Market Volume (K Unit), by Country 2025 & 2033
- Figure 65: Middle East & Africa US Satellite-based Earth Observation Market Revenue Share (%), by Country 2025 & 2033
- Figure 66: Middle East & Africa US Satellite-based Earth Observation Market Volume Share (%), by Country 2025 & 2033
- Figure 67: Asia Pacific US Satellite-based Earth Observation Market Revenue (billion), by Type 2025 & 2033
- Figure 68: Asia Pacific US Satellite-based Earth Observation Market Volume (K Unit), by Type 2025 & 2033
- Figure 69: Asia Pacific US Satellite-based Earth Observation Market Revenue Share (%), by Type 2025 & 2033
- Figure 70: Asia Pacific US Satellite-based Earth Observation Market Volume Share (%), by Type 2025 & 2033
- Figure 71: Asia Pacific US Satellite-based Earth Observation Market Revenue (billion), by Satellite Orbit 2025 & 2033
- Figure 72: Asia Pacific US Satellite-based Earth Observation Market Volume (K Unit), by Satellite Orbit 2025 & 2033
- Figure 73: Asia Pacific US Satellite-based Earth Observation Market Revenue Share (%), by Satellite Orbit 2025 & 2033
- Figure 74: Asia Pacific US Satellite-based Earth Observation Market Volume Share (%), by Satellite Orbit 2025 & 2033
- Figure 75: Asia Pacific US Satellite-based Earth Observation Market Revenue (billion), by End-User 2025 & 2033
- Figure 76: Asia Pacific US Satellite-based Earth Observation Market Volume (K Unit), by End-User 2025 & 2033
- Figure 77: Asia Pacific US Satellite-based Earth Observation Market Revenue Share (%), by End-User 2025 & 2033
- Figure 78: Asia Pacific US Satellite-based Earth Observation Market Volume Share (%), by End-User 2025 & 2033
- Figure 79: Asia Pacific US Satellite-based Earth Observation Market Revenue (billion), by Country 2025 & 2033
- Figure 80: Asia Pacific US Satellite-based Earth Observation Market Volume (K Unit), by Country 2025 & 2033
- Figure 81: Asia Pacific US Satellite-based Earth Observation Market Revenue Share (%), by Country 2025 & 2033
- Figure 82: Asia Pacific US Satellite-based Earth Observation Market Volume Share (%), by Country 2025 & 2033
List of Tables
- Table 1: Global US Satellite-based Earth Observation Market Revenue billion Forecast, by Type 2020 & 2033
- Table 2: Global US Satellite-based Earth Observation Market Volume K Unit Forecast, by Type 2020 & 2033
- Table 3: Global US Satellite-based Earth Observation Market Revenue billion Forecast, by Satellite Orbit 2020 & 2033
- Table 4: Global US Satellite-based Earth Observation Market Volume K Unit Forecast, by Satellite Orbit 2020 & 2033
- Table 5: Global US Satellite-based Earth Observation Market Revenue billion Forecast, by End-User 2020 & 2033
- Table 6: Global US Satellite-based Earth Observation Market Volume K Unit Forecast, by End-User 2020 & 2033
- Table 7: Global US Satellite-based Earth Observation Market Revenue billion Forecast, by Region 2020 & 2033
- Table 8: Global US Satellite-based Earth Observation Market Volume K Unit Forecast, by Region 2020 & 2033
- Table 9: Global US Satellite-based Earth Observation Market Revenue billion Forecast, by Type 2020 & 2033
- Table 10: Global US Satellite-based Earth Observation Market Volume K Unit Forecast, by Type 2020 & 2033
- Table 11: Global US Satellite-based Earth Observation Market Revenue billion Forecast, by Satellite Orbit 2020 & 2033
- Table 12: Global US Satellite-based Earth Observation Market Volume K Unit Forecast, by Satellite Orbit 2020 & 2033
- Table 13: Global US Satellite-based Earth Observation Market Revenue billion Forecast, by End-User 2020 & 2033
- Table 14: Global US Satellite-based Earth Observation Market Volume K Unit Forecast, by End-User 2020 & 2033
- Table 15: Global US Satellite-based Earth Observation Market Revenue billion Forecast, by Country 2020 & 2033
- Table 16: Global US Satellite-based Earth Observation Market Volume K Unit Forecast, by Country 2020 & 2033
- Table 17: United States US Satellite-based Earth Observation Market Revenue (billion) Forecast, by Application 2020 & 2033
- Table 18: United States US Satellite-based Earth Observation Market Volume (K Unit) Forecast, by Application 2020 & 2033
- Table 19: Canada US Satellite-based Earth Observation Market Revenue (billion) Forecast, by Application 2020 & 2033
- Table 20: Canada US Satellite-based Earth Observation Market Volume (K Unit) Forecast, by Application 2020 & 2033
- Table 21: Mexico US Satellite-based Earth Observation Market Revenue (billion) Forecast, by Application 2020 & 2033
- Table 22: Mexico US Satellite-based Earth Observation Market Volume (K Unit) Forecast, by Application 2020 & 2033
- Table 23: Global US Satellite-based Earth Observation Market Revenue billion Forecast, by Type 2020 & 2033
- Table 24: Global US Satellite-based Earth Observation Market Volume K Unit Forecast, by Type 2020 & 2033
- Table 25: Global US Satellite-based Earth Observation Market Revenue billion Forecast, by Satellite Orbit 2020 & 2033
- Table 26: Global US Satellite-based Earth Observation Market Volume K Unit Forecast, by Satellite Orbit 2020 & 2033
- Table 27: Global US Satellite-based Earth Observation Market Revenue billion Forecast, by End-User 2020 & 2033
- Table 28: Global US Satellite-based Earth Observation Market Volume K Unit Forecast, by End-User 2020 & 2033
- Table 29: Global US Satellite-based Earth Observation Market Revenue billion Forecast, by Country 2020 & 2033
- Table 30: Global US Satellite-based Earth Observation Market Volume K Unit Forecast, by Country 2020 & 2033
- Table 31: Brazil US Satellite-based Earth Observation Market Revenue (billion) Forecast, by Application 2020 & 2033
- Table 32: Brazil US Satellite-based Earth Observation Market Volume (K Unit) Forecast, by Application 2020 & 2033
- Table 33: Argentina US Satellite-based Earth Observation Market Revenue (billion) Forecast, by Application 2020 & 2033
- Table 34: Argentina US Satellite-based Earth Observation Market Volume (K Unit) Forecast, by Application 2020 & 2033
- Table 35: Rest of South America US Satellite-based Earth Observation Market Revenue (billion) Forecast, by Application 2020 & 2033
- Table 36: Rest of South America US Satellite-based Earth Observation Market Volume (K Unit) Forecast, by Application 2020 & 2033
- Table 37: Global US Satellite-based Earth Observation Market Revenue billion Forecast, by Type 2020 & 2033
- Table 38: Global US Satellite-based Earth Observation Market Volume K Unit Forecast, by Type 2020 & 2033
- Table 39: Global US Satellite-based Earth Observation Market Revenue billion Forecast, by Satellite Orbit 2020 & 2033
- Table 40: Global US Satellite-based Earth Observation Market Volume K Unit Forecast, by Satellite Orbit 2020 & 2033
- Table 41: Global US Satellite-based Earth Observation Market Revenue billion Forecast, by End-User 2020 & 2033
- Table 42: Global US Satellite-based Earth Observation Market Volume K Unit Forecast, by End-User 2020 & 2033
- Table 43: Global US Satellite-based Earth Observation Market Revenue billion Forecast, by Country 2020 & 2033
- Table 44: Global US Satellite-based Earth Observation Market Volume K Unit Forecast, by Country 2020 & 2033
- Table 45: United Kingdom US Satellite-based Earth Observation Market Revenue (billion) Forecast, by Application 2020 & 2033
- Table 46: United Kingdom US Satellite-based Earth Observation Market Volume (K Unit) Forecast, by Application 2020 & 2033
- Table 47: Germany US Satellite-based Earth Observation Market Revenue (billion) Forecast, by Application 2020 & 2033
- Table 48: Germany US Satellite-based Earth Observation Market Volume (K Unit) Forecast, by Application 2020 & 2033
- Table 49: France US Satellite-based Earth Observation Market Revenue (billion) Forecast, by Application 2020 & 2033
- Table 50: France US Satellite-based Earth Observation Market Volume (K Unit) Forecast, by Application 2020 & 2033
- Table 51: Italy US Satellite-based Earth Observation Market Revenue (billion) Forecast, by Application 2020 & 2033
- Table 52: Italy US Satellite-based Earth Observation Market Volume (K Unit) Forecast, by Application 2020 & 2033
- Table 53: Spain US Satellite-based Earth Observation Market Revenue (billion) Forecast, by Application 2020 & 2033
- Table 54: Spain US Satellite-based Earth Observation Market Volume (K Unit) Forecast, by Application 2020 & 2033
- Table 55: Russia US Satellite-based Earth Observation Market Revenue (billion) Forecast, by Application 2020 & 2033
- Table 56: Russia US Satellite-based Earth Observation Market Volume (K Unit) Forecast, by Application 2020 & 2033
- Table 57: Benelux US Satellite-based Earth Observation Market Revenue (billion) Forecast, by Application 2020 & 2033
- Table 58: Benelux US Satellite-based Earth Observation Market Volume (K Unit) Forecast, by Application 2020 & 2033
- Table 59: Nordics US Satellite-based Earth Observation Market Revenue (billion) Forecast, by Application 2020 & 2033
- Table 60: Nordics US Satellite-based Earth Observation Market Volume (K Unit) Forecast, by Application 2020 & 2033
- Table 61: Rest of Europe US Satellite-based Earth Observation Market Revenue (billion) Forecast, by Application 2020 & 2033
- Table 62: Rest of Europe US Satellite-based Earth Observation Market Volume (K Unit) Forecast, by Application 2020 & 2033
- Table 63: Global US Satellite-based Earth Observation Market Revenue billion Forecast, by Type 2020 & 2033
- Table 64: Global US Satellite-based Earth Observation Market Volume K Unit Forecast, by Type 2020 & 2033
- Table 65: Global US Satellite-based Earth Observation Market Revenue billion Forecast, by Satellite Orbit 2020 & 2033
- Table 66: Global US Satellite-based Earth Observation Market Volume K Unit Forecast, by Satellite Orbit 2020 & 2033
- Table 67: Global US Satellite-based Earth Observation Market Revenue billion Forecast, by End-User 2020 & 2033
- Table 68: Global US Satellite-based Earth Observation Market Volume K Unit Forecast, by End-User 2020 & 2033
- Table 69: Global US Satellite-based Earth Observation Market Revenue billion Forecast, by Country 2020 & 2033
- Table 70: Global US Satellite-based Earth Observation Market Volume K Unit Forecast, by Country 2020 & 2033
- Table 71: Turkey US Satellite-based Earth Observation Market Revenue (billion) Forecast, by Application 2020 & 2033
- Table 72: Turkey US Satellite-based Earth Observation Market Volume (K Unit) Forecast, by Application 2020 & 2033
- Table 73: Israel US Satellite-based Earth Observation Market Revenue (billion) Forecast, by Application 2020 & 2033
- Table 74: Israel US Satellite-based Earth Observation Market Volume (K Unit) Forecast, by Application 2020 & 2033
- Table 75: GCC US Satellite-based Earth Observation Market Revenue (billion) Forecast, by Application 2020 & 2033
- Table 76: GCC US Satellite-based Earth Observation Market Volume (K Unit) Forecast, by Application 2020 & 2033
- Table 77: North Africa US Satellite-based Earth Observation Market Revenue (billion) Forecast, by Application 2020 & 2033
- Table 78: North Africa US Satellite-based Earth Observation Market Volume (K Unit) Forecast, by Application 2020 & 2033
- Table 79: South Africa US Satellite-based Earth Observation Market Revenue (billion) Forecast, by Application 2020 & 2033
- Table 80: South Africa US Satellite-based Earth Observation Market Volume (K Unit) Forecast, by Application 2020 & 2033
- Table 81: Rest of Middle East & Africa US Satellite-based Earth Observation Market Revenue (billion) Forecast, by Application 2020 & 2033
- Table 82: Rest of Middle East & Africa US Satellite-based Earth Observation Market Volume (K Unit) Forecast, by Application 2020 & 2033
- Table 83: Global US Satellite-based Earth Observation Market Revenue billion Forecast, by Type 2020 & 2033
- Table 84: Global US Satellite-based Earth Observation Market Volume K Unit Forecast, by Type 2020 & 2033
- Table 85: Global US Satellite-based Earth Observation Market Revenue billion Forecast, by Satellite Orbit 2020 & 2033
- Table 86: Global US Satellite-based Earth Observation Market Volume K Unit Forecast, by Satellite Orbit 2020 & 2033
- Table 87: Global US Satellite-based Earth Observation Market Revenue billion Forecast, by End-User 2020 & 2033
- Table 88: Global US Satellite-based Earth Observation Market Volume K Unit Forecast, by End-User 2020 & 2033
- Table 89: Global US Satellite-based Earth Observation Market Revenue billion Forecast, by Country 2020 & 2033
- Table 90: Global US Satellite-based Earth Observation Market Volume K Unit Forecast, by Country 2020 & 2033
- Table 91: China US Satellite-based Earth Observation Market Revenue (billion) Forecast, by Application 2020 & 2033
- Table 92: China US Satellite-based Earth Observation Market Volume (K Unit) Forecast, by Application 2020 & 2033
- Table 93: India US Satellite-based Earth Observation Market Revenue (billion) Forecast, by Application 2020 & 2033
- Table 94: India US Satellite-based Earth Observation Market Volume (K Unit) Forecast, by Application 2020 & 2033
- Table 95: Japan US Satellite-based Earth Observation Market Revenue (billion) Forecast, by Application 2020 & 2033
- Table 96: Japan US Satellite-based Earth Observation Market Volume (K Unit) Forecast, by Application 2020 & 2033
- Table 97: South Korea US Satellite-based Earth Observation Market Revenue (billion) Forecast, by Application 2020 & 2033
- Table 98: South Korea US Satellite-based Earth Observation Market Volume (K Unit) Forecast, by Application 2020 & 2033
- Table 99: ASEAN US Satellite-based Earth Observation Market Revenue (billion) Forecast, by Application 2020 & 2033
- Table 100: ASEAN US Satellite-based Earth Observation Market Volume (K Unit) Forecast, by Application 2020 & 2033
- Table 101: Oceania US Satellite-based Earth Observation Market Revenue (billion) Forecast, by Application 2020 & 2033
- Table 102: Oceania US Satellite-based Earth Observation Market Volume (K Unit) Forecast, by Application 2020 & 2033
- Table 103: Rest of Asia Pacific US Satellite-based Earth Observation Market Revenue (billion) Forecast, by Application 2020 & 2033
- Table 104: Rest of Asia Pacific US Satellite-based Earth Observation Market Volume (K Unit) Forecast, by Application 2020 & 2033
Frequently Asked Questions
1. What is the projected Compound Annual Growth Rate (CAGR) of the US Satellite-based Earth Observation Market?
The projected CAGR is approximately 5.9%.
2. Which companies are prominent players in the US Satellite-based Earth Observation Market?
Key companies in the market include L3Harris Technologies Inc, MDA Corporation (Maxar Technologies), Airbus Defense and Space, Geo Optics Inc, Inmarsat plc, PlanetIQ LLC, Aytheon Technologies Corporation7 2 , Thales Group, Satcom Technologies, Planet Labs Inc.
3. What are the main segments of the US Satellite-based Earth Observation Market?
The market segments include Type, Satellite Orbit, End-User.
4. Can you provide details about the market size?
The market size is estimated to be USD 3.9 billion as of 2022.
5. What are some drivers contributing to market growth?
Use of Satellites for Advanced Environmental Monitoring; Technological Advancements in Satellite Development and Imagery.
6. What are the notable trends driving market growth?
Increasing Use of Satellites for Advanced Environmental Monitoring.
7. Are there any restraints impacting market growth?
Increasing Use of Alternative Earth Observation Technologies.
8. Can you provide examples of recent developments in the market?
April 2023: SpaceX launches the Intelsat 40e satellite as part of a NASA Earth-observation program. Intelsat 40e is a high-throughput geostationary satellite that will serve the company's government and corporate customers in North and Central America.
9. What pricing options are available for accessing the report?
Pricing options include single-user, multi-user, and enterprise licenses priced at USD 3800, USD 4500, and USD 5800 respectively.
10. Is the market size provided in terms of value or volume?
The market size is provided in terms of value, measured in billion and volume, measured in K Unit.
11. Are there any specific market keywords associated with the report?
Yes, the market keyword associated with the report is "US Satellite-based Earth Observation Market," which aids in identifying and referencing the specific market segment covered.
12. How do I determine which pricing option suits my needs best?
The pricing options vary based on user requirements and access needs. Individual users may opt for single-user licenses, while businesses requiring broader access may choose multi-user or enterprise licenses for cost-effective access to the report.
13. Are there any additional resources or data provided in the US Satellite-based Earth Observation Market report?
While the report offers comprehensive insights, it's advisable to review the specific contents or supplementary materials provided to ascertain if additional resources or data are available.
14. How can I stay updated on further developments or reports in the US Satellite-based Earth Observation Market?
To stay informed about further developments, trends, and reports in the US Satellite-based Earth Observation Market, consider subscribing to industry newsletters, following relevant companies and organizations, or regularly checking reputable industry news sources and publications.
Methodology
Step 1 - Identification of Relevant Samples Size from Population Database


Step 2 - Approaches for Defining Global Market Size (Value, Volume* & Price*)

Note*: In applicable scenarios
Step 3 - Data Sources
Primary Research
- Web Analytics
- Survey Reports
- Research Institute
- Latest Research Reports
- Opinion Leaders
Secondary Research
- Annual Reports
- White Paper
- Latest Press Release
- Industry Association
- Paid Database
- Investor Presentations

Step 4 - Data Triangulation
Involves using different sources of information in order to increase the validity of a study
These sources are likely to be stakeholders in a program - participants, other researchers, program staff, other community members, and so on.
Then we put all data in single framework & apply various statistical tools to find out the dynamic on the market.
During the analysis stage, feedback from the stakeholder groups would be compared to determine areas of agreement as well as areas of divergence