

Key Insights
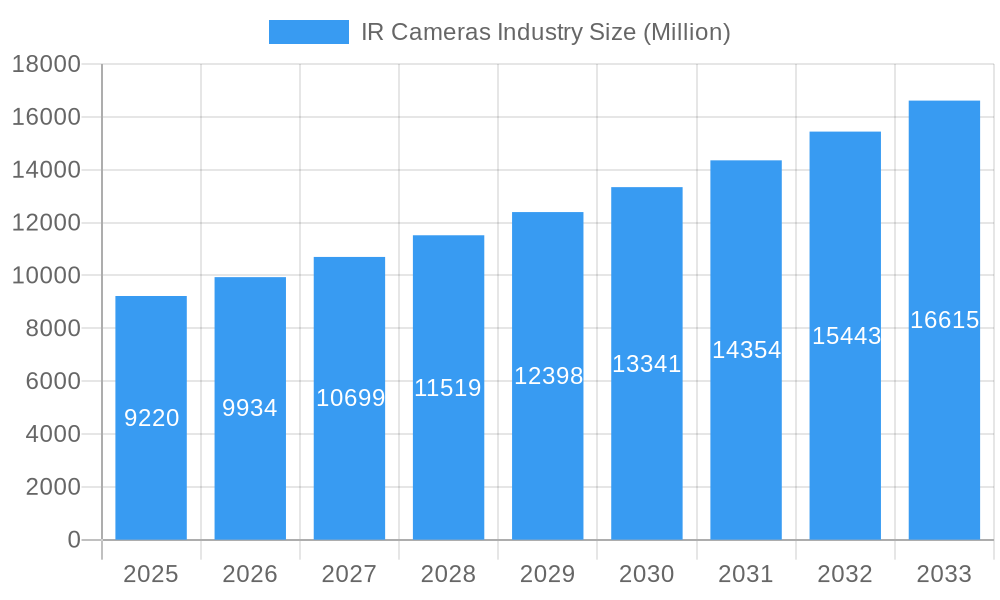
The global Infrared (IR) Camera market is poised for significant expansion, projected to reach an estimated market size of $9.22 billion in 2025, with a robust Compound Annual Growth Rate (CAGR) of 7.80% anticipated through 2033. This impressive growth is underpinned by a confluence of compelling drivers, including the escalating demand for advanced surveillance and security solutions across military, defense, and public safety sectors. The increasing integration of IR cameras in autonomous vehicles for enhanced perception and safety, coupled with their growing adoption in industrial applications for predictive maintenance, quality control, and process monitoring, are further fueling market momentum. Furthermore, the continuous innovation in detector technologies, leading to more sensitive, compact, and cost-effective IR cameras, alongside the expansion into new commercial and residential applications such as smart home security and building energy efficiency assessments, are critical growth catalysts.
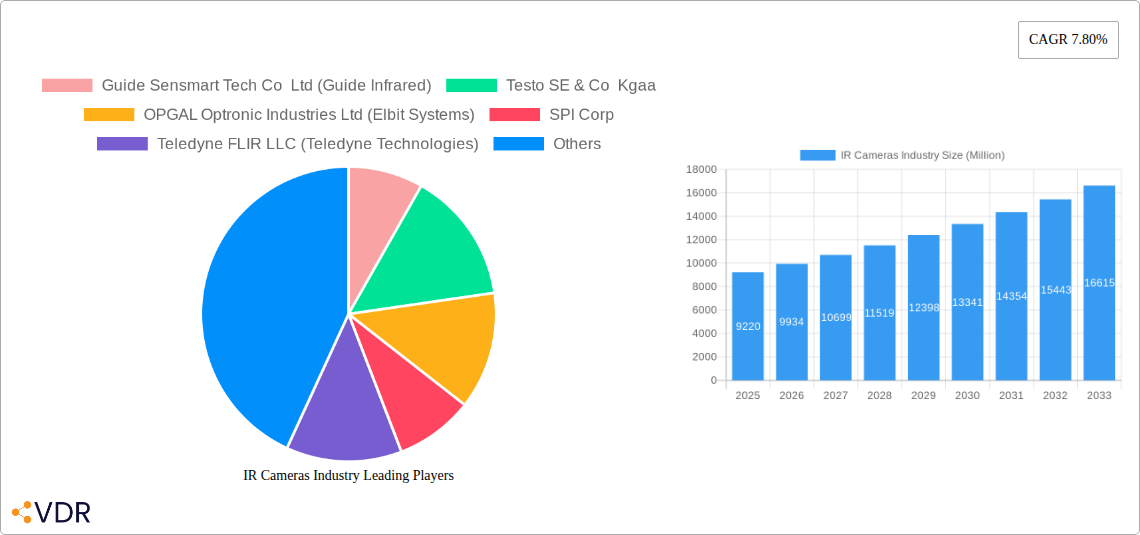
IR Cameras Industry Market Size (In Billion)
The market's trajectory is also shaped by evolving trends in miniaturization, higher resolution imaging, and the development of sophisticated AI-powered analytics for IR data interpretation. While the market enjoys strong demand, it faces certain restraints. High initial investment costs for advanced IR camera systems and the need for specialized expertise for operation and data analysis can pose barriers to adoption, particularly for small and medium-sized enterprises. However, the ongoing efforts by manufacturers to drive down costs and improve user-friendliness, alongside government initiatives promoting safety and security infrastructure, are expected to mitigate these challenges. Key segments like Uncooled detectors, Germanium and Silicon materials, and Near/Short-wavelength IR and Medium-wavelength IR types are expected to witness substantial growth, driven by their versatility and applicability across a wide array of end-user verticals.
IR Cameras Industry Company Market Share
Comprehensive IR Cameras Industry Market Research Report: Forecasts, Trends, and Regional Analysis (2019-2033)
This in-depth market research report offers a definitive analysis of the global IR Cameras Industry, providing critical insights into its structure, dynamics, and future trajectory. Covering the historical period from 2019 to 2024 and projecting growth through 2033 with a base year of 2025, this report is an essential resource for industry professionals, investors, and strategic planners. We delve into the parent and child market segments, meticulously analyzing factors influencing adoption, technological advancements, and competitive landscapes across various applications and end-user verticals. All values are presented in Million units.
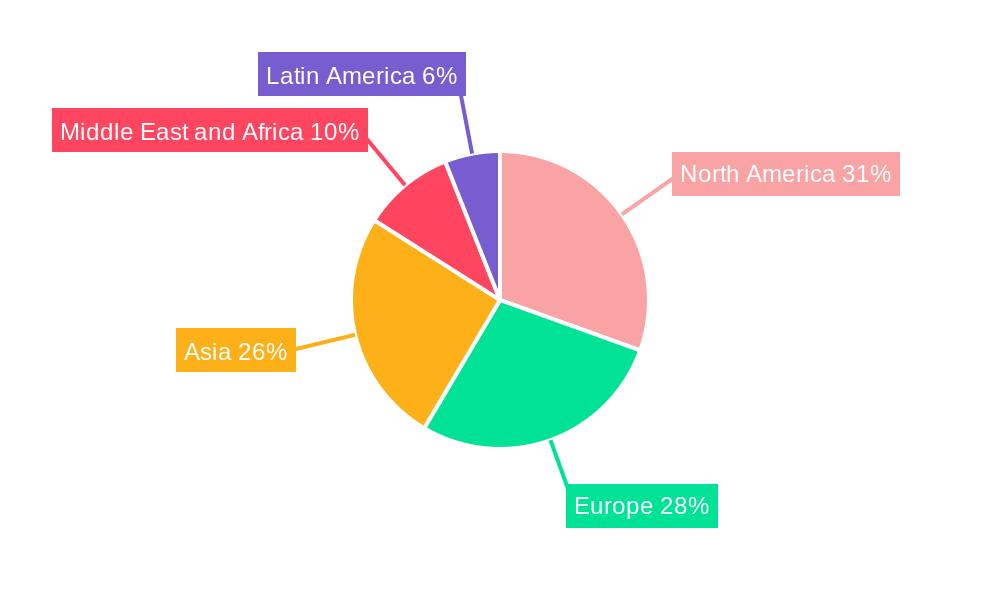
IR Cameras Industry Regional Market Share
IR Cameras Industry Market Dynamics & Structure
The IR Cameras Industry is characterized by a dynamic and evolving market structure, driven by continuous technological innovation and increasing demand across a multitude of applications. Market concentration varies significantly across different product segments, with some areas dominated by a few key players while others remain more fragmented. Technological innovation, particularly in detector technology (cooled vs. uncooled) and material science (Germanium, Silicon, Sapphire), acts as a primary driver, enabling enhanced performance, miniaturization, and cost reduction. Regulatory frameworks, while generally supportive of advancements in areas like safety and security, can also influence product development and market access. Competitive product substitutes, though limited in direct thermal imaging capabilities, exist in other sensing modalities, pushing IR camera manufacturers to constantly improve performance and value propositions. End-user demographics are expanding, with a growing adoption in consumer electronics and commercial applications alongside established military and industrial sectors. Mergers and acquisitions (M&A) trends are also shaping the landscape, with larger entities acquiring innovative startups to consolidate market share and expand technological portfolios. For instance, the market has witnessed numerous M&A deals, contributing to a consolidated market share of approximately 70% held by the top 5 players in recent years. Barriers to innovation include the high cost of research and development for advanced detector technologies and the stringent qualification processes for certain end-user verticals like aerospace.
IR Cameras Industry Growth Trends & Insights
The global IR Cameras Industry is poised for significant expansion, projected to witness a Compound Annual Growth Rate (CAGR) of XX% during the forecast period of 2025–2033. This robust growth is propelled by escalating adoption rates across key end-user verticals such as Military and Defense, Automotive, and Industrial sectors. Technological disruptions, including advancements in uncooled detector technology leading to more affordable and compact thermal cameras, are democratizing access to thermal imaging capabilities. Consumer behavior shifts are also contributing, with an increasing demand for thermal imaging in everyday applications like home inspections and personal safety. The market size is expected to grow from an estimated $XX,XXX Million in 2025 to over $XX,XXX Million by 2033. Market penetration is rapidly increasing, particularly in emerging economies due to enhanced awareness of the benefits of thermal imaging in predictive maintenance, security surveillance, and non-destructive testing. The development of AI-powered thermal analytics further enhances the value proposition, enabling automated anomaly detection and data interpretation, thus driving higher adoption rates.
Dominant Regions, Countries, or Segments in IR Cameras Industry
The Military and Defense end-user vertical stands as a dominant force driving growth within the global IR Cameras Industry. This segment consistently demands advanced thermal imaging solutions for surveillance, targeting, situational awareness, and night vision capabilities. Countries with significant defense spending, such as the United States, China, and European nations, represent major consumption hubs.
- Military and Defense:
- Key Drivers: National security concerns, ongoing geopolitical tensions, and the need for superior battlefield intelligence.
- Market Share: This vertical accounts for an estimated XX% of the total IR camera market revenue.
- Growth Potential: Continued investment in modernizing military equipment and developing advanced defense systems ensures sustained demand.
- Technological Advancements: Integration of SWaP (Size, Weight, and Power) optimized thermal cameras into soldier systems, drones, and vehicles.
Another significant driver of market growth is the Uncooled detector segment. The continuous improvements in performance, coupled with significant cost reductions compared to cooled detectors, have made uncooled thermal cameras accessible for a wider range of applications.
- Detector: Uncooled:
- Key Drivers: Cost-effectiveness, smaller form factors, and lower power consumption.
- Market Share: This segment is estimated to hold over XX% of the detector market.
- Growth Potential: Increasing adoption in industrial inspection, building diagnostics, automotive, and consumer electronics.
- Technological Advancements: Development of higher resolution and sensitivity uncooled sensors.
The Industrial end-user vertical also plays a crucial role, with thermal cameras being indispensable tools for predictive maintenance, process monitoring, and quality control.
- Industrial:
- Key Drivers: Minimizing downtime, preventing equipment failure, and ensuring operational efficiency.
- Market Share: This vertical represents approximately XX% of the market.
- Growth Potential: Growing adoption in sectors like energy, manufacturing, and petrochemicals.
The Near and Short-wavelength IR (NIR/SWIR) type is gaining traction due to its unique imaging capabilities, particularly in applications requiring the detection of specific materials or visible light in challenging conditions.
- Type: Near and Short-wavelength IR:
- Key Drivers: Applications in material sorting, quality inspection, and machine vision.
- Market Share: While a niche segment, it's experiencing rapid growth at XX% CAGR.
- Growth Potential: Expanding use in agriculture, pharmaceuticals, and food processing.
IR Cameras Industry Product Landscape
Product innovations in the IR Cameras Industry are consistently pushing the boundaries of performance and accessibility. Key advancements include the development of higher resolution uncooled detectors offering improved image detail, and the miniaturization of thermal camera modules for seamless integration into various devices. Enhanced processing algorithms are delivering superior image clarity, particularly in low-contrast environments, and enabling new functionalities like AI-driven object recognition and anomaly detection. Applications are diversifying rapidly, from traditional military and industrial uses to burgeoning sectors like automotive safety (driver assistance systems, pedestrian detection) and consumer electronics (smart home devices, wearables). Notable performance metrics include enhanced sensitivity (NETD values), wider dynamic range, and improved frame rates, all contributing to more effective and versatile thermal imaging solutions.
Key Drivers, Barriers & Challenges in IR Cameras Industry
Key Drivers:
- Technological Advancements: Continuous innovation in detector technology, miniaturization, and image processing capabilities.
- Expanding Applications: Growing demand across diverse sectors like automotive, healthcare, and smart homes.
- Enhanced Safety and Security: Increasing need for surveillance, threat detection, and predictive maintenance solutions.
- Cost Reductions: Improvements in manufacturing processes are making thermal cameras more affordable.
- Government Initiatives: Support for domestic manufacturing and R&D in critical technology sectors.
Barriers & Challenges:
- High R&D Costs: Significant investment required for developing cutting-edge detector technologies.
- Supply Chain Disruptions: Vulnerability to geopolitical events and material shortages.
- Stringent Regulations: Compliance with standards in specific industries like aerospace and medical.
- Skilled Workforce Shortage: Lack of specialized engineers and technicians for advanced thermal imaging.
- Market Education: Need for greater awareness of thermal imaging benefits in emerging applications.
Emerging Opportunities in IR Cameras Industry
Emerging opportunities in the IR Cameras Industry lie in the rapid growth of the Automotive sector for advanced driver-assistance systems (ADAS) and autonomous driving, where thermal cameras provide crucial all-weather visibility. The Residential market is also presenting a significant untapped potential for smart home applications, such as leak detection, energy efficiency monitoring, and enhanced security. Furthermore, the increasing integration of thermal imaging into consumer electronics, like smartphones and drones, for both professional and amateur use, represents a substantial growth avenue. The development of AI-powered analytics coupled with thermal imaging is creating opportunities for predictive maintenance in infrastructure and industrial settings, significantly reducing downtime and operational costs. The expansion of the Commercial and Public sector for security and inspection purposes also offers considerable growth prospects.
Growth Accelerators in the IR Cameras Industry Industry
Several catalysts are accelerating growth within the IR Cameras Industry. Breakthroughs in uncooled microbolometer technology are driving down costs and improving the performance of thermal sensors, making them more accessible for a wider range of applications. Strategic partnerships between established players and technology innovators are fostering the development of specialized solutions for niche markets, such as the integration of thermal cameras into medical devices for early disease detection. Market expansion strategies, particularly focusing on emerging economies where industrialization and infrastructure development are rapidly progressing, are opening up new revenue streams. The increasing adoption of the Internet of Things (IoT) is also acting as a growth accelerator, as thermal cameras are becoming integral components of smart systems for monitoring and control.
Key Players Shaping the IR Cameras Industry Market
- Guide Sensmart Tech Co Ltd (Guide Infrared)
- Testo SE & Co Kgaa
- OPGAL Optronic Industries Ltd (Elbit Systems)
- SPI Corp
- Teledyne FLIR LLC (Teledyne Technologies)
- Raytheon Company
- Seek Thermal Inc
- Leonardo DRS Inc
- InfraTec Gmb
- Fluke Corporation
- Hangzhou Hikvision Digital Technology Co Ltd
Notable Milestones in IR Cameras Industry Sector
- February 2024: Prama India's collaboration with the government of India's Centre for Development of Advanced Computing (C-DCAC) aims to support local production and innovation through a Transfer of Technology (TOT) agreement, focusing on thermal camera manufacturing, marketing, and support, advancing R&D for next-generation thermal cameras.
- January 2024: Teledyne FLIR, a subsidiary of Teledyne Technologies Incorporated, launched an upgraded version of its K-Series thermal imaging cameras (TICs) for firefighting and search and rescue (SAR) applications, offering improved image clarity and sharpness, especially in low-contrast situations, thereby enhancing operator safety and efficiency through advanced image processing.
In-Depth IR Cameras Industry Market Outlook
The In-Depth IR Cameras Industry Market Outlook reveals a promising future fueled by sustained innovation and expanding application horizons. Growth accelerators such as the continuous miniaturization and cost-effectiveness of uncooled detectors, coupled with advancements in artificial intelligence for data analysis, are paving the way for widespread adoption in previously untapped markets. Strategic alliances and increasing R&D investments by key players are set to introduce next-generation thermal imaging solutions with enhanced capabilities. The burgeoning demand from the automotive sector for ADAS and autonomous driving, alongside the growing adoption in residential applications for energy efficiency and security, represent significant future growth potential. Furthermore, government initiatives supporting domestic technology development and the increasing integration of thermal imaging into smart city infrastructure will further solidify the market's upward trajectory.
IR Cameras Industry Segmentation
-
1. Detector
- 1.1. Cooled
- 1.2. Uncooled
-
2. Material
- 2.1. Germanium
- 2.2. Silicon
- 2.3. Sapphire
- 2.4. Other Materials
-
3. Type
- 3.1. Near and Short-wavelength IR
- 3.2. Medium-wavelength IR
- 3.3. Long-wavelength IR
-
4. End-user Vertical
- 4.1. Military and Defense
- 4.2. Automotive
- 4.3. Industrial
- 4.4. Commercial and Public
- 4.5. Residential
- 4.6. Other End-user Vertical
IR Cameras Industry Segmentation By Geography
-
1. North America
- 1.1. United States
- 1.2. Canada
-
2. Europe
- 2.1. United Kingdom
- 2.2. Germany
- 2.3. France
-
3. Asia
- 3.1. China
- 3.2. India
- 3.3. Japan
- 3.4. Australia and New Zealand
- 4. Latin America
- 5. Middle East and Africa
IR Cameras Industry Regional Market Share
Geographic Coverage of IR Cameras Industry
IR Cameras Industry REPORT HIGHLIGHTS
| Aspects | Details |
|---|---|
| Study Period | 2020-2034 |
| Base Year | 2025 |
| Estimated Year | 2026 |
| Forecast Period | 2026-2034 |
| Historical Period | 2020-2025 |
| Growth Rate | CAGR of 7.80% from 2020-2034 |
| Segmentation |
|
Table of Contents
- 1. Introduction
- 1.1. Research Scope
- 1.2. Market Segmentation
- 1.3. Research Objective
- 1.4. Definitions and Assumptions
- 2. Executive Summary
- 2.1. Market Snapshot
- 3. Market Dynamics
- 3.1. Market Drivers
- 3.2. Market Restrains
- 3.3. Market Trends
- 3.4. Market Opportunities
- 4. Market Factor Analysis
- 4.1. Porters Five Forces
- 4.1.1. Bargaining Power of Suppliers
- 4.1.2. Bargaining Power of Buyers
- 4.1.3. Threat of New Entrants
- 4.1.4. Threat of Substitutes
- 4.1.5. Competitive Rivalry
- 4.2. PESTEL analysis
- 4.3. BCG Analysis
- 4.3.1. Stars (High Growth, High Market Share)
- 4.3.2. Cash Cows (Low Growth, High Market Share)
- 4.3.3. Question Mark (High Growth, Low Market Share)
- 4.3.4. Dogs (Low Growth, Low Market Share)
- 4.4. Ansoff Matrix Analysis
- 4.5. Supply Chain Analysis
- 4.6. Regulatory Landscape
- 4.7. Current Market Potential and Opportunity Assessment (TAM–SAM–SOM Framework)
- 4.8. VDR Analyst Note
- 4.1. Porters Five Forces
- 5. Market Analysis, Insights and Forecast 2021-2033
- 5.1. Market Analysis, Insights and Forecast - by Detector
- 5.1.1. Cooled
- 5.1.2. Uncooled
- 5.2. Market Analysis, Insights and Forecast - by Material
- 5.2.1. Germanium
- 5.2.2. Silicon
- 5.2.3. Sapphire
- 5.2.4. Other Materials
- 5.3. Market Analysis, Insights and Forecast - by Type
- 5.3.1. Near and Short-wavelength IR
- 5.3.2. Medium-wavelength IR
- 5.3.3. Long-wavelength IR
- 5.4. Market Analysis, Insights and Forecast - by End-user Vertical
- 5.4.1. Military and Defense
- 5.4.2. Automotive
- 5.4.3. Industrial
- 5.4.4. Commercial and Public
- 5.4.5. Residential
- 5.4.6. Other End-user Vertical
- 5.5. Market Analysis, Insights and Forecast - by Region
- 5.5.1. North America
- 5.5.2. Europe
- 5.5.3. Asia
- 5.5.4. Latin America
- 5.5.5. Middle East and Africa
- 5.1. Market Analysis, Insights and Forecast - by Detector
- 6. Global IR Cameras Industry Analysis, Insights and Forecast, 2021-2033
- 6.1. Market Analysis, Insights and Forecast - by Detector
- 6.1.1. Cooled
- 6.1.2. Uncooled
- 6.2. Market Analysis, Insights and Forecast - by Material
- 6.2.1. Germanium
- 6.2.2. Silicon
- 6.2.3. Sapphire
- 6.2.4. Other Materials
- 6.3. Market Analysis, Insights and Forecast - by Type
- 6.3.1. Near and Short-wavelength IR
- 6.3.2. Medium-wavelength IR
- 6.3.3. Long-wavelength IR
- 6.4. Market Analysis, Insights and Forecast - by End-user Vertical
- 6.4.1. Military and Defense
- 6.4.2. Automotive
- 6.4.3. Industrial
- 6.4.4. Commercial and Public
- 6.4.5. Residential
- 6.4.6. Other End-user Vertical
- 6.1. Market Analysis, Insights and Forecast - by Detector
- 7. North America IR Cameras Industry Analysis, Insights and Forecast, 2021-2033
- 7.1. Market Analysis, Insights and Forecast - by Detector
- 7.1.1. Cooled
- 7.1.2. Uncooled
- 7.2. Market Analysis, Insights and Forecast - by Material
- 7.2.1. Germanium
- 7.2.2. Silicon
- 7.2.3. Sapphire
- 7.2.4. Other Materials
- 7.3. Market Analysis, Insights and Forecast - by Type
- 7.3.1. Near and Short-wavelength IR
- 7.3.2. Medium-wavelength IR
- 7.3.3. Long-wavelength IR
- 7.4. Market Analysis, Insights and Forecast - by End-user Vertical
- 7.4.1. Military and Defense
- 7.4.2. Automotive
- 7.4.3. Industrial
- 7.4.4. Commercial and Public
- 7.4.5. Residential
- 7.4.6. Other End-user Vertical
- 7.1. Market Analysis, Insights and Forecast - by Detector
- 8. Europe IR Cameras Industry Analysis, Insights and Forecast, 2021-2033
- 8.1. Market Analysis, Insights and Forecast - by Detector
- 8.1.1. Cooled
- 8.1.2. Uncooled
- 8.2. Market Analysis, Insights and Forecast - by Material
- 8.2.1. Germanium
- 8.2.2. Silicon
- 8.2.3. Sapphire
- 8.2.4. Other Materials
- 8.3. Market Analysis, Insights and Forecast - by Type
- 8.3.1. Near and Short-wavelength IR
- 8.3.2. Medium-wavelength IR
- 8.3.3. Long-wavelength IR
- 8.4. Market Analysis, Insights and Forecast - by End-user Vertical
- 8.4.1. Military and Defense
- 8.4.2. Automotive
- 8.4.3. Industrial
- 8.4.4. Commercial and Public
- 8.4.5. Residential
- 8.4.6. Other End-user Vertical
- 8.1. Market Analysis, Insights and Forecast - by Detector
- 9. Asia IR Cameras Industry Analysis, Insights and Forecast, 2021-2033
- 9.1. Market Analysis, Insights and Forecast - by Detector
- 9.1.1. Cooled
- 9.1.2. Uncooled
- 9.2. Market Analysis, Insights and Forecast - by Material
- 9.2.1. Germanium
- 9.2.2. Silicon
- 9.2.3. Sapphire
- 9.2.4. Other Materials
- 9.3. Market Analysis, Insights and Forecast - by Type
- 9.3.1. Near and Short-wavelength IR
- 9.3.2. Medium-wavelength IR
- 9.3.3. Long-wavelength IR
- 9.4. Market Analysis, Insights and Forecast - by End-user Vertical
- 9.4.1. Military and Defense
- 9.4.2. Automotive
- 9.4.3. Industrial
- 9.4.4. Commercial and Public
- 9.4.5. Residential
- 9.4.6. Other End-user Vertical
- 9.1. Market Analysis, Insights and Forecast - by Detector
- 10. Latin America IR Cameras Industry Analysis, Insights and Forecast, 2021-2033
- 10.1. Market Analysis, Insights and Forecast - by Detector
- 10.1.1. Cooled
- 10.1.2. Uncooled
- 10.2. Market Analysis, Insights and Forecast - by Material
- 10.2.1. Germanium
- 10.2.2. Silicon
- 10.2.3. Sapphire
- 10.2.4. Other Materials
- 10.3. Market Analysis, Insights and Forecast - by Type
- 10.3.1. Near and Short-wavelength IR
- 10.3.2. Medium-wavelength IR
- 10.3.3. Long-wavelength IR
- 10.4. Market Analysis, Insights and Forecast - by End-user Vertical
- 10.4.1. Military and Defense
- 10.4.2. Automotive
- 10.4.3. Industrial
- 10.4.4. Commercial and Public
- 10.4.5. Residential
- 10.4.6. Other End-user Vertical
- 10.1. Market Analysis, Insights and Forecast - by Detector
- 11. Middle East and Africa IR Cameras Industry Analysis, Insights and Forecast, 2021-2033
- 11.1. Market Analysis, Insights and Forecast - by Detector
- 11.1.1. Cooled
- 11.1.2. Uncooled
- 11.2. Market Analysis, Insights and Forecast - by Material
- 11.2.1. Germanium
- 11.2.2. Silicon
- 11.2.3. Sapphire
- 11.2.4. Other Materials
- 11.3. Market Analysis, Insights and Forecast - by Type
- 11.3.1. Near and Short-wavelength IR
- 11.3.2. Medium-wavelength IR
- 11.3.3. Long-wavelength IR
- 11.4. Market Analysis, Insights and Forecast - by End-user Vertical
- 11.4.1. Military and Defense
- 11.4.2. Automotive
- 11.4.3. Industrial
- 11.4.4. Commercial and Public
- 11.4.5. Residential
- 11.4.6. Other End-user Vertical
- 11.1. Market Analysis, Insights and Forecast - by Detector
- 12. Competitive Analysis
- 12.1. Company Profiles
- 12.1.1 Guide Sensmart Tech Co Ltd (Guide Infrared)
- 12.1.1.1. Company Overview
- 12.1.1.2. Products
- 12.1.1.3. Company Financials
- 12.1.1.4. SWOT Analysis
- 12.1.2 Testo SE & Co Kgaa
- 12.1.2.1. Company Overview
- 12.1.2.2. Products
- 12.1.2.3. Company Financials
- 12.1.2.4. SWOT Analysis
- 12.1.3 OPGAL Optronic Industries Ltd (Elbit Systems)
- 12.1.3.1. Company Overview
- 12.1.3.2. Products
- 12.1.3.3. Company Financials
- 12.1.3.4. SWOT Analysis
- 12.1.4 SPI Corp
- 12.1.4.1. Company Overview
- 12.1.4.2. Products
- 12.1.4.3. Company Financials
- 12.1.4.4. SWOT Analysis
- 12.1.5 Teledyne FLIR LLC (Teledyne Technologies)
- 12.1.5.1. Company Overview
- 12.1.5.2. Products
- 12.1.5.3. Company Financials
- 12.1.5.4. SWOT Analysis
- 12.1.6 Raytheon Company
- 12.1.6.1. Company Overview
- 12.1.6.2. Products
- 12.1.6.3. Company Financials
- 12.1.6.4. SWOT Analysis
- 12.1.7 Seek Thermal Inc
- 12.1.7.1. Company Overview
- 12.1.7.2. Products
- 12.1.7.3. Company Financials
- 12.1.7.4. SWOT Analysis
- 12.1.8 Leonardo DRS Inc
- 12.1.8.1. Company Overview
- 12.1.8.2. Products
- 12.1.8.3. Company Financials
- 12.1.8.4. SWOT Analysis
- 12.1.9 InfraTec Gmb
- 12.1.9.1. Company Overview
- 12.1.9.2. Products
- 12.1.9.3. Company Financials
- 12.1.9.4. SWOT Analysis
- 12.1.10 Fluke Corporation
- 12.1.10.1. Company Overview
- 12.1.10.2. Products
- 12.1.10.3. Company Financials
- 12.1.10.4. SWOT Analysis
- 12.1.11 Hangzhou Hikvision Digital Technology Co Ltd
- 12.1.11.1. Company Overview
- 12.1.11.2. Products
- 12.1.11.3. Company Financials
- 12.1.11.4. SWOT Analysis
- 12.1.1 Guide Sensmart Tech Co Ltd (Guide Infrared)
- 12.2. Market Entropy
- 12.2.1 Company's Key Areas Served
- 12.2.2 Recent Developments
- 12.3. Company Market Share Analysis 2025
- 12.3.1 Top 5 Companies Market Share Analysis
- 12.3.2 Top 3 Companies Market Share Analysis
- 12.4. List of Potential Customers
- 13. Research Methodology
List of Figures
- Figure 1: Global IR Cameras Industry Revenue Breakdown (Million, %) by Region 2025 & 2033
- Figure 2: North America IR Cameras Industry Revenue (Million), by Detector 2025 & 2033
- Figure 3: North America IR Cameras Industry Revenue Share (%), by Detector 2025 & 2033
- Figure 4: North America IR Cameras Industry Revenue (Million), by Material 2025 & 2033
- Figure 5: North America IR Cameras Industry Revenue Share (%), by Material 2025 & 2033
- Figure 6: North America IR Cameras Industry Revenue (Million), by Type 2025 & 2033
- Figure 7: North America IR Cameras Industry Revenue Share (%), by Type 2025 & 2033
- Figure 8: North America IR Cameras Industry Revenue (Million), by End-user Vertical 2025 & 2033
- Figure 9: North America IR Cameras Industry Revenue Share (%), by End-user Vertical 2025 & 2033
- Figure 10: North America IR Cameras Industry Revenue (Million), by Country 2025 & 2033
- Figure 11: North America IR Cameras Industry Revenue Share (%), by Country 2025 & 2033
- Figure 12: Europe IR Cameras Industry Revenue (Million), by Detector 2025 & 2033
- Figure 13: Europe IR Cameras Industry Revenue Share (%), by Detector 2025 & 2033
- Figure 14: Europe IR Cameras Industry Revenue (Million), by Material 2025 & 2033
- Figure 15: Europe IR Cameras Industry Revenue Share (%), by Material 2025 & 2033
- Figure 16: Europe IR Cameras Industry Revenue (Million), by Type 2025 & 2033
- Figure 17: Europe IR Cameras Industry Revenue Share (%), by Type 2025 & 2033
- Figure 18: Europe IR Cameras Industry Revenue (Million), by End-user Vertical 2025 & 2033
- Figure 19: Europe IR Cameras Industry Revenue Share (%), by End-user Vertical 2025 & 2033
- Figure 20: Europe IR Cameras Industry Revenue (Million), by Country 2025 & 2033
- Figure 21: Europe IR Cameras Industry Revenue Share (%), by Country 2025 & 2033
- Figure 22: Asia IR Cameras Industry Revenue (Million), by Detector 2025 & 2033
- Figure 23: Asia IR Cameras Industry Revenue Share (%), by Detector 2025 & 2033
- Figure 24: Asia IR Cameras Industry Revenue (Million), by Material 2025 & 2033
- Figure 25: Asia IR Cameras Industry Revenue Share (%), by Material 2025 & 2033
- Figure 26: Asia IR Cameras Industry Revenue (Million), by Type 2025 & 2033
- Figure 27: Asia IR Cameras Industry Revenue Share (%), by Type 2025 & 2033
- Figure 28: Asia IR Cameras Industry Revenue (Million), by End-user Vertical 2025 & 2033
- Figure 29: Asia IR Cameras Industry Revenue Share (%), by End-user Vertical 2025 & 2033
- Figure 30: Asia IR Cameras Industry Revenue (Million), by Country 2025 & 2033
- Figure 31: Asia IR Cameras Industry Revenue Share (%), by Country 2025 & 2033
- Figure 32: Latin America IR Cameras Industry Revenue (Million), by Detector 2025 & 2033
- Figure 33: Latin America IR Cameras Industry Revenue Share (%), by Detector 2025 & 2033
- Figure 34: Latin America IR Cameras Industry Revenue (Million), by Material 2025 & 2033
- Figure 35: Latin America IR Cameras Industry Revenue Share (%), by Material 2025 & 2033
- Figure 36: Latin America IR Cameras Industry Revenue (Million), by Type 2025 & 2033
- Figure 37: Latin America IR Cameras Industry Revenue Share (%), by Type 2025 & 2033
- Figure 38: Latin America IR Cameras Industry Revenue (Million), by End-user Vertical 2025 & 2033
- Figure 39: Latin America IR Cameras Industry Revenue Share (%), by End-user Vertical 2025 & 2033
- Figure 40: Latin America IR Cameras Industry Revenue (Million), by Country 2025 & 2033
- Figure 41: Latin America IR Cameras Industry Revenue Share (%), by Country 2025 & 2033
- Figure 42: Middle East and Africa IR Cameras Industry Revenue (Million), by Detector 2025 & 2033
- Figure 43: Middle East and Africa IR Cameras Industry Revenue Share (%), by Detector 2025 & 2033
- Figure 44: Middle East and Africa IR Cameras Industry Revenue (Million), by Material 2025 & 2033
- Figure 45: Middle East and Africa IR Cameras Industry Revenue Share (%), by Material 2025 & 2033
- Figure 46: Middle East and Africa IR Cameras Industry Revenue (Million), by Type 2025 & 2033
- Figure 47: Middle East and Africa IR Cameras Industry Revenue Share (%), by Type 2025 & 2033
- Figure 48: Middle East and Africa IR Cameras Industry Revenue (Million), by End-user Vertical 2025 & 2033
- Figure 49: Middle East and Africa IR Cameras Industry Revenue Share (%), by End-user Vertical 2025 & 2033
- Figure 50: Middle East and Africa IR Cameras Industry Revenue (Million), by Country 2025 & 2033
- Figure 51: Middle East and Africa IR Cameras Industry Revenue Share (%), by Country 2025 & 2033
List of Tables
- Table 1: Global IR Cameras Industry Revenue Million Forecast, by Detector 2020 & 2033
- Table 2: Global IR Cameras Industry Revenue Million Forecast, by Material 2020 & 2033
- Table 3: Global IR Cameras Industry Revenue Million Forecast, by Type 2020 & 2033
- Table 4: Global IR Cameras Industry Revenue Million Forecast, by End-user Vertical 2020 & 2033
- Table 5: Global IR Cameras Industry Revenue Million Forecast, by Region 2020 & 2033
- Table 6: Global IR Cameras Industry Revenue Million Forecast, by Detector 2020 & 2033
- Table 7: Global IR Cameras Industry Revenue Million Forecast, by Material 2020 & 2033
- Table 8: Global IR Cameras Industry Revenue Million Forecast, by Type 2020 & 2033
- Table 9: Global IR Cameras Industry Revenue Million Forecast, by End-user Vertical 2020 & 2033
- Table 10: Global IR Cameras Industry Revenue Million Forecast, by Country 2020 & 2033
- Table 11: United States IR Cameras Industry Revenue (Million) Forecast, by Application 2020 & 2033
- Table 12: Canada IR Cameras Industry Revenue (Million) Forecast, by Application 2020 & 2033
- Table 13: Global IR Cameras Industry Revenue Million Forecast, by Detector 2020 & 2033
- Table 14: Global IR Cameras Industry Revenue Million Forecast, by Material 2020 & 2033
- Table 15: Global IR Cameras Industry Revenue Million Forecast, by Type 2020 & 2033
- Table 16: Global IR Cameras Industry Revenue Million Forecast, by End-user Vertical 2020 & 2033
- Table 17: Global IR Cameras Industry Revenue Million Forecast, by Country 2020 & 2033
- Table 18: United Kingdom IR Cameras Industry Revenue (Million) Forecast, by Application 2020 & 2033
- Table 19: Germany IR Cameras Industry Revenue (Million) Forecast, by Application 2020 & 2033
- Table 20: France IR Cameras Industry Revenue (Million) Forecast, by Application 2020 & 2033
- Table 21: Global IR Cameras Industry Revenue Million Forecast, by Detector 2020 & 2033
- Table 22: Global IR Cameras Industry Revenue Million Forecast, by Material 2020 & 2033
- Table 23: Global IR Cameras Industry Revenue Million Forecast, by Type 2020 & 2033
- Table 24: Global IR Cameras Industry Revenue Million Forecast, by End-user Vertical 2020 & 2033
- Table 25: Global IR Cameras Industry Revenue Million Forecast, by Country 2020 & 2033
- Table 26: China IR Cameras Industry Revenue (Million) Forecast, by Application 2020 & 2033
- Table 27: India IR Cameras Industry Revenue (Million) Forecast, by Application 2020 & 2033
- Table 28: Japan IR Cameras Industry Revenue (Million) Forecast, by Application 2020 & 2033
- Table 29: Australia and New Zealand IR Cameras Industry Revenue (Million) Forecast, by Application 2020 & 2033
- Table 30: Global IR Cameras Industry Revenue Million Forecast, by Detector 2020 & 2033
- Table 31: Global IR Cameras Industry Revenue Million Forecast, by Material 2020 & 2033
- Table 32: Global IR Cameras Industry Revenue Million Forecast, by Type 2020 & 2033
- Table 33: Global IR Cameras Industry Revenue Million Forecast, by End-user Vertical 2020 & 2033
- Table 34: Global IR Cameras Industry Revenue Million Forecast, by Country 2020 & 2033
- Table 35: Global IR Cameras Industry Revenue Million Forecast, by Detector 2020 & 2033
- Table 36: Global IR Cameras Industry Revenue Million Forecast, by Material 2020 & 2033
- Table 37: Global IR Cameras Industry Revenue Million Forecast, by Type 2020 & 2033
- Table 38: Global IR Cameras Industry Revenue Million Forecast, by End-user Vertical 2020 & 2033
- Table 39: Global IR Cameras Industry Revenue Million Forecast, by Country 2020 & 2033
Frequently Asked Questions
1. What is the projected Compound Annual Growth Rate (CAGR) of the IR Cameras Industry?
The projected CAGR is approximately 7.80%.
2. Which companies are prominent players in the IR Cameras Industry?
Key companies in the market include Guide Sensmart Tech Co Ltd (Guide Infrared), Testo SE & Co Kgaa, OPGAL Optronic Industries Ltd (Elbit Systems), SPI Corp, Teledyne FLIR LLC (Teledyne Technologies), Raytheon Company, Seek Thermal Inc, Leonardo DRS Inc, InfraTec Gmb, Fluke Corporation, Hangzhou Hikvision Digital Technology Co Ltd.
3. What are the main segments of the IR Cameras Industry?
The market segments include Detector, Material, Type, End-user Vertical.
4. Can you provide details about the market size?
The market size is estimated to be USD 9.22 Million as of 2022.
5. What are some drivers contributing to market growth?
Rising Demand for Surveillance Across Various Verticals; Gradually Decreasing Costs of Thermal Cameras.
6. What are the notable trends driving market growth?
Automotive Industry to be the Fastest Growing End User.
7. Are there any restraints impacting market growth?
High Costs And Limited Commercialization.
8. Can you provide examples of recent developments in the market?
February 2024 - Prama India's collaboration with the government of India's Centre for Development of Advanced Computing (C-DCAC) aims to support local production and innovation. The collaboration is being carried out through a Transfer of technology (TOT) agreement and will focus on thermal camera manufacturing, marketing, and support. Prama India's collaboration with C-DCAC is a step forward in R&D activities using technology to develop next-generation thermal cameras.
9. What pricing options are available for accessing the report?
Pricing options include single-user, multi-user, and enterprise licenses priced at USD 4750, USD 5250, and USD 8750 respectively.
10. Is the market size provided in terms of value or volume?
The market size is provided in terms of value, measured in Million.
11. Are there any specific market keywords associated with the report?
Yes, the market keyword associated with the report is "IR Cameras Industry," which aids in identifying and referencing the specific market segment covered.
12. How do I determine which pricing option suits my needs best?
The pricing options vary based on user requirements and access needs. Individual users may opt for single-user licenses, while businesses requiring broader access may choose multi-user or enterprise licenses for cost-effective access to the report.
13. Are there any additional resources or data provided in the IR Cameras Industry report?
While the report offers comprehensive insights, it's advisable to review the specific contents or supplementary materials provided to ascertain if additional resources or data are available.
14. How can I stay updated on further developments or reports in the IR Cameras Industry?
To stay informed about further developments, trends, and reports in the IR Cameras Industry, consider subscribing to industry newsletters, following relevant companies and organizations, or regularly checking reputable industry news sources and publications.
Methodology
Step 1 - Identification of Relevant Samples Size from Population Database


Step 2 - Approaches for Defining Global Market Size (Value, Volume* & Price*)

Note*: In applicable scenarios
Step 3 - Data Sources
Primary Research
- Web Analytics
- Survey Reports
- Research Institute
- Latest Research Reports
- Opinion Leaders
Secondary Research
- Annual Reports
- White Paper
- Latest Press Release
- Industry Association
- Paid Database
- Investor Presentations

Step 4 - Data Triangulation
Involves using different sources of information in order to increase the validity of a study
These sources are likely to be stakeholders in a program - participants, other researchers, program staff, other community members, and so on.
Then we put all data in single framework & apply various statistical tools to find out the dynamic on the market.
During the analysis stage, feedback from the stakeholder groups would be compared to determine areas of agreement as well as areas of divergence