

Key Insights
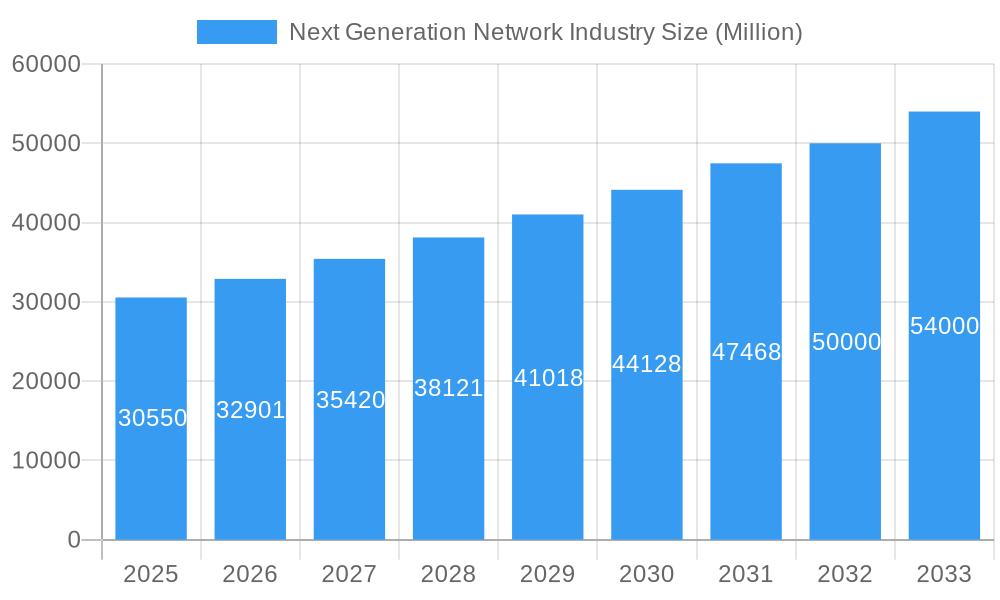
The Next Generation Network (NGN) industry is poised for significant expansion, currently valued at approximately $30.55 billion in 2025 and projected to grow at a robust Compound Annual Growth Rate (CAGR) of 7.70% through 2033. This substantial growth is fueled by the ever-increasing demand for faster, more reliable, and efficient communication infrastructure. Key drivers include the widespread adoption of 5G technology, the burgeoning Internet of Things (IoT) ecosystem, and the increasing reliance on cloud computing services. These forces collectively necessitate advanced networking capabilities that traditional networks struggle to provide. The evolution towards software-defined networking (SDN) and network function virtualization (NFV) is also a critical trend, offering greater flexibility, scalability, and cost-effectiveness in network management. Furthermore, the escalating need for enhanced bandwidth to support high-definition video streaming, augmented reality (AR), virtual reality (VR), and data-intensive applications is pushing the boundaries of current network capabilities.
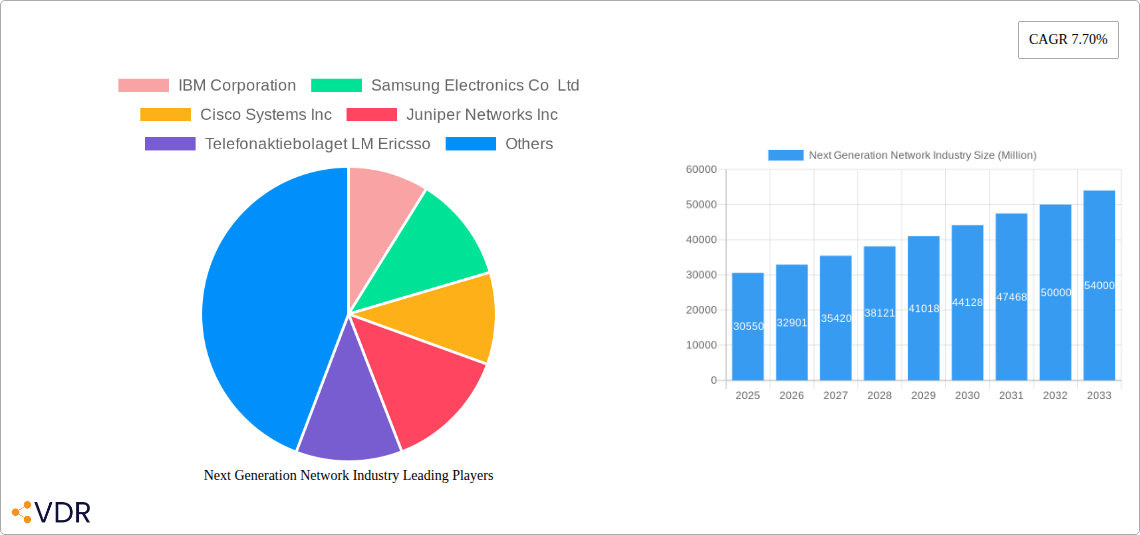
Next Generation Network Industry Market Size (In Billion)
The NGN market is segmented across various offerings, including hardware, software, and services, reflecting the multifaceted nature of network development and deployment. The primary end-users are Telecom and Internet Service Providers, who are at the forefront of building and upgrading these advanced networks. Government initiatives aimed at digital transformation and improving national connectivity also contribute significantly to market expansion. The competitive landscape is dominated by established players such as IBM Corporation, Samsung Electronics Co Ltd, Cisco Systems Inc, Juniper Networks Inc, and Huawei Technologies Co Ltd, all actively investing in research and development to capture market share. Challenges, or restraints, may arise from the high capital expenditure required for network upgrades, the complexity of integrating new technologies with legacy systems, and evolving cybersecurity threats that demand constant vigilance and advanced solutions.
Next Generation Network Industry Company Market Share
Next Generation Network Industry Report: Revolutionizing Connectivity for the Future
This comprehensive report offers an in-depth analysis of the Next Generation Network (NGN) industry, meticulously exploring market dynamics, growth trajectories, and the competitive landscape from 2019 to 2033. With a base year of 2025, this study provides critical insights into the evolving world of advanced connectivity, crucial for Telecom and Internet Service Providers, Governments, and Other End-users. Harnessing high-traffic keywords like "5G," "6G," "fiber optics," "SDN," "NFV," "cloud networking," and "IoT connectivity," this report is optimized for maximum search engine visibility and engagement among industry professionals. We delve into parent and child markets, offering a holistic view of this transformative sector. All values are presented in Million units.
Next Generation Network Industry Market Dynamics & Structure
The Next Generation Network industry is characterized by a dynamic and evolving market structure, driven by relentless technological innovation and increasing global demand for enhanced connectivity. Market concentration is moderate, with key players continuously vying for dominance through strategic investments and product development. Technological innovation stands as the primary driver, with advancements in 5G, 6G, fiber optics, and software-defined networking (SDN) reshaping infrastructure capabilities. Regulatory frameworks, while sometimes creating barriers, are also evolving to support NGN deployment, encouraging competition and investment. Competitive product substitutes are emerging rapidly, particularly in specialized areas like private networks and edge computing solutions, forcing established players to innovate continuously. End-user demographics are diversifying, with a growing demand from enterprise clients and the burgeoning Internet of Things (IoT) ecosystem. Mergers and Acquisitions (M&A) remain a significant trend, with companies consolidating to acquire new technologies, expand market reach, and gain a competitive edge.
- Market Concentration: Moderate, with increasing consolidation around key technology providers and network operators.
- Technological Innovation Drivers: Advancements in 5G/6G, AI-powered network management, edge computing, and quantum networking.
- Regulatory Frameworks: Evolving policies promoting spectrum allocation, net neutrality, and data privacy, influencing deployment strategies.
- Competitive Product Substitutes: Emergence of private 5G networks, specialized IoT connectivity platforms, and satellite broadband solutions.
- End-User Demographics: Broadening appeal across telecom, government, enterprise (manufacturing, healthcare, logistics), and residential sectors.
- M&A Trends: Active consolidation for technology acquisition, market expansion, and strengthening competitive positions.
Next Generation Network Industry Growth Trends & Insights
The Next Generation Network industry is poised for significant expansion, driven by an insatiable global appetite for faster, more reliable, and ubiquitous connectivity. The market size is projected to witness a robust Compound Annual Growth Rate (CAGR) during the forecast period, fueled by the ongoing deployment of advanced wireless technologies and the increasing adoption of cloud-native network functions. Technological disruptions, such as the maturation of 5G and the early stages of 6G development, are fundamentally altering network architectures and enabling new use cases. Consumer behavior is shifting towards a demand for seamless, high-bandwidth experiences, including augmented reality (AR), virtual reality (VR), and immersive gaming, all of which are heavily reliant on NGN capabilities. The expansion of the Internet of Things (IoT) ecosystem, encompassing billions of connected devices across various industries, further propels market growth as these devices require robust and scalable network infrastructure. The ongoing digital transformation across all sectors necessitates advanced networking solutions for efficient data processing, real-time analytics, and enhanced operational efficiency.
The report will leverage extensive market data and forecasts to detail the evolution of market size, from an estimated $350,000 Million in 2025 to an anticipated $680,000 Million by 2033. Adoption rates for key NGN technologies are expected to accelerate, particularly within enterprise segments seeking to leverage AI, machine learning, and edge computing for competitive advantage. Market penetration for advanced Wi-Fi standards, like Wi-Fi 7, is also anticipated to surge, as demonstrated by collaborations like Charter Communications Inc. and Qualcomm Technologies Inc., aiming to deliver multi-gigabit wireless connectivity. Furthermore, the increasing integration of Artificial Intelligence (AI) and Machine Learning (ML) into network management systems will optimize performance, enhance security, and reduce operational costs, making NGN solutions more attractive. The growing demand for low-latency communication is a critical factor, supporting the development of real-time applications in autonomous systems, remote surgery, and industrial automation. The shift towards open and disaggregated network architectures, driven by initiatives like Open RAN, is fostering greater vendor diversity and cost efficiencies, further stimulating market adoption. Investments in fiber-to-the-home (FTTH) infrastructure will continue to be a cornerstone of NGN expansion, providing the high-speed backbone necessary for future services.
Dominant Regions, Countries, or Segments in Next Generation Network Industry
North America currently stands as a dominant region in the Next Generation Network industry, driven by substantial investments in 5G infrastructure, extensive fiber optic deployments, and a strong ecosystem of technology innovators. The United States, in particular, leads the charge with significant network upgrades by major telecom operators and government initiatives supporting broadband expansion. The Telecom and Internet Service Providers segment is the primary driver of market growth, accounting for the largest share of NGN deployments and revenue. These providers are at the forefront of upgrading their infrastructure to support higher bandwidth, lower latency, and greater capacity demanded by evolving consumer and enterprise needs.
- Key Drivers in North America:
- Aggressive 5G spectrum auctions and deployment strategies.
- High consumer and enterprise demand for high-speed internet.
- Significant investments in fiber optic backhaul and last-mile connectivity.
- Government programs aimed at bridging the digital divide and expanding broadband access.
- Presence of leading technology companies and research institutions fostering innovation.
The Software segment within the NGN industry is experiencing exponential growth, projected to capture a significant market share due to the increasing reliance on Network Function Virtualization (NFV) and Software-Defined Networking (SDN). These technologies enable greater flexibility, scalability, and cost-efficiency in network operations. The development of advanced software frameworks, such as Schneider Electric's Distributed Control Node (DCN) software, highlights the trend towards software-defined, plug-and-produce solutions, enhancing operational efficiency for industrial companies.
- Key Drivers for Software Segment Dominance:
- Demand for flexible and scalable network management solutions.
- Growth of cloud-native network functions and edge computing.
- Automation of network operations through AI and machine learning.
- Enablement of new services and applications requiring dynamic network configurations.
- Cost reduction benefits associated with virtualized network functions.
Next Generation Network Industry Product Landscape
The Next Generation Network industry is defined by a continuous stream of groundbreaking product innovations. Key advancements include the development of Wi-Fi 7 routers capable of delivering 10 Gbps speeds, as seen in the collaboration between Charter Communications Inc. and Qualcomm Technologies Inc., enhancing converged connectivity for residential and business users. Furthermore, the evolution of 5G Advanced and early 6G research promises even higher data rates, ultra-low latency, and expanded capacity for immersive experiences like VR and AR. The integration of AI and machine learning into network devices and management platforms is a critical innovation, enabling intelligent automation, predictive maintenance, and optimized resource allocation. Open and disaggregated network hardware and software, such as the Distributed Control Node (DCN) software framework, are fostering greater interoperability and enabling more adaptable and cost-effective network deployments.
Key Drivers, Barriers & Challenges in Next Generation Network Industry
The Next Generation Network industry is propelled by several key drivers, including the ever-increasing demand for high-speed data and low-latency communication, the proliferation of connected devices fueling the IoT revolution, and the ongoing digital transformation across all sectors. Technological advancements in 5G, 6G, fiber optics, and AI are crucial enablers, while government initiatives and investments in digital infrastructure play a vital role in market expansion.
- Key Drivers:
- Surging demand for bandwidth and reduced latency.
- Explosive growth of IoT devices.
- Digital transformation and industry automation.
- Advancements in 5G/6G, AI, and edge computing.
- Government support for digital infrastructure development.
However, the industry faces significant challenges and barriers. High upfront investment costs for deploying new network infrastructure, complex regulatory environments, and spectrum availability can hinder rapid deployment. Security concerns and the risk of cyberattacks on increasingly complex networks are paramount. Furthermore, the shortage of skilled professionals in networking and cybersecurity can impede adoption and operational efficiency.
- Key Barriers & Challenges:
- Substantial capital expenditure for infrastructure upgrades.
- Navigating intricate regulatory landscapes and obtaining necessary permits.
- Ensuring robust cybersecurity and data privacy.
- Addressing the global shortage of skilled network engineers and cybersecurity experts.
- Interoperability issues between different vendors and technologies.
Emerging Opportunities in Next Generation Network Industry
Emerging opportunities in the Next Generation Network industry are vast and multifaceted. The expansion of private 5G networks for enterprises, offering dedicated and secure connectivity for industrial automation, smart manufacturing, and logistics, presents a significant growth avenue. The burgeoning field of the metaverse and immersive technologies will require ultra-low latency and high-bandwidth NGN capabilities, creating new demand for advanced network solutions. Furthermore, the increasing focus on edge computing for real-time data processing and AI inference closer to the data source opens up opportunities for specialized NGN hardware and software solutions. The development of sustainable and energy-efficient network technologies is also gaining traction, offering opportunities for eco-conscious solutions.
Growth Accelerators in the Next Generation Network Industry Industry
Several catalysts are accelerating the growth of the Next Generation Network industry. Technological breakthroughs in areas like AI-driven network optimization, quantum communication, and advanced wireless spectrum utilization are continuously pushing the boundaries of what's possible. Strategic partnerships and collaborations between technology providers, network operators, and application developers are crucial for co-creating innovative solutions and expanding market reach. The increasing adoption of open and disaggregated architectures, fostering greater interoperability and reducing vendor lock-in, is also a significant growth accelerator. Furthermore, expanding into emerging markets with growing demand for digital services and infrastructure will unlock substantial growth potential.
Key Players Shaping the Next Generation Network Industry Market
- IBM Corporation
- Samsung Electronics Co Ltd
- Cisco Systems Inc
- Juniper Networks Inc
- Telefonaktiebolaget LM Ericsso
- NEC Corporation
- Huawei Technologies Co Ltd
- ZTE Corporation
- Nokia Corporation
- Ciena Corporation
Notable Milestones in Next Generation Network Industry Sector
- February 2024: Schneider Electric, in collaboration with Intel and Red Hat, released a Distributed Control Node (DCN) software framework. This expansion of Schneider Electric's EcoStruxure Automation Expert enables industrial companies to adopt software-defined, plug-and-produce solutions, enhancing operations and optimizing costs.
- September 2023: Charter Communications Inc. partnered with Qualcomm Technologies Inc. to introduce advanced Wi-Fi 7 routers, delivering 10 Gbps Wi-Fi capabilities to Spectrum Internet users. This collaboration aims to enhance converged connectivity for residential and small to medium-sized businesses, supporting immersive VR experiences and multi-gig wireless connectivity.
In-Depth Next Generation Network Industry Market Outlook
The Next Generation Network industry presents a promising outlook, driven by the relentless pursuit of enhanced digital connectivity. The integration of AI and machine learning into network management systems will lead to unprecedented levels of automation and efficiency. The expansion of edge computing will enable real-time data processing and low-latency applications, critical for autonomous systems and the metaverse. Strategic investments in advanced wireless technologies, particularly the transition towards 6G, alongside continued fiber optic infrastructure build-out, will form the backbone of this evolution. Emerging markets represent a significant frontier for growth, as developing economies increasingly prioritize digital infrastructure to foster economic development and inclusivity. The industry is poised for substantial growth, offering lucrative opportunities for stakeholders investing in innovation and strategic market expansion.
Next Generation Network Industry Segmentation
-
1. Offering
- 1.1. Hardware
- 1.2. Software
- 1.3. Services
-
2. End User
- 2.1. Telecom and Internet Service Providers
- 2.2. Government
- 2.3. Other End-users
Next Generation Network Industry Segmentation By Geography
- 1. North America
- 2. Europe
- 3. Asia Pacific
- 4. Latin America
- 5. Middle East and Africa
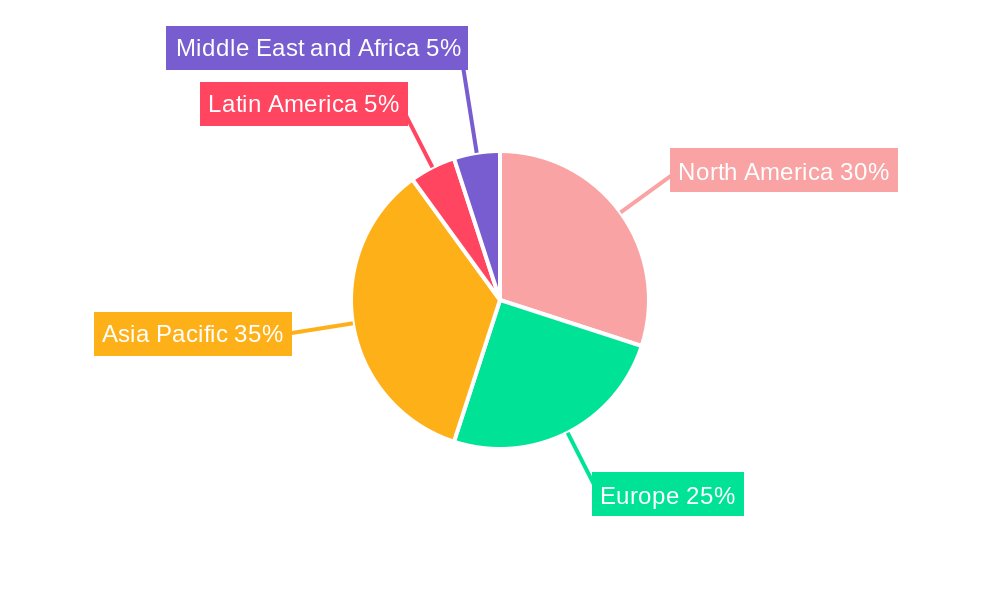
Next Generation Network Industry Regional Market Share
Geographic Coverage of Next Generation Network Industry
Next Generation Network Industry REPORT HIGHLIGHTS
| Aspects | Details |
|---|---|
| Study Period | 2020-2034 |
| Base Year | 2025 |
| Estimated Year | 2026 |
| Forecast Period | 2026-2034 |
| Historical Period | 2020-2025 |
| Growth Rate | CAGR of 7.70% from 2020-2034 |
| Segmentation |
|
Table of Contents
- 1. Introduction
- 1.1. Research Scope
- 1.2. Market Segmentation
- 1.3. Research Objective
- 1.4. Definitions and Assumptions
- 2. Executive Summary
- 2.1. Market Snapshot
- 3. Market Dynamics
- 3.1. Market Drivers
- 3.2. Market Restrains
- 3.3. Market Trends
- 3.4. Market Opportunities
- 4. Market Factor Analysis
- 4.1. Porters Five Forces
- 4.1.1. Bargaining Power of Suppliers
- 4.1.2. Bargaining Power of Buyers
- 4.1.3. Threat of New Entrants
- 4.1.4. Threat of Substitutes
- 4.1.5. Competitive Rivalry
- 4.2. PESTEL analysis
- 4.3. BCG Analysis
- 4.3.1. Stars (High Growth, High Market Share)
- 4.3.2. Cash Cows (Low Growth, High Market Share)
- 4.3.3. Question Mark (High Growth, Low Market Share)
- 4.3.4. Dogs (Low Growth, Low Market Share)
- 4.4. Ansoff Matrix Analysis
- 4.5. Supply Chain Analysis
- 4.6. Regulatory Landscape
- 4.7. Current Market Potential and Opportunity Assessment (TAM–SAM–SOM Framework)
- 4.8. VDR Analyst Note
- 4.1. Porters Five Forces
- 5. Market Analysis, Insights and Forecast 2021-2033
- 5.1. Market Analysis, Insights and Forecast - by Offering
- 5.1.1. Hardware
- 5.1.2. Software
- 5.1.3. Services
- 5.2. Market Analysis, Insights and Forecast - by End User
- 5.2.1. Telecom and Internet Service Providers
- 5.2.2. Government
- 5.2.3. Other End-users
- 5.3. Market Analysis, Insights and Forecast - by Region
- 5.3.1. North America
- 5.3.2. Europe
- 5.3.3. Asia Pacific
- 5.3.4. Latin America
- 5.3.5. Middle East and Africa
- 5.1. Market Analysis, Insights and Forecast - by Offering
- 6. Global Next Generation Network Industry Analysis, Insights and Forecast, 2021-2033
- 6.1. Market Analysis, Insights and Forecast - by Offering
- 6.1.1. Hardware
- 6.1.2. Software
- 6.1.3. Services
- 6.2. Market Analysis, Insights and Forecast - by End User
- 6.2.1. Telecom and Internet Service Providers
- 6.2.2. Government
- 6.2.3. Other End-users
- 6.1. Market Analysis, Insights and Forecast - by Offering
- 7. North America Next Generation Network Industry Analysis, Insights and Forecast, 2021-2033
- 7.1. Market Analysis, Insights and Forecast - by Offering
- 7.1.1. Hardware
- 7.1.2. Software
- 7.1.3. Services
- 7.2. Market Analysis, Insights and Forecast - by End User
- 7.2.1. Telecom and Internet Service Providers
- 7.2.2. Government
- 7.2.3. Other End-users
- 7.1. Market Analysis, Insights and Forecast - by Offering
- 8. Europe Next Generation Network Industry Analysis, Insights and Forecast, 2021-2033
- 8.1. Market Analysis, Insights and Forecast - by Offering
- 8.1.1. Hardware
- 8.1.2. Software
- 8.1.3. Services
- 8.2. Market Analysis, Insights and Forecast - by End User
- 8.2.1. Telecom and Internet Service Providers
- 8.2.2. Government
- 8.2.3. Other End-users
- 8.1. Market Analysis, Insights and Forecast - by Offering
- 9. Asia Pacific Next Generation Network Industry Analysis, Insights and Forecast, 2021-2033
- 9.1. Market Analysis, Insights and Forecast - by Offering
- 9.1.1. Hardware
- 9.1.2. Software
- 9.1.3. Services
- 9.2. Market Analysis, Insights and Forecast - by End User
- 9.2.1. Telecom and Internet Service Providers
- 9.2.2. Government
- 9.2.3. Other End-users
- 9.1. Market Analysis, Insights and Forecast - by Offering
- 10. Latin America Next Generation Network Industry Analysis, Insights and Forecast, 2021-2033
- 10.1. Market Analysis, Insights and Forecast - by Offering
- 10.1.1. Hardware
- 10.1.2. Software
- 10.1.3. Services
- 10.2. Market Analysis, Insights and Forecast - by End User
- 10.2.1. Telecom and Internet Service Providers
- 10.2.2. Government
- 10.2.3. Other End-users
- 10.1. Market Analysis, Insights and Forecast - by Offering
- 11. Middle East and Africa Next Generation Network Industry Analysis, Insights and Forecast, 2021-2033
- 11.1. Market Analysis, Insights and Forecast - by Offering
- 11.1.1. Hardware
- 11.1.2. Software
- 11.1.3. Services
- 11.2. Market Analysis, Insights and Forecast - by End User
- 11.2.1. Telecom and Internet Service Providers
- 11.2.2. Government
- 11.2.3. Other End-users
- 11.1. Market Analysis, Insights and Forecast - by Offering
- 12. Competitive Analysis
- 12.1. Company Profiles
- 12.1.1 IBM Corporation
- 12.1.1.1. Company Overview
- 12.1.1.2. Products
- 12.1.1.3. Company Financials
- 12.1.1.4. SWOT Analysis
- 12.1.2 Samsung Electronics Co Ltd
- 12.1.2.1. Company Overview
- 12.1.2.2. Products
- 12.1.2.3. Company Financials
- 12.1.2.4. SWOT Analysis
- 12.1.3 Cisco Systems Inc
- 12.1.3.1. Company Overview
- 12.1.3.2. Products
- 12.1.3.3. Company Financials
- 12.1.3.4. SWOT Analysis
- 12.1.4 Juniper Networks Inc
- 12.1.4.1. Company Overview
- 12.1.4.2. Products
- 12.1.4.3. Company Financials
- 12.1.4.4. SWOT Analysis
- 12.1.5 Telefonaktiebolaget LM Ericsso
- 12.1.5.1. Company Overview
- 12.1.5.2. Products
- 12.1.5.3. Company Financials
- 12.1.5.4. SWOT Analysis
- 12.1.6 NEC Corporation
- 12.1.6.1. Company Overview
- 12.1.6.2. Products
- 12.1.6.3. Company Financials
- 12.1.6.4. SWOT Analysis
- 12.1.7 Huawei Technologies Co Ltd
- 12.1.7.1. Company Overview
- 12.1.7.2. Products
- 12.1.7.3. Company Financials
- 12.1.7.4. SWOT Analysis
- 12.1.8 ZTE Corporation
- 12.1.8.1. Company Overview
- 12.1.8.2. Products
- 12.1.8.3. Company Financials
- 12.1.8.4. SWOT Analysis
- 12.1.9 Nokia Corporation
- 12.1.9.1. Company Overview
- 12.1.9.2. Products
- 12.1.9.3. Company Financials
- 12.1.9.4. SWOT Analysis
- 12.1.10 Ciena Corporation
- 12.1.10.1. Company Overview
- 12.1.10.2. Products
- 12.1.10.3. Company Financials
- 12.1.10.4. SWOT Analysis
- 12.1.1 IBM Corporation
- 12.2. Market Entropy
- 12.2.1 Company's Key Areas Served
- 12.2.2 Recent Developments
- 12.3. Company Market Share Analysis 2025
- 12.3.1 Top 5 Companies Market Share Analysis
- 12.3.2 Top 3 Companies Market Share Analysis
- 12.4. List of Potential Customers
- 13. Research Methodology
List of Figures
- Figure 1: Global Next Generation Network Industry Revenue Breakdown (Million, %) by Region 2025 & 2033
- Figure 2: North America Next Generation Network Industry Revenue (Million), by Offering 2025 & 2033
- Figure 3: North America Next Generation Network Industry Revenue Share (%), by Offering 2025 & 2033
- Figure 4: North America Next Generation Network Industry Revenue (Million), by End User 2025 & 2033
- Figure 5: North America Next Generation Network Industry Revenue Share (%), by End User 2025 & 2033
- Figure 6: North America Next Generation Network Industry Revenue (Million), by Country 2025 & 2033
- Figure 7: North America Next Generation Network Industry Revenue Share (%), by Country 2025 & 2033
- Figure 8: Europe Next Generation Network Industry Revenue (Million), by Offering 2025 & 2033
- Figure 9: Europe Next Generation Network Industry Revenue Share (%), by Offering 2025 & 2033
- Figure 10: Europe Next Generation Network Industry Revenue (Million), by End User 2025 & 2033
- Figure 11: Europe Next Generation Network Industry Revenue Share (%), by End User 2025 & 2033
- Figure 12: Europe Next Generation Network Industry Revenue (Million), by Country 2025 & 2033
- Figure 13: Europe Next Generation Network Industry Revenue Share (%), by Country 2025 & 2033
- Figure 14: Asia Pacific Next Generation Network Industry Revenue (Million), by Offering 2025 & 2033
- Figure 15: Asia Pacific Next Generation Network Industry Revenue Share (%), by Offering 2025 & 2033
- Figure 16: Asia Pacific Next Generation Network Industry Revenue (Million), by End User 2025 & 2033
- Figure 17: Asia Pacific Next Generation Network Industry Revenue Share (%), by End User 2025 & 2033
- Figure 18: Asia Pacific Next Generation Network Industry Revenue (Million), by Country 2025 & 2033
- Figure 19: Asia Pacific Next Generation Network Industry Revenue Share (%), by Country 2025 & 2033
- Figure 20: Latin America Next Generation Network Industry Revenue (Million), by Offering 2025 & 2033
- Figure 21: Latin America Next Generation Network Industry Revenue Share (%), by Offering 2025 & 2033
- Figure 22: Latin America Next Generation Network Industry Revenue (Million), by End User 2025 & 2033
- Figure 23: Latin America Next Generation Network Industry Revenue Share (%), by End User 2025 & 2033
- Figure 24: Latin America Next Generation Network Industry Revenue (Million), by Country 2025 & 2033
- Figure 25: Latin America Next Generation Network Industry Revenue Share (%), by Country 2025 & 2033
- Figure 26: Middle East and Africa Next Generation Network Industry Revenue (Million), by Offering 2025 & 2033
- Figure 27: Middle East and Africa Next Generation Network Industry Revenue Share (%), by Offering 2025 & 2033
- Figure 28: Middle East and Africa Next Generation Network Industry Revenue (Million), by End User 2025 & 2033
- Figure 29: Middle East and Africa Next Generation Network Industry Revenue Share (%), by End User 2025 & 2033
- Figure 30: Middle East and Africa Next Generation Network Industry Revenue (Million), by Country 2025 & 2033
- Figure 31: Middle East and Africa Next Generation Network Industry Revenue Share (%), by Country 2025 & 2033
List of Tables
- Table 1: Global Next Generation Network Industry Revenue Million Forecast, by Offering 2020 & 2033
- Table 2: Global Next Generation Network Industry Revenue Million Forecast, by End User 2020 & 2033
- Table 3: Global Next Generation Network Industry Revenue Million Forecast, by Region 2020 & 2033
- Table 4: Global Next Generation Network Industry Revenue Million Forecast, by Offering 2020 & 2033
- Table 5: Global Next Generation Network Industry Revenue Million Forecast, by End User 2020 & 2033
- Table 6: Global Next Generation Network Industry Revenue Million Forecast, by Country 2020 & 2033
- Table 7: Global Next Generation Network Industry Revenue Million Forecast, by Offering 2020 & 2033
- Table 8: Global Next Generation Network Industry Revenue Million Forecast, by End User 2020 & 2033
- Table 9: Global Next Generation Network Industry Revenue Million Forecast, by Country 2020 & 2033
- Table 10: Global Next Generation Network Industry Revenue Million Forecast, by Offering 2020 & 2033
- Table 11: Global Next Generation Network Industry Revenue Million Forecast, by End User 2020 & 2033
- Table 12: Global Next Generation Network Industry Revenue Million Forecast, by Country 2020 & 2033
- Table 13: Global Next Generation Network Industry Revenue Million Forecast, by Offering 2020 & 2033
- Table 14: Global Next Generation Network Industry Revenue Million Forecast, by End User 2020 & 2033
- Table 15: Global Next Generation Network Industry Revenue Million Forecast, by Country 2020 & 2033
- Table 16: Global Next Generation Network Industry Revenue Million Forecast, by Offering 2020 & 2033
- Table 17: Global Next Generation Network Industry Revenue Million Forecast, by End User 2020 & 2033
- Table 18: Global Next Generation Network Industry Revenue Million Forecast, by Country 2020 & 2033
Frequently Asked Questions
1. What is the projected Compound Annual Growth Rate (CAGR) of the Next Generation Network Industry?
The projected CAGR is approximately 7.70%.
2. Which companies are prominent players in the Next Generation Network Industry?
Key companies in the market include IBM Corporation, Samsung Electronics Co Ltd, Cisco Systems Inc, Juniper Networks Inc, Telefonaktiebolaget LM Ericsso, NEC Corporation, Huawei Technologies Co Ltd, ZTE Corporation, Nokia Corporation, Ciena Corporation.
3. What are the main segments of the Next Generation Network Industry?
The market segments include Offering, End User.
4. Can you provide details about the market size?
The market size is estimated to be USD 30.55 Million as of 2022.
5. What are some drivers contributing to market growth?
Increasing Demand for High-Speed Services.
6. What are the notable trends driving market growth?
Hardware Offering Holds Significant Market Share.
7. Are there any restraints impacting market growth?
High Costs Related to the Infrastructure.
8. Can you provide examples of recent developments in the market?
February 2024 - Schneider Electric, delivering next-generation, open automation infrastructure in collaboration with the technology companies Intel and Red Hat, released a Distributed Control Node (DCN) software framework. An expansion of Schneider Electric's EcoStruxure Automation Expert, this new framework allows industrial companies to move to a software-defined, plug-and-produce solution, enabling them to augment their operations, ensure quality, minimize complexity, and optimize costs.
9. What pricing options are available for accessing the report?
Pricing options include single-user, multi-user, and enterprise licenses priced at USD 4750, USD 5250, and USD 8750 respectively.
10. Is the market size provided in terms of value or volume?
The market size is provided in terms of value, measured in Million.
11. Are there any specific market keywords associated with the report?
Yes, the market keyword associated with the report is "Next Generation Network Industry," which aids in identifying and referencing the specific market segment covered.
12. How do I determine which pricing option suits my needs best?
The pricing options vary based on user requirements and access needs. Individual users may opt for single-user licenses, while businesses requiring broader access may choose multi-user or enterprise licenses for cost-effective access to the report.
13. Are there any additional resources or data provided in the Next Generation Network Industry report?
While the report offers comprehensive insights, it's advisable to review the specific contents or supplementary materials provided to ascertain if additional resources or data are available.
14. How can I stay updated on further developments or reports in the Next Generation Network Industry?
To stay informed about further developments, trends, and reports in the Next Generation Network Industry, consider subscribing to industry newsletters, following relevant companies and organizations, or regularly checking reputable industry news sources and publications.
Methodology
Step 1 - Identification of Relevant Samples Size from Population Database


Step 2 - Approaches for Defining Global Market Size (Value, Volume* & Price*)

Note*: In applicable scenarios
Step 3 - Data Sources
Primary Research
- Web Analytics
- Survey Reports
- Research Institute
- Latest Research Reports
- Opinion Leaders
Secondary Research
- Annual Reports
- White Paper
- Latest Press Release
- Industry Association
- Paid Database
- Investor Presentations

Step 4 - Data Triangulation
Involves using different sources of information in order to increase the validity of a study
These sources are likely to be stakeholders in a program - participants, other researchers, program staff, other community members, and so on.
Then we put all data in single framework & apply various statistical tools to find out the dynamic on the market.
During the analysis stage, feedback from the stakeholder groups would be compared to determine areas of agreement as well as areas of divergence