

Key Insights
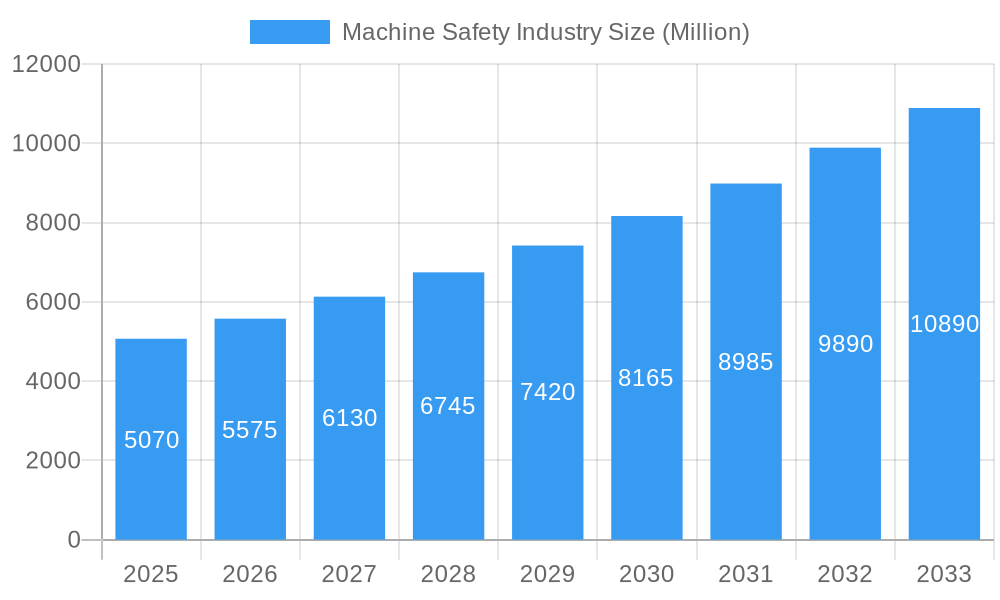
The global Machine Safety Industry is poised for significant expansion, with a current market size estimated at approximately $5.07 billion. This robust growth is projected to continue at a Compound Annual Growth Rate (CAGR) of 9.97% over the forecast period of 2025-2033, reaching substantial valuations. This upward trajectory is primarily driven by increasingly stringent industrial safety regulations worldwide, a growing awareness among businesses about the critical importance of protecting personnel and assets, and the escalating adoption of automation and Industry 4.0 technologies. The integration of advanced safety features into modern machinery, from presence sensing safety sensors and emergency stop devices to sophisticated safety controller/modules/relays, is becoming indispensable for preventing accidents, minimizing downtime, and ensuring operational continuity. Furthermore, the inherent complexity of industrial processes across sectors like Electronics and Semiconductors, Oil and Gas, and Automotive necessitates comprehensive machine safety solutions to mitigate risks.
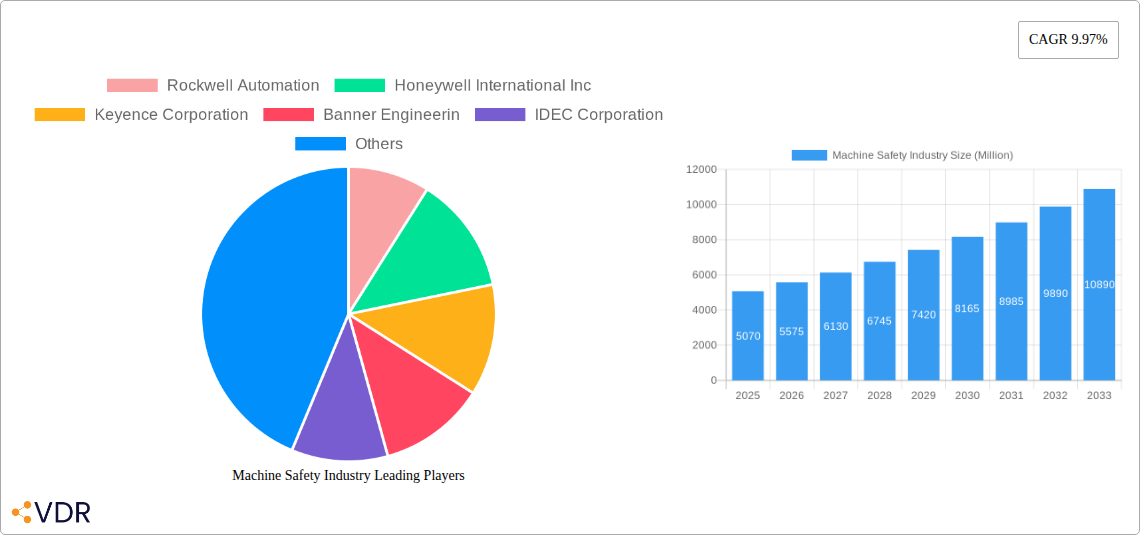
Machine Safety Industry Market Size (In Billion)
The market is characterized by a dynamic competitive landscape, featuring established global players such as Siemens AG, Rockwell Automation, and Honeywell International Inc., alongside innovative specialists like Sick AG and Pilz GmbH & Co KG. These companies are actively engaged in research and development, introducing cutting-edge solutions that enhance safety functionalities and user experience. The market is segmented by implementation, with both individual and embedded components playing crucial roles. Key end-user industries are diverse, encompassing critical sectors like Healthcare and Food and Beverage, where product integrity and sterile environments are paramount, alongside manufacturing and heavy industries. Regional analysis indicates strong market potential in North America and Europe, driven by mature industrial bases and proactive regulatory frameworks, with Asia Pacific emerging as a rapidly growing hub due to its expanding manufacturing sector and increasing investments in industrial safety.
Machine Safety Industry Company Market Share
Machine Safety Industry Report: Market Dynamics, Growth Trends, and Future Outlook (2019–2033)
This comprehensive report delves into the global Machine Safety Industry, providing an in-depth analysis of market dynamics, growth trajectories, key players, and future opportunities. Covering the historical period from 2019 to 2024, with a base year of 2025 and a forecast period extending to 2033, this study offers critical insights for stakeholders seeking to navigate this evolving landscape. The report leverages high-traffic keywords, parent and child market segmentation, and quantitative data to deliver actionable intelligence.
Machine Safety Industry Market Dynamics & Structure
The Machine Safety Industry exhibits a moderately concentrated market structure, driven by significant investment in automation and stringent occupational safety regulations worldwide. Technological innovation is a primary driver, with companies continuously developing advanced sensing, control, and interlocking solutions to enhance operational safety and efficiency. The increasing adoption of Industry 4.0 principles, including the Industrial Internet of Things (IIoT) and artificial intelligence (AI), is further pushing the boundaries of what is achievable in machine safety. Regulatory frameworks, such as the European Machinery Directive and OSHA standards in the United States, mandate compliance, creating a consistent demand for certified safety products and systems.
- Market Concentration: Dominated by a few large multinational corporations, but with a growing number of specialized niche players emerging.
- Technological Innovation Drivers: Miniaturization of components, enhanced sensor accuracy, AI-powered predictive safety, and the integration of safety functions into embedded systems.
- Regulatory Frameworks: Continuous evolution of safety standards and certifications, compelling manufacturers to adopt best-in-class safety solutions.
- Competitive Product Substitutes: While direct substitutes are limited for certified safety components, advancements in general automation technology can sometimes indirectly impact the demand for specific safety solutions.
- End-User Demographics: Broadly diversified across manufacturing sectors, with increasing demand from emerging economies and high-tech industries.
- M&A Trends: Strategic acquisitions are prevalent as larger companies seek to expand their product portfolios and geographical reach. Recent M&A activity has focused on acquiring expertise in areas like cybersecurity for industrial control systems and advanced sensor technologies.
Machine Safety Industry Growth Trends & Insights
The Machine Safety Industry is poised for robust growth, driven by an increasing global emphasis on workplace safety and the relentless march of industrial automation. The market size evolution is directly linked to the adoption rates of automated machinery across various sectors. As manufacturing processes become more sophisticated and human-robot collaboration increases, the need for advanced machine safety solutions escalates. Technological disruptions, such as the integration of AI for predictive maintenance and anomaly detection, are creating new avenues for market expansion and enhancing the overall safety ecosystem. Consumer behavior shifts are also playing a role, with end-users prioritizing safer working environments to attract and retain skilled labor, alongside a growing awareness of the long-term cost savings associated with accident prevention.
The global machine safety market is projected to expand at a Compound Annual Growth Rate (CAGR) of approximately 8.5% from 2025 to 2033. This growth trajectory is underpinned by increasing investments in smart manufacturing initiatives, particularly in the automotive and electronics sectors. The market penetration of advanced safety controllers and safety sensors is expected to surge as businesses recognize the direct correlation between safety investments and reduced operational downtime, improved productivity, and lower insurance premiums.
- Market Size Evolution: Expected to reach approximately $22 billion by 2033, from an estimated $11 billion in 2025.
- Adoption Rates: Steadily increasing across all major industrial segments, with particularly high adoption in sectors prone to hazardous operations.
- Technological Disruptions: AI, machine learning, and IIoT are transforming traditional safety paradigms, enabling proactive rather than reactive safety measures.
- Consumer Behavior Shifts: Growing demand for integrated safety solutions, ease of implementation, and solutions that contribute to overall operational efficiency.
- Market Penetration: Expected to see significant growth in embedded safety components, driven by the increasing complexity of modern machinery.
Dominant Regions, Countries, or Segments in Machine Safety Industry
The Automotive end-user segment is emerging as a dominant force in driving growth within the global Machine Safety Industry. This dominance is propelled by the sector's continuous pursuit of automation, including the widespread adoption of collaborative robots (cobots) and advanced assembly lines. The inherent complexity and speed of automotive manufacturing necessitate highly sophisticated safety systems to protect both human workers and expensive machinery. Furthermore, stringent global automotive safety standards and the increasing focus on accident prevention in vehicle production facilities contribute significantly to the demand for advanced machine safety solutions.
- Automotive: Anticipated to hold a market share of over 25% within the end-user segment by 2033. Key drivers include:
- High Automation Levels: Extensive use of industrial robots, automated guided vehicles (AGVs), and complex assembly processes.
- Stringent Safety Standards: Global regulations and industry-specific mandates for worker and equipment protection.
- Focus on Cobots: Increasing integration of collaborative robots requiring advanced safety features for human-robot interaction.
- Production Efficiency: Emphasis on minimizing downtime through proactive safety measures and rapid incident response.
Within the implementation perspective, Individual Components are projected to remain the largest segment, accounting for approximately 60% of the market. This segment's growth is fueled by the widespread need for basic safety functionalities across a vast array of machinery.
- Implementation: Individual Components: This segment encompasses:
- Presence Sensing Safety Sensors: Critical for detecting human presence and preventing hazardous machine movements. Expected to see robust growth due to advancements in optical and radar sensing technologies.
- Emergency Stop Devices: Essential for immediate shutdown in critical situations. Demand remains consistently high.
- Safety Interlock Switches: Used to prevent access to hazardous areas while machinery is in operation. Integration into complex systems is a key trend.
- Safety Controller/Modules/Relays: The brains of safety systems, processing inputs from sensors and controlling outputs. Increasing complexity and integration capabilities are driving demand.
- Other Components: Including safety ropes, light curtains, and safety mats, catering to diverse risk mitigation needs.
The Electronics and Semiconductors end-user segment is another significant contributor to market expansion, driven by the miniaturization of devices and the need for precision in manufacturing. The Food and Beverage sector is also demonstrating substantial growth due to increasing automation and the imperative for hygiene and safety compliance.
- Electronics and Semiconductors: Characterized by high-precision operations and the need for cleanroom environments, necessitating specialized safety solutions.
- Food and Beverage: Driven by automation for efficiency and hygiene, with a growing demand for safety systems that can withstand washdown conditions and comply with food safety regulations.
Machine Safety Industry Product Landscape
The Machine Safety Industry is characterized by continuous product innovation aimed at enhancing safety, efficiency, and connectivity. Key advancements include the development of intelligent safety sensors with integrated diagnostics and predictive maintenance capabilities, and compact, modular safety controllers that allow for flexible system configurations. The trend towards cybersecurity-enabled safety solutions is also gaining momentum, protecting critical safety functions from unauthorized access and cyber threats. Applications range from safeguarding individual machines to comprehensive safety architectures for entire production plants, ensuring compliance with evolving global safety standards.
Key Drivers, Barriers & Challenges in Machine Safety Industry
Key Drivers:
- Increasing Automation: The global drive towards automation in manufacturing and industrial processes necessitates robust machine safety solutions to protect workers and assets.
- Stringent Safety Regulations: Growing emphasis on workplace safety by governments worldwide mandates compliance with rigorous safety standards, creating consistent demand.
- Industry 4.0 Adoption: The integration of IIoT, AI, and cloud computing in manufacturing environments requires advanced, connected safety systems.
- Reduced Operational Costs: Investments in machine safety lead to fewer accidents, reduced downtime, and lower insurance premiums, offering a clear ROI.
Barriers & Challenges:
- High Initial Investment: The cost of advanced safety systems can be a barrier for small and medium-sized enterprises (SMEs).
- Complexity of Integration: Integrating new safety systems with existing legacy machinery can be complex and time-consuming.
- Skilled Workforce Shortage: A lack of adequately trained personnel for the installation, maintenance, and operation of sophisticated safety systems.
- Cybersecurity Threats: The increasing connectivity of safety systems makes them vulnerable to cyberattacks, requiring robust security measures.
- Supply Chain Disruptions: Global supply chain issues can impact the availability and lead times of critical safety components.
Emerging Opportunities in Machine Safety Industry
Emerging opportunities in the Machine Safety Industry lie in the development of AI-powered predictive safety analytics, offering proactive risk identification and mitigation. The increasing adoption of collaborative robots presents a significant opportunity for advanced human-robot safety solutions. Furthermore, the growing demand for smart factory integration creates a need for cybersecurity-enabled safety systems that ensure the integrity of safety functions. Untapped markets in developing economies and specialized applications within sectors like renewable energy also present considerable growth potential.
Growth Accelerators in the Machine Safety Industry Industry
Several catalysts are accelerating the growth of the Machine Safety Industry. Technological breakthroughs in sensor technology, such as advanced vision systems and radar, are enabling more precise and comprehensive safety monitoring. Strategic partnerships between safety solution providers and automation technology companies are fostering the development of integrated, end-to-end safety solutions. Market expansion strategies, including focusing on emerging economies and developing tailored solutions for niche industrial applications, are also driving sustained growth. The increasing focus on sustainability and operational efficiency further encourages the adoption of advanced safety systems that minimize waste and downtime.
Key Players Shaping the Machine Safety Industry Market
- Rockwell Automation
- Honeywell International Inc
- Keyence Corporation
- Banner Engineering
- IDEC Corporation
- Mitsubishi Electric Corporation
- Siemens AG
- Schneider Electric SE
- Omron Corporation
- Sick AG
- Pilz GmbH & Co KG
- ABB Limited
Notable Milestones in Machine Safety Industry Sector
- October 2021: Pilz launched a new safe radar sensor, PSENradar, for safe protection zone monitoring in rugged conditions such as dust, dirt, rain, light, sparks, or vibrations. The sensor can be used along with the configurable small controller PNOZmulti 2, offering an optimum solution. In addition to outdoor applications and areas in woodworking and metalworking. It also makes it possible to safeguard robot applications because the solution achieves a higher category.
- February 2021: Oji Fibre Solutions, producing market pulp, paperboard, and fiber-based packaging in New Zealand, selected ABB to supply a specially designed winder safety system. The system features a range of wind safety improvement steps and devices, including mechanical guarding, electrical controls, hydraulic controls (with redundancy), optical, and safe speed monitoring.
In-Depth Machine Safety Industry Market Outlook
The Machine Safety Industry is set to experience sustained growth, driven by the relentless pursuit of operational excellence and uncompromising safety standards. Future market potential is amplified by the increasing integration of Industry 4.0 technologies, demanding more intelligent and interconnected safety solutions. Strategic opportunities abound in developing cybersecurity protocols for safety systems, expanding into underserved geographical regions, and offering customized safety packages for burgeoning sectors like renewable energy and advanced manufacturing. The industry's trajectory points towards a future where safety is not just a compliance requirement but an integral component of efficient, productive, and resilient industrial operations.
Machine Safety Industry Segmentation
-
1. Implementation
- 1.1. Individual Components
- 1.2. Embedded Components
-
2. Component
- 2.1. Presence Sensing Safety Sensors
- 2.2. Emergency Stop Devices
- 2.3. Safety Interlock Switches
- 2.4. Safety Controller/Modules/Relays
- 2.5. Other Components
-
3. End-User
- 3.1. Electronics and Semiconductors
- 3.2. Oil and Gas
- 3.3. Healthcare
- 3.4. Food and Beverage
- 3.5. Automotive
- 3.6. Other End-Users
Machine Safety Industry Segmentation By Geography
- 1. North America
- 2. Europe
- 3. Asia Pacific
- 4. Latin America
- 5. Middle East and Africa
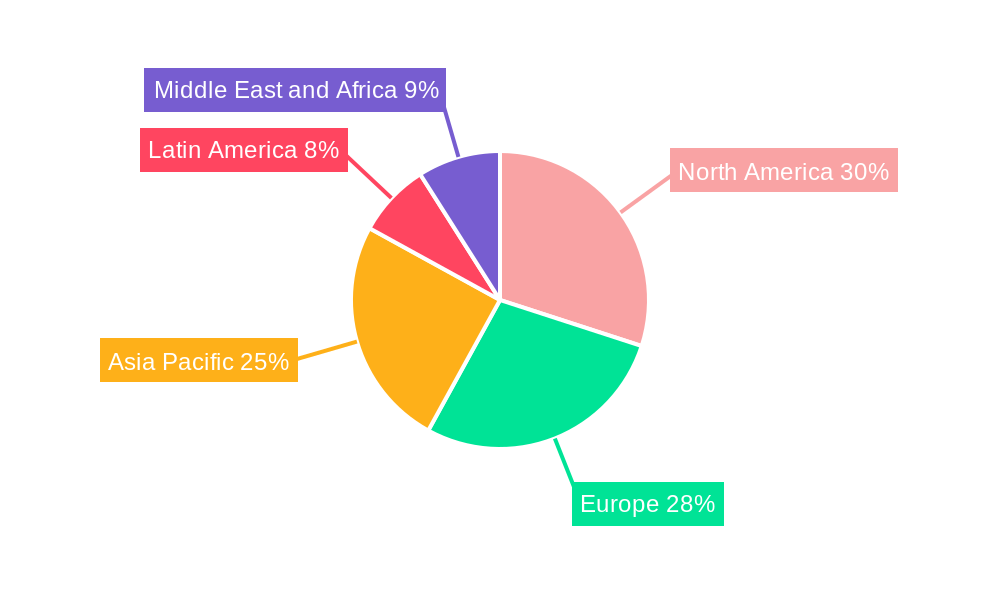
Machine Safety Industry Regional Market Share
Geographic Coverage of Machine Safety Industry
Machine Safety Industry REPORT HIGHLIGHTS
| Aspects | Details |
|---|---|
| Study Period | 2020-2034 |
| Base Year | 2025 |
| Estimated Year | 2026 |
| Forecast Period | 2026-2034 |
| Historical Period | 2020-2025 |
| Growth Rate | CAGR of 9.97% from 2020-2034 |
| Segmentation |
|
Table of Contents
- 1. Introduction
- 1.1. Research Scope
- 1.2. Market Segmentation
- 1.3. Research Objective
- 1.4. Definitions and Assumptions
- 2. Executive Summary
- 2.1. Market Snapshot
- 3. Market Dynamics
- 3.1. Market Drivers
- 3.2. Market Restrains
- 3.3. Market Trends
- 3.4. Market Opportunities
- 4. Market Factor Analysis
- 4.1. Porters Five Forces
- 4.1.1. Bargaining Power of Suppliers
- 4.1.2. Bargaining Power of Buyers
- 4.1.3. Threat of New Entrants
- 4.1.4. Threat of Substitutes
- 4.1.5. Competitive Rivalry
- 4.2. PESTEL analysis
- 4.3. BCG Analysis
- 4.3.1. Stars (High Growth, High Market Share)
- 4.3.2. Cash Cows (Low Growth, High Market Share)
- 4.3.3. Question Mark (High Growth, Low Market Share)
- 4.3.4. Dogs (Low Growth, Low Market Share)
- 4.4. Ansoff Matrix Analysis
- 4.5. Supply Chain Analysis
- 4.6. Regulatory Landscape
- 4.7. Current Market Potential and Opportunity Assessment (TAM–SAM–SOM Framework)
- 4.8. VDR Analyst Note
- 4.1. Porters Five Forces
- 5. Market Analysis, Insights and Forecast 2021-2033
- 5.1. Market Analysis, Insights and Forecast - by Implementation
- 5.1.1. Individual Components
- 5.1.2. Embedded Components
- 5.2. Market Analysis, Insights and Forecast - by Component
- 5.2.1. Presence Sensing Safety Sensors
- 5.2.2. Emergency Stop Devices
- 5.2.3. Safety Interlock Switches
- 5.2.4. Safety Controller/Modules/Relays
- 5.2.5. Other Components
- 5.3. Market Analysis, Insights and Forecast - by End-User
- 5.3.1. Electronics and Semiconductors
- 5.3.2. Oil and Gas
- 5.3.3. Healthcare
- 5.3.4. Food and Beverage
- 5.3.5. Automotive
- 5.3.6. Other End-Users
- 5.4. Market Analysis, Insights and Forecast - by Region
- 5.4.1. North America
- 5.4.2. Europe
- 5.4.3. Asia Pacific
- 5.4.4. Latin America
- 5.4.5. Middle East and Africa
- 5.1. Market Analysis, Insights and Forecast - by Implementation
- 6. Global Machine Safety Industry Analysis, Insights and Forecast, 2021-2033
- 6.1. Market Analysis, Insights and Forecast - by Implementation
- 6.1.1. Individual Components
- 6.1.2. Embedded Components
- 6.2. Market Analysis, Insights and Forecast - by Component
- 6.2.1. Presence Sensing Safety Sensors
- 6.2.2. Emergency Stop Devices
- 6.2.3. Safety Interlock Switches
- 6.2.4. Safety Controller/Modules/Relays
- 6.2.5. Other Components
- 6.3. Market Analysis, Insights and Forecast - by End-User
- 6.3.1. Electronics and Semiconductors
- 6.3.2. Oil and Gas
- 6.3.3. Healthcare
- 6.3.4. Food and Beverage
- 6.3.5. Automotive
- 6.3.6. Other End-Users
- 6.1. Market Analysis, Insights and Forecast - by Implementation
- 7. North America Machine Safety Industry Analysis, Insights and Forecast, 2021-2033
- 7.1. Market Analysis, Insights and Forecast - by Implementation
- 7.1.1. Individual Components
- 7.1.2. Embedded Components
- 7.2. Market Analysis, Insights and Forecast - by Component
- 7.2.1. Presence Sensing Safety Sensors
- 7.2.2. Emergency Stop Devices
- 7.2.3. Safety Interlock Switches
- 7.2.4. Safety Controller/Modules/Relays
- 7.2.5. Other Components
- 7.3. Market Analysis, Insights and Forecast - by End-User
- 7.3.1. Electronics and Semiconductors
- 7.3.2. Oil and Gas
- 7.3.3. Healthcare
- 7.3.4. Food and Beverage
- 7.3.5. Automotive
- 7.3.6. Other End-Users
- 7.1. Market Analysis, Insights and Forecast - by Implementation
- 8. Europe Machine Safety Industry Analysis, Insights and Forecast, 2021-2033
- 8.1. Market Analysis, Insights and Forecast - by Implementation
- 8.1.1. Individual Components
- 8.1.2. Embedded Components
- 8.2. Market Analysis, Insights and Forecast - by Component
- 8.2.1. Presence Sensing Safety Sensors
- 8.2.2. Emergency Stop Devices
- 8.2.3. Safety Interlock Switches
- 8.2.4. Safety Controller/Modules/Relays
- 8.2.5. Other Components
- 8.3. Market Analysis, Insights and Forecast - by End-User
- 8.3.1. Electronics and Semiconductors
- 8.3.2. Oil and Gas
- 8.3.3. Healthcare
- 8.3.4. Food and Beverage
- 8.3.5. Automotive
- 8.3.6. Other End-Users
- 8.1. Market Analysis, Insights and Forecast - by Implementation
- 9. Asia Pacific Machine Safety Industry Analysis, Insights and Forecast, 2021-2033
- 9.1. Market Analysis, Insights and Forecast - by Implementation
- 9.1.1. Individual Components
- 9.1.2. Embedded Components
- 9.2. Market Analysis, Insights and Forecast - by Component
- 9.2.1. Presence Sensing Safety Sensors
- 9.2.2. Emergency Stop Devices
- 9.2.3. Safety Interlock Switches
- 9.2.4. Safety Controller/Modules/Relays
- 9.2.5. Other Components
- 9.3. Market Analysis, Insights and Forecast - by End-User
- 9.3.1. Electronics and Semiconductors
- 9.3.2. Oil and Gas
- 9.3.3. Healthcare
- 9.3.4. Food and Beverage
- 9.3.5. Automotive
- 9.3.6. Other End-Users
- 9.1. Market Analysis, Insights and Forecast - by Implementation
- 10. Latin America Machine Safety Industry Analysis, Insights and Forecast, 2021-2033
- 10.1. Market Analysis, Insights and Forecast - by Implementation
- 10.1.1. Individual Components
- 10.1.2. Embedded Components
- 10.2. Market Analysis, Insights and Forecast - by Component
- 10.2.1. Presence Sensing Safety Sensors
- 10.2.2. Emergency Stop Devices
- 10.2.3. Safety Interlock Switches
- 10.2.4. Safety Controller/Modules/Relays
- 10.2.5. Other Components
- 10.3. Market Analysis, Insights and Forecast - by End-User
- 10.3.1. Electronics and Semiconductors
- 10.3.2. Oil and Gas
- 10.3.3. Healthcare
- 10.3.4. Food and Beverage
- 10.3.5. Automotive
- 10.3.6. Other End-Users
- 10.1. Market Analysis, Insights and Forecast - by Implementation
- 11. Middle East and Africa Machine Safety Industry Analysis, Insights and Forecast, 2021-2033
- 11.1. Market Analysis, Insights and Forecast - by Implementation
- 11.1.1. Individual Components
- 11.1.2. Embedded Components
- 11.2. Market Analysis, Insights and Forecast - by Component
- 11.2.1. Presence Sensing Safety Sensors
- 11.2.2. Emergency Stop Devices
- 11.2.3. Safety Interlock Switches
- 11.2.4. Safety Controller/Modules/Relays
- 11.2.5. Other Components
- 11.3. Market Analysis, Insights and Forecast - by End-User
- 11.3.1. Electronics and Semiconductors
- 11.3.2. Oil and Gas
- 11.3.3. Healthcare
- 11.3.4. Food and Beverage
- 11.3.5. Automotive
- 11.3.6. Other End-Users
- 11.1. Market Analysis, Insights and Forecast - by Implementation
- 12. Competitive Analysis
- 12.1. Company Profiles
- 12.1.1 Rockwell Automation
- 12.1.1.1. Company Overview
- 12.1.1.2. Products
- 12.1.1.3. Company Financials
- 12.1.1.4. SWOT Analysis
- 12.1.2 Honeywell International Inc
- 12.1.2.1. Company Overview
- 12.1.2.2. Products
- 12.1.2.3. Company Financials
- 12.1.2.4. SWOT Analysis
- 12.1.3 Keyence Corporation
- 12.1.3.1. Company Overview
- 12.1.3.2. Products
- 12.1.3.3. Company Financials
- 12.1.3.4. SWOT Analysis
- 12.1.4 Banner Engineerin
- 12.1.4.1. Company Overview
- 12.1.4.2. Products
- 12.1.4.3. Company Financials
- 12.1.4.4. SWOT Analysis
- 12.1.5 IDEC Corporation
- 12.1.5.1. Company Overview
- 12.1.5.2. Products
- 12.1.5.3. Company Financials
- 12.1.5.4. SWOT Analysis
- 12.1.6 Mitsubishi Electric Corporation
- 12.1.6.1. Company Overview
- 12.1.6.2. Products
- 12.1.6.3. Company Financials
- 12.1.6.4. SWOT Analysis
- 12.1.7 Siemens AG
- 12.1.7.1. Company Overview
- 12.1.7.2. Products
- 12.1.7.3. Company Financials
- 12.1.7.4. SWOT Analysis
- 12.1.8 Schneider Electric SE
- 12.1.8.1. Company Overview
- 12.1.8.2. Products
- 12.1.8.3. Company Financials
- 12.1.8.4. SWOT Analysis
- 12.1.9 Omron Corporation
- 12.1.9.1. Company Overview
- 12.1.9.2. Products
- 12.1.9.3. Company Financials
- 12.1.9.4. SWOT Analysis
- 12.1.10 Sick AG
- 12.1.10.1. Company Overview
- 12.1.10.2. Products
- 12.1.10.3. Company Financials
- 12.1.10.4. SWOT Analysis
- 12.1.11 Pilz GmbH & Co KG
- 12.1.11.1. Company Overview
- 12.1.11.2. Products
- 12.1.11.3. Company Financials
- 12.1.11.4. SWOT Analysis
- 12.1.12 ABB Limited
- 12.1.12.1. Company Overview
- 12.1.12.2. Products
- 12.1.12.3. Company Financials
- 12.1.12.4. SWOT Analysis
- 12.1.1 Rockwell Automation
- 12.2. Market Entropy
- 12.2.1 Company's Key Areas Served
- 12.2.2 Recent Developments
- 12.3. Company Market Share Analysis 2025
- 12.3.1 Top 5 Companies Market Share Analysis
- 12.3.2 Top 3 Companies Market Share Analysis
- 12.4. List of Potential Customers
- 13. Research Methodology
List of Figures
- Figure 1: Global Machine Safety Industry Revenue Breakdown (Million, %) by Region 2025 & 2033
- Figure 2: North America Machine Safety Industry Revenue (Million), by Implementation 2025 & 2033
- Figure 3: North America Machine Safety Industry Revenue Share (%), by Implementation 2025 & 2033
- Figure 4: North America Machine Safety Industry Revenue (Million), by Component 2025 & 2033
- Figure 5: North America Machine Safety Industry Revenue Share (%), by Component 2025 & 2033
- Figure 6: North America Machine Safety Industry Revenue (Million), by End-User 2025 & 2033
- Figure 7: North America Machine Safety Industry Revenue Share (%), by End-User 2025 & 2033
- Figure 8: North America Machine Safety Industry Revenue (Million), by Country 2025 & 2033
- Figure 9: North America Machine Safety Industry Revenue Share (%), by Country 2025 & 2033
- Figure 10: Europe Machine Safety Industry Revenue (Million), by Implementation 2025 & 2033
- Figure 11: Europe Machine Safety Industry Revenue Share (%), by Implementation 2025 & 2033
- Figure 12: Europe Machine Safety Industry Revenue (Million), by Component 2025 & 2033
- Figure 13: Europe Machine Safety Industry Revenue Share (%), by Component 2025 & 2033
- Figure 14: Europe Machine Safety Industry Revenue (Million), by End-User 2025 & 2033
- Figure 15: Europe Machine Safety Industry Revenue Share (%), by End-User 2025 & 2033
- Figure 16: Europe Machine Safety Industry Revenue (Million), by Country 2025 & 2033
- Figure 17: Europe Machine Safety Industry Revenue Share (%), by Country 2025 & 2033
- Figure 18: Asia Pacific Machine Safety Industry Revenue (Million), by Implementation 2025 & 2033
- Figure 19: Asia Pacific Machine Safety Industry Revenue Share (%), by Implementation 2025 & 2033
- Figure 20: Asia Pacific Machine Safety Industry Revenue (Million), by Component 2025 & 2033
- Figure 21: Asia Pacific Machine Safety Industry Revenue Share (%), by Component 2025 & 2033
- Figure 22: Asia Pacific Machine Safety Industry Revenue (Million), by End-User 2025 & 2033
- Figure 23: Asia Pacific Machine Safety Industry Revenue Share (%), by End-User 2025 & 2033
- Figure 24: Asia Pacific Machine Safety Industry Revenue (Million), by Country 2025 & 2033
- Figure 25: Asia Pacific Machine Safety Industry Revenue Share (%), by Country 2025 & 2033
- Figure 26: Latin America Machine Safety Industry Revenue (Million), by Implementation 2025 & 2033
- Figure 27: Latin America Machine Safety Industry Revenue Share (%), by Implementation 2025 & 2033
- Figure 28: Latin America Machine Safety Industry Revenue (Million), by Component 2025 & 2033
- Figure 29: Latin America Machine Safety Industry Revenue Share (%), by Component 2025 & 2033
- Figure 30: Latin America Machine Safety Industry Revenue (Million), by End-User 2025 & 2033
- Figure 31: Latin America Machine Safety Industry Revenue Share (%), by End-User 2025 & 2033
- Figure 32: Latin America Machine Safety Industry Revenue (Million), by Country 2025 & 2033
- Figure 33: Latin America Machine Safety Industry Revenue Share (%), by Country 2025 & 2033
- Figure 34: Middle East and Africa Machine Safety Industry Revenue (Million), by Implementation 2025 & 2033
- Figure 35: Middle East and Africa Machine Safety Industry Revenue Share (%), by Implementation 2025 & 2033
- Figure 36: Middle East and Africa Machine Safety Industry Revenue (Million), by Component 2025 & 2033
- Figure 37: Middle East and Africa Machine Safety Industry Revenue Share (%), by Component 2025 & 2033
- Figure 38: Middle East and Africa Machine Safety Industry Revenue (Million), by End-User 2025 & 2033
- Figure 39: Middle East and Africa Machine Safety Industry Revenue Share (%), by End-User 2025 & 2033
- Figure 40: Middle East and Africa Machine Safety Industry Revenue (Million), by Country 2025 & 2033
- Figure 41: Middle East and Africa Machine Safety Industry Revenue Share (%), by Country 2025 & 2033
List of Tables
- Table 1: Global Machine Safety Industry Revenue Million Forecast, by Implementation 2020 & 2033
- Table 2: Global Machine Safety Industry Revenue Million Forecast, by Component 2020 & 2033
- Table 3: Global Machine Safety Industry Revenue Million Forecast, by End-User 2020 & 2033
- Table 4: Global Machine Safety Industry Revenue Million Forecast, by Region 2020 & 2033
- Table 5: Global Machine Safety Industry Revenue Million Forecast, by Implementation 2020 & 2033
- Table 6: Global Machine Safety Industry Revenue Million Forecast, by Component 2020 & 2033
- Table 7: Global Machine Safety Industry Revenue Million Forecast, by End-User 2020 & 2033
- Table 8: Global Machine Safety Industry Revenue Million Forecast, by Country 2020 & 2033
- Table 9: Global Machine Safety Industry Revenue Million Forecast, by Implementation 2020 & 2033
- Table 10: Global Machine Safety Industry Revenue Million Forecast, by Component 2020 & 2033
- Table 11: Global Machine Safety Industry Revenue Million Forecast, by End-User 2020 & 2033
- Table 12: Global Machine Safety Industry Revenue Million Forecast, by Country 2020 & 2033
- Table 13: Global Machine Safety Industry Revenue Million Forecast, by Implementation 2020 & 2033
- Table 14: Global Machine Safety Industry Revenue Million Forecast, by Component 2020 & 2033
- Table 15: Global Machine Safety Industry Revenue Million Forecast, by End-User 2020 & 2033
- Table 16: Global Machine Safety Industry Revenue Million Forecast, by Country 2020 & 2033
- Table 17: Global Machine Safety Industry Revenue Million Forecast, by Implementation 2020 & 2033
- Table 18: Global Machine Safety Industry Revenue Million Forecast, by Component 2020 & 2033
- Table 19: Global Machine Safety Industry Revenue Million Forecast, by End-User 2020 & 2033
- Table 20: Global Machine Safety Industry Revenue Million Forecast, by Country 2020 & 2033
- Table 21: Global Machine Safety Industry Revenue Million Forecast, by Implementation 2020 & 2033
- Table 22: Global Machine Safety Industry Revenue Million Forecast, by Component 2020 & 2033
- Table 23: Global Machine Safety Industry Revenue Million Forecast, by End-User 2020 & 2033
- Table 24: Global Machine Safety Industry Revenue Million Forecast, by Country 2020 & 2033
Frequently Asked Questions
1. What is the projected Compound Annual Growth Rate (CAGR) of the Machine Safety Industry?
The projected CAGR is approximately 9.97%.
2. Which companies are prominent players in the Machine Safety Industry?
Key companies in the market include Rockwell Automation, Honeywell International Inc, Keyence Corporation, Banner Engineerin, IDEC Corporation, Mitsubishi Electric Corporation, Siemens AG, Schneider Electric SE, Omron Corporation, Sick AG, Pilz GmbH & Co KG, ABB Limited.
3. What are the main segments of the Machine Safety Industry?
The market segments include Implementation, Component, End-User.
4. Can you provide details about the market size?
The market size is estimated to be USD 5.07 Million as of 2022.
5. What are some drivers contributing to market growth?
Increasing Number of Industrial Accidents; Stringent Government Regulations and Mandatory Safety Standards.
6. What are the notable trends driving market growth?
Oil and Gas Industry to Hold a Significant Share.
7. Are there any restraints impacting market growth?
Additional Costs Associated with Machine Safety Systems.
8. Can you provide examples of recent developments in the market?
October 2021 - Pilz launched a new safe radar sensor, PSENradar, for safe protection zone monitoring in rugged conditions such as dust, dirt, rain, light, sparks, or vibrations. The sensor can be used along with the configurable small controller PNOZmulti 2, offering an optimum solution. In addition to outdoor applications and areas in woodworking and metalworking. It also makes it possible to safeguard robot applications because the solution achieves a higher category.
9. What pricing options are available for accessing the report?
Pricing options include single-user, multi-user, and enterprise licenses priced at USD 4750, USD 5250, and USD 8750 respectively.
10. Is the market size provided in terms of value or volume?
The market size is provided in terms of value, measured in Million.
11. Are there any specific market keywords associated with the report?
Yes, the market keyword associated with the report is "Machine Safety Industry," which aids in identifying and referencing the specific market segment covered.
12. How do I determine which pricing option suits my needs best?
The pricing options vary based on user requirements and access needs. Individual users may opt for single-user licenses, while businesses requiring broader access may choose multi-user or enterprise licenses for cost-effective access to the report.
13. Are there any additional resources or data provided in the Machine Safety Industry report?
While the report offers comprehensive insights, it's advisable to review the specific contents or supplementary materials provided to ascertain if additional resources or data are available.
14. How can I stay updated on further developments or reports in the Machine Safety Industry?
To stay informed about further developments, trends, and reports in the Machine Safety Industry, consider subscribing to industry newsletters, following relevant companies and organizations, or regularly checking reputable industry news sources and publications.
Methodology
Step 1 - Identification of Relevant Samples Size from Population Database


Step 2 - Approaches for Defining Global Market Size (Value, Volume* & Price*)

Note*: In applicable scenarios
Step 3 - Data Sources
Primary Research
- Web Analytics
- Survey Reports
- Research Institute
- Latest Research Reports
- Opinion Leaders
Secondary Research
- Annual Reports
- White Paper
- Latest Press Release
- Industry Association
- Paid Database
- Investor Presentations

Step 4 - Data Triangulation
Involves using different sources of information in order to increase the validity of a study
These sources are likely to be stakeholders in a program - participants, other researchers, program staff, other community members, and so on.
Then we put all data in single framework & apply various statistical tools to find out the dynamic on the market.
During the analysis stage, feedback from the stakeholder groups would be compared to determine areas of agreement as well as areas of divergence