

Key Insights
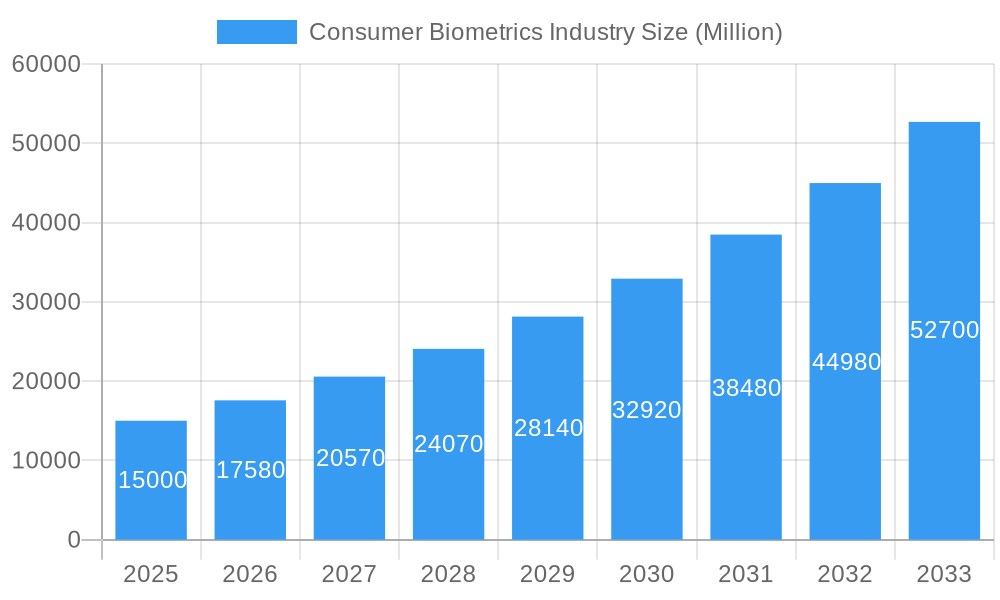
The global consumer biometrics market is projected to achieve significant expansion, reaching an estimated 53.22 billion by 2025 and exhibiting a compound annual growth rate (CAGR) of 12.3% through 2033. This growth is propelled by escalating demand for advanced security and user convenience across consumer devices and applications. The widespread integration of fingerprint and facial recognition in smartphones and tablets, enabling seamless access and secure transactions, is a key driver. The expanding Internet of Things (IoT) ecosystem, encompassing smart homes, wearables, and connected vehicles, further fuels this trend by incorporating biometric solutions for personalized and secure user experiences. The automotive sector's increasing adoption of biometrics for driver identification and vehicle customization also contributes substantially to market growth.
Consumer Biometrics Industry Market Size (In Billion)
Technological advancements in sensing modules, including improved fingerprint, facial, and iris recognition technologies, underpin the market's dynamic growth. These innovations enhance accuracy, speed, and sensor compactness, facilitating cost-effective biometric integration across a broader device spectrum. Leading companies like Apple Inc., Qualcomm Incorporated, and STMicroelectronics NV are spearheading the development and deployment of these advanced solutions. While the market shows a strong upward trajectory, potential challenges may arise from data privacy concerns and implementation costs in specific niche applications. Nevertheless, the inherent benefits of superior security and user-centric experiences are expected to drive sustained and substantial market growth.
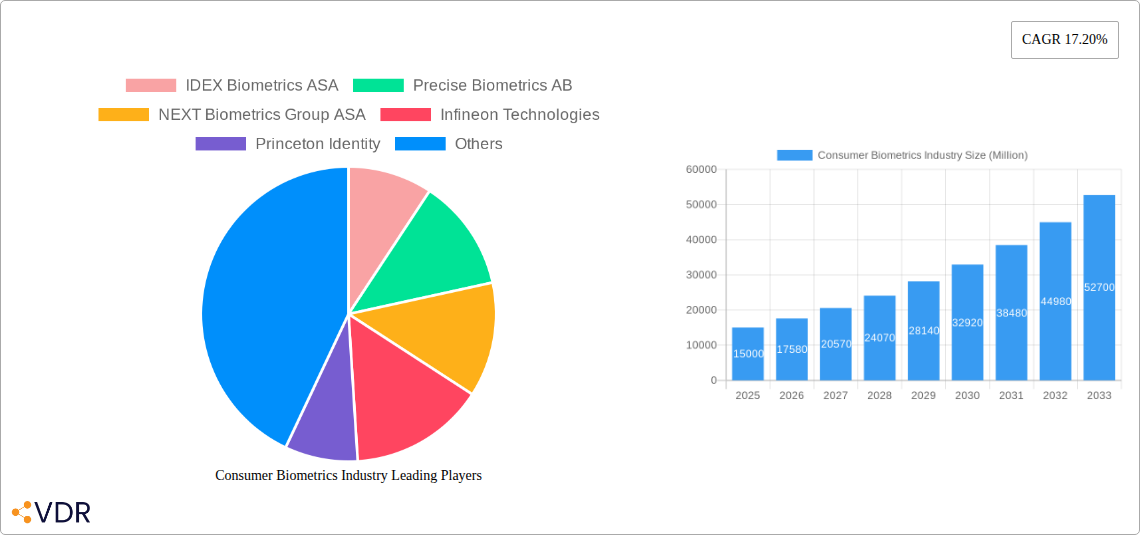
Consumer Biometrics Industry Company Market Share
Consumer Biometrics Market Analysis: Enhancing Security and Convenience in the Digital Age
This report delivers a comprehensive analysis of the global Consumer Biometrics industry, detailing market dynamics, growth trajectories, regional leadership, product segmentation, key drivers, challenges, emerging opportunities, and prominent players. Covering the period from 2019 to 2033, with a base year of 2025 and a forecast period of 2025–2033, this study offers crucial insights for industry professionals, investors, and stakeholders navigating this evolving market. Market values are presented in billions of units.
Consumer Biometrics Industry Market Dynamics & Structure
The consumer biometrics market exhibits a moderately concentrated structure, with a few key players holding significant market share, particularly in fingerprint and facial recognition technologies. Technological innovation remains the paramount driver, fueled by advancements in sensor technology, AI-powered algorithms for improved accuracy, and the increasing demand for seamless, secure authentication across a multitude of consumer devices. Regulatory frameworks are evolving, with data privacy laws such as GDPR and CCPA influencing the adoption and implementation of biometric solutions, emphasizing the need for secure data handling and user consent. Competitive product substitutes, while present in traditional authentication methods (PINs, passwords), are progressively being displaced by the convenience and enhanced security offered by biometrics. End-user demographics are shifting towards a younger, tech-savvy population that embraces biometric authentication as a standard for device access and transactions. Mergers and acquisitions (M&A) are a notable trend, driven by companies seeking to acquire innovative technologies, expand their product portfolios, and gain market access. For instance, over the historical period (2019-2024), there were approximately 15-20 M&A deals aimed at consolidating market presence and integrating advanced biometric capabilities. Barriers to innovation include the high cost of R&D, the need for robust cybersecurity measures to prevent spoofing and data breaches, and the challenge of achieving universal biometric acceptance across diverse populations and use cases.
- Market Concentration: Moderate, with leaders in fingerprint and facial recognition.
- Technological Drivers: Sensor advancements, AI algorithms, demand for convenience and security.
- Regulatory Influence: Evolving data privacy laws (GDPR, CCPA) impact adoption and data handling.
- Competitive Landscape: Biometrics increasingly replacing traditional authentication methods.
- End-User Demographics: Growing adoption by tech-savvy younger generations.
- M&A Trends: Active consolidation to acquire technology and market share (approx. 15-20 deals, 2019-2024).
- Innovation Barriers: R&D costs, cybersecurity threats, universal acceptance challenges.
Consumer Biometrics Industry Growth Trends & Insights
The global consumer biometrics market is poised for substantial growth, driven by the pervasive integration of biometric authentication into everyday devices and applications. The market size is projected to expand significantly, moving from an estimated xx million units in 2024 to an impressive xx million units by 2033. This upward trajectory is underpinned by rapidly increasing adoption rates across all major end-user segments, with smartphones and tablets leading the charge, followed closely by the burgeoning wearables and IoT devices markets. Technological disruptions, such as the miniaturization of sensors, the development of multi-modal biometric systems combining different authentication methods for enhanced security, and advancements in liveness detection to prevent spoofing, are pivotal to this growth. Consumer behavior is shifting demonstrably towards embracing biometrics for its unparalleled combination of security and convenience. Users are increasingly willing to forgo traditional passwords for faster, more intuitive access to their devices, online accounts, and financial transactions. The market penetration of biometric authentication in smartphones alone has surpassed 80% and is expected to climb further.
The rise of smart homes, connected cars, and other IoT ecosystems further amplifies the demand for secure and user-friendly authentication. As these devices proliferate, so too does the need for robust identity verification, making biometrics a natural fit. The average annual growth rate (CAGR) for the consumer biometrics market is estimated to be between 15% and 20% over the forecast period, reflecting its strong momentum. Key metrics such as market penetration in new device categories and the average number of biometric authentications per user per day are expected to see significant increases. The integration of advanced machine learning algorithms for continuous authentication and anomaly detection will also contribute to a more secure and personalized user experience, further driving adoption. Moreover, the increasing affordability of biometric sensors and modules, coupled with the growing awareness of their benefits, are democratizing access to these technologies, making them a standard feature rather than a premium add-on. The convergence of biometrics with other emerging technologies like blockchain for secure digital identity management also presents a substantial growth avenue, promising to revolutionize how consumers interact with the digital world.
Dominant Regions, Countries, or Segments in Consumer Biometrics Industry
The Smartphone/Tablet segment within end-users stands as the dominant force driving growth in the global consumer biometrics industry. This dominance is characterized by widespread adoption, significant market share, and continuous innovation in incorporating advanced biometric features. Fingerprint recognition, as a sensing module, initially pioneered this widespread integration and continues to hold a substantial share due to its established presence and cost-effectiveness. However, Face Recognition is rapidly gaining ground, particularly with the advent of sophisticated 3D facial scanning technologies, offering enhanced security and user experience.
North America and Asia-Pacific are emerging as the leading regions, propelled by their robust technological ecosystems, high disposable incomes, and a consumer base that readily embraces new technologies. In North America, stringent data security regulations and a strong emphasis on consumer privacy are pushing for more secure authentication methods, making biometrics a preferred choice. The region benefits from a high concentration of leading technology companies and significant R&D investments, fostering rapid product development and adoption.
Asia-Pacific, particularly countries like China and South Korea, is witnessing explosive growth due to the sheer volume of smartphone users, rapid urbanization, and a burgeoning middle class with increasing purchasing power. Governments in these regions are also actively promoting the use of digital technologies, including biometrics, for secure identification and payment systems. The presence of major manufacturing hubs for electronic devices further fuels the demand and supply of biometric components.
The Automotive segment is also a significant growth accelerator, with biometric authentication being increasingly integrated for driver identification, personalized settings, and in-car payments. While still in its nascent stages compared to smartphones, the potential for biometric penetration in the automotive sector is immense, driven by the trend towards connected and autonomous vehicles.
Key drivers of dominance in the Smartphone/Tablet segment include:
- Ubiquitous Integration: Biometric sensors are now standard in almost every new smartphone and tablet model.
- Consumer Demand: Users prioritize convenience and enhanced security for device access and financial transactions.
- Technological Advancements: Continuous improvements in sensor accuracy, speed, and liveness detection.
- Ecosystem Support: Growing integration with mobile payment systems, app authentication, and secure online services.
- Competitive Landscape: Intense competition among smartphone manufacturers to offer superior biometric solutions as a key differentiator.
The continued innovation in Fingerprint and Face Recognition technologies, coupled with the expanding adoption across Automotive and Wearables, will ensure the sustained growth and dominance of these segments within the broader consumer biometrics market.
Consumer Biometrics Industry Product Landscape
The consumer biometrics product landscape is characterized by a rapid evolution of innovative sensing modules and integrated solutions designed for seamless user authentication. Fingerprint sensors, including capacitive, optical, and ultrasonic variants, continue to be refined for enhanced speed, accuracy, and under-display integration, offering a discreet yet effective security layer. Face recognition modules are witnessing significant advancements with the incorporation of 3D depth sensing and AI-powered algorithms, providing robust security against spoofing and enabling more natural user interaction. Eye/Iris recognition, while less mainstream, is emerging in niche applications for its high accuracy and contactless nature. These technologies are being embedded across a diverse range of end-user devices, from smartphones and tablets to laptops, wearables, and automotive infotainment systems. Unique selling propositions revolve around improved performance metrics such as lower false acceptance rates (FAR) and false rejection rates (FRR), faster scan times, and reduced power consumption. The focus is on creating biometric solutions that are not only secure but also intuitive and invisible to the user, thus enhancing the overall digital experience.
Key Drivers, Barriers & Challenges in Consumer Biometrics Industry
Key Drivers:
The consumer biometrics industry is propelled by an insatiable demand for enhanced security and convenience in digital interactions. The widespread adoption of smartphones and the proliferation of connected devices create a fertile ground for biometric authentication. Technological advancements, particularly in AI and sensor technology, are driving down costs and improving the accuracy and speed of biometric systems, making them more accessible and appealing to consumers. Growing consumer awareness and acceptance of biometrics as a superior alternative to passwords and PINs, coupled with increasing concerns over data breaches and identity theft, further accelerate market growth. Furthermore, regulatory mandates and industry standards promoting secure authentication are also significant drivers.
Key Barriers & Challenges:
Despite its robust growth, the industry faces several challenges. Privacy concerns and data security remain paramount, with consumers wary of how their biometric data is collected, stored, and used. Regulatory hurdles, though often drivers, can also pose challenges due to varying compliance requirements across different regions and the evolving nature of data protection laws. The potential for biometric spoofing and the development of sophisticated fakes pose an ongoing technical challenge, requiring continuous innovation in liveness detection and anti-spoofing measures. High initial development and integration costs for manufacturers, especially for new biometric modalities, can also act as a restraint. Furthermore, ensuring universal accuracy and acceptance across diverse demographics and environmental conditions (e.g., varying lighting for facial recognition, wet fingers for fingerprint scans) remains an ongoing technical and practical challenge. The supply chain for specialized biometric components can also be vulnerable to disruptions.
Emerging Opportunities in Consumer Biometrics Industry
Emerging opportunities in the consumer biometrics industry lie in the expansion of biometric authentication into nascent and rapidly growing markets. The automotive sector presents a significant untapped market, with opportunities for in-car driver identification, personalized settings, and secure in-vehicle payments. The smart home ecosystem, encompassing everything from smart locks to connected appliances, offers a vast landscape for biometric integration, enhancing security and user convenience. Furthermore, the development of multi-modal biometric systems, combining fingerprint, facial, voice, and behavioral biometrics, offers a pathway to significantly enhanced security and a more seamless user experience. The integration of biometrics with blockchain technology for secure digital identity management and decentralized applications is another promising avenue. Evolving consumer preferences for contactless authentication, accelerated by recent global health events, will continue to drive demand for technologies like iris and vein recognition.
Growth Accelerators in the Consumer Biometrics Industry Industry
Several key factors are accelerating the long-term growth of the consumer biometrics industry. Continuous technological breakthroughs in sensor miniaturization, power efficiency, and AI-driven pattern recognition are making biometric solutions more viable and cost-effective for a wider range of devices. Strategic partnerships between biometric technology providers, device manufacturers, and software developers are crucial for seamless integration and broader market penetration. For instance, collaborations leading to the widespread availability of advanced fingerprint sensors embedded under smartphone displays are a testament to this accelerator. Market expansion strategies, including the development of specialized biometric solutions for emerging markets and niche applications like gaming peripherals and access control for shared devices, are also contributing to sustained growth. The increasing standardization of biometric protocols and interfaces will further streamline adoption and interoperability across different platforms and devices.
Key Players Shaping the Consumer Biometrics Industry Market
- IDEX Biometrics ASA
- Precise Biometrics AB
- NEXT Biometrics Group ASA
- Infineon Technologies
- Princeton Identity
- Omnivision Technologies
- Egis Technologies Inc
- STMicroelectronics NV
- Qualcomm Incorporated
- ON Semiconductor
- Synaptics Inc
- LG Innotek Co Ltd
- Idemia France SAS
- Knowles Electronics LLC
- Apple Inc
- Shenzhen Goodix Technology Co Ltd
- Assa Abloy AB
Notable Milestones in Consumer Biometrics Industry Sector
- 2019: Introduction of advanced under-display ultrasonic fingerprint sensors in flagship smartphones.
- 2020: Increased adoption of facial recognition technology in smartphones, with enhanced 3D sensing capabilities.
- 2021: Rise in contactless biometric solutions driven by public health concerns.
- 2021: Major advancements in AI algorithms for improved liveness detection and spoofing prevention.
- 2022: Expansion of fingerprint and facial recognition into mid-range and budget smartphone models.
- 2022: Growing integration of biometrics in wearable devices for fitness tracking and payments.
- 2023: Significant investments in research and development for multi-modal biometric systems.
- 2023: Increased adoption of voice and behavioral biometrics for continuous authentication in mobile applications.
- 2024: Emergence of biometric authentication in connected car systems for driver recognition.
- 2024: Continued refinement of iris and vein recognition technologies for niche secure applications.
In-Depth Consumer Biometrics Industry Market Outlook
The future of the consumer biometrics industry is exceptionally bright, driven by continuous technological innovation and an ever-increasing consumer demand for secure, convenient, and seamless authentication. Growth accelerators such as the ubiquitous integration of advanced sensors into all manner of connected devices, coupled with the development of more sophisticated AI-powered algorithms, will fuel market expansion. Strategic partnerships between technology providers and device manufacturers will pave the way for broader adoption and enhanced user experiences. The market is expected to witness further consolidation through strategic acquisitions, as larger players seek to bolster their biometric portfolios. Emerging opportunities in the automotive and smart home sectors, alongside the potential of multi-modal biometrics and blockchain integration, represent significant avenues for future growth and innovation, ensuring that biometrics will remain a cornerstone of digital security and user interaction.
Consumer Biometrics Industry Segmentation
-
1. Sensing Module
- 1.1. Fingerprint
- 1.2. Face Recognition
- 1.3. Eye/Iris Recognition
-
2. End Users
- 2.1. Automotive
- 2.2. Smartphone/Tablet
- 2.3. Pc/Laptop
- 2.4. Wearables
- 2.5. IoT Devices
- 2.6. Other End Users
Consumer Biometrics Industry Segmentation By Geography
- 1. North America: United States Canada Mexico
- 2. Europe: Germany: France: Italy: United Kingdom Netherlands Rest of Europe
- 3. Asia Pacific: China, Japan, India, South Korea, Taiwan, Australia, Rest of Asia-Pacific
- 4. South America : Brazil, Argentina, Rest of South America
- 5. MEA: Middle East, Africa
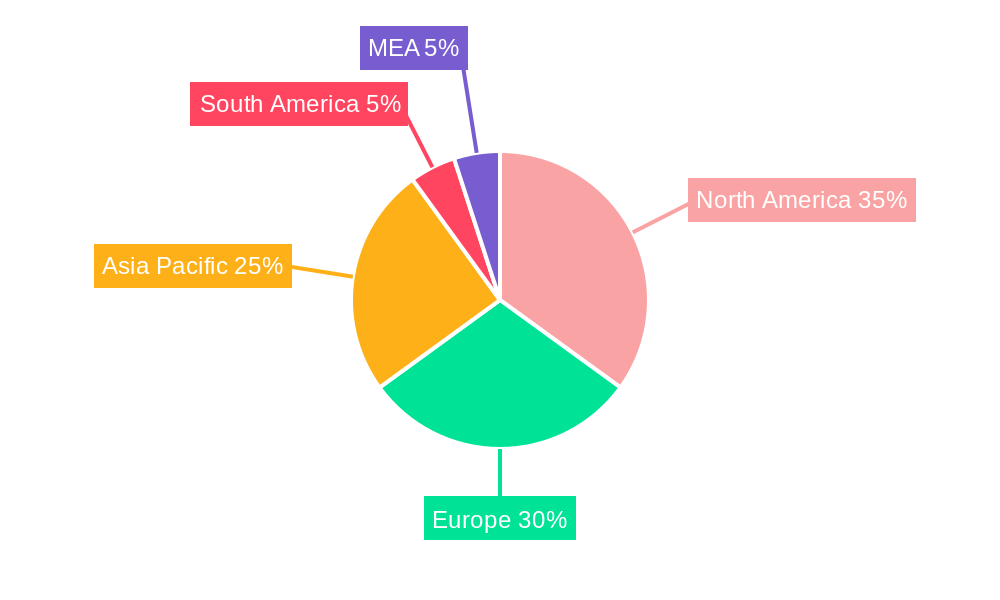
Consumer Biometrics Industry Regional Market Share
Geographic Coverage of Consumer Biometrics Industry
Consumer Biometrics Industry REPORT HIGHLIGHTS
| Aspects | Details |
|---|---|
| Study Period | 2020-2034 |
| Base Year | 2025 |
| Estimated Year | 2026 |
| Forecast Period | 2026-2034 |
| Historical Period | 2020-2025 |
| Growth Rate | CAGR of 12.3% from 2020-2034 |
| Segmentation |
|
Table of Contents
- 1. Introduction
- 1.1. Research Scope
- 1.2. Market Segmentation
- 1.3. Research Objective
- 1.4. Definitions and Assumptions
- 2. Executive Summary
- 2.1. Market Snapshot
- 3. Market Dynamics
- 3.1. Market Drivers
- 3.2. Market Restrains
- 3.3. Market Trends
- 3.4. Market Opportunities
- 4. Market Factor Analysis
- 4.1. Porters Five Forces
- 4.1.1. Bargaining Power of Suppliers
- 4.1.2. Bargaining Power of Buyers
- 4.1.3. Threat of New Entrants
- 4.1.4. Threat of Substitutes
- 4.1.5. Competitive Rivalry
- 4.2. PESTEL analysis
- 4.3. BCG Analysis
- 4.3.1. Stars (High Growth, High Market Share)
- 4.3.2. Cash Cows (Low Growth, High Market Share)
- 4.3.3. Question Mark (High Growth, Low Market Share)
- 4.3.4. Dogs (Low Growth, Low Market Share)
- 4.4. Ansoff Matrix Analysis
- 4.5. Supply Chain Analysis
- 4.6. Regulatory Landscape
- 4.7. Current Market Potential and Opportunity Assessment (TAM–SAM–SOM Framework)
- 4.8. VDR Analyst Note
- 4.1. Porters Five Forces
- 5. Market Analysis, Insights and Forecast 2021-2033
- 5.1. Market Analysis, Insights and Forecast - by Sensing Module
- 5.1.1. Fingerprint
- 5.1.2. Face Recognition
- 5.1.3. Eye/Iris Recognition
- 5.2. Market Analysis, Insights and Forecast - by End Users
- 5.2.1. Automotive
- 5.2.2. Smartphone/Tablet
- 5.2.3. Pc/Laptop
- 5.2.4. Wearables
- 5.2.5. IoT Devices
- 5.2.6. Other End Users
- 5.3. Market Analysis, Insights and Forecast - by Region
- 5.3.1. North America: United States Canada Mexico
- 5.3.2. Europe: Germany: France: Italy: United Kingdom Netherlands Rest of Europe
- 5.3.3. Asia Pacific: China, Japan, India, South Korea, Taiwan, Australia, Rest of Asia-Pacific
- 5.3.4. South America : Brazil, Argentina, Rest of South America
- 5.3.5. MEA: Middle East, Africa
- 5.1. Market Analysis, Insights and Forecast - by Sensing Module
- 6. Global Consumer Biometrics Industry Analysis, Insights and Forecast, 2021-2033
- 6.1. Market Analysis, Insights and Forecast - by Sensing Module
- 6.1.1. Fingerprint
- 6.1.2. Face Recognition
- 6.1.3. Eye/Iris Recognition
- 6.2. Market Analysis, Insights and Forecast - by End Users
- 6.2.1. Automotive
- 6.2.2. Smartphone/Tablet
- 6.2.3. Pc/Laptop
- 6.2.4. Wearables
- 6.2.5. IoT Devices
- 6.2.6. Other End Users
- 6.1. Market Analysis, Insights and Forecast - by Sensing Module
- 7. North America: United States Canada Mexico Consumer Biometrics Industry Analysis, Insights and Forecast, 2021-2033
- 7.1. Market Analysis, Insights and Forecast - by Sensing Module
- 7.1.1. Fingerprint
- 7.1.2. Face Recognition
- 7.1.3. Eye/Iris Recognition
- 7.2. Market Analysis, Insights and Forecast - by End Users
- 7.2.1. Automotive
- 7.2.2. Smartphone/Tablet
- 7.2.3. Pc/Laptop
- 7.2.4. Wearables
- 7.2.5. IoT Devices
- 7.2.6. Other End Users
- 7.1. Market Analysis, Insights and Forecast - by Sensing Module
- 8. Europe: Germany: France: Italy: United Kingdom Netherlands Rest of Europe Consumer Biometrics Industry Analysis, Insights and Forecast, 2021-2033
- 8.1. Market Analysis, Insights and Forecast - by Sensing Module
- 8.1.1. Fingerprint
- 8.1.2. Face Recognition
- 8.1.3. Eye/Iris Recognition
- 8.2. Market Analysis, Insights and Forecast - by End Users
- 8.2.1. Automotive
- 8.2.2. Smartphone/Tablet
- 8.2.3. Pc/Laptop
- 8.2.4. Wearables
- 8.2.5. IoT Devices
- 8.2.6. Other End Users
- 8.1. Market Analysis, Insights and Forecast - by Sensing Module
- 9. Asia Pacific: China, Japan, India, South Korea, Taiwan, Australia, Rest of Asia-Pacific Consumer Biometrics Industry Analysis, Insights and Forecast, 2021-2033
- 9.1. Market Analysis, Insights and Forecast - by Sensing Module
- 9.1.1. Fingerprint
- 9.1.2. Face Recognition
- 9.1.3. Eye/Iris Recognition
- 9.2. Market Analysis, Insights and Forecast - by End Users
- 9.2.1. Automotive
- 9.2.2. Smartphone/Tablet
- 9.2.3. Pc/Laptop
- 9.2.4. Wearables
- 9.2.5. IoT Devices
- 9.2.6. Other End Users
- 9.1. Market Analysis, Insights and Forecast - by Sensing Module
- 10. South America : Brazil, Argentina, Rest of South America Consumer Biometrics Industry Analysis, Insights and Forecast, 2021-2033
- 10.1. Market Analysis, Insights and Forecast - by Sensing Module
- 10.1.1. Fingerprint
- 10.1.2. Face Recognition
- 10.1.3. Eye/Iris Recognition
- 10.2. Market Analysis, Insights and Forecast - by End Users
- 10.2.1. Automotive
- 10.2.2. Smartphone/Tablet
- 10.2.3. Pc/Laptop
- 10.2.4. Wearables
- 10.2.5. IoT Devices
- 10.2.6. Other End Users
- 10.1. Market Analysis, Insights and Forecast - by Sensing Module
- 11. MEA: Middle East, Africa Consumer Biometrics Industry Analysis, Insights and Forecast, 2021-2033
- 11.1. Market Analysis, Insights and Forecast - by Sensing Module
- 11.1.1. Fingerprint
- 11.1.2. Face Recognition
- 11.1.3. Eye/Iris Recognition
- 11.2. Market Analysis, Insights and Forecast - by End Users
- 11.2.1. Automotive
- 11.2.2. Smartphone/Tablet
- 11.2.3. Pc/Laptop
- 11.2.4. Wearables
- 11.2.5. IoT Devices
- 11.2.6. Other End Users
- 11.1. Market Analysis, Insights and Forecast - by Sensing Module
- 12. Competitive Analysis
- 12.1. Company Profiles
- 12.1.1 IDEX Biometrics ASA
- 12.1.1.1. Company Overview
- 12.1.1.2. Products
- 12.1.1.3. Company Financials
- 12.1.1.4. SWOT Analysis
- 12.1.2 Precise Biometrics AB
- 12.1.2.1. Company Overview
- 12.1.2.2. Products
- 12.1.2.3. Company Financials
- 12.1.2.4. SWOT Analysis
- 12.1.3 NEXT Biometrics Group ASA
- 12.1.3.1. Company Overview
- 12.1.3.2. Products
- 12.1.3.3. Company Financials
- 12.1.3.4. SWOT Analysis
- 12.1.4 Infineon Technologies
- 12.1.4.1. Company Overview
- 12.1.4.2. Products
- 12.1.4.3. Company Financials
- 12.1.4.4. SWOT Analysis
- 12.1.5 Princeton Identity
- 12.1.5.1. Company Overview
- 12.1.5.2. Products
- 12.1.5.3. Company Financials
- 12.1.5.4. SWOT Analysis
- 12.1.6 Omnivision Technologies
- 12.1.6.1. Company Overview
- 12.1.6.2. Products
- 12.1.6.3. Company Financials
- 12.1.6.4. SWOT Analysis
- 12.1.7 Egis Technologies Inc
- 12.1.7.1. Company Overview
- 12.1.7.2. Products
- 12.1.7.3. Company Financials
- 12.1.7.4. SWOT Analysis
- 12.1.8 STMicroelectronics NV
- 12.1.8.1. Company Overview
- 12.1.8.2. Products
- 12.1.8.3. Company Financials
- 12.1.8.4. SWOT Analysis
- 12.1.9 Qualcomm Incorporated
- 12.1.9.1. Company Overview
- 12.1.9.2. Products
- 12.1.9.3. Company Financials
- 12.1.9.4. SWOT Analysis
- 12.1.10 ON Semiconductor
- 12.1.10.1. Company Overview
- 12.1.10.2. Products
- 12.1.10.3. Company Financials
- 12.1.10.4. SWOT Analysis
- 12.1.11 Synaptics Inc
- 12.1.11.1. Company Overview
- 12.1.11.2. Products
- 12.1.11.3. Company Financials
- 12.1.11.4. SWOT Analysis
- 12.1.12 LG Innotek Co Ltd
- 12.1.12.1. Company Overview
- 12.1.12.2. Products
- 12.1.12.3. Company Financials
- 12.1.12.4. SWOT Analysis
- 12.1.13 Idemia France SAS
- 12.1.13.1. Company Overview
- 12.1.13.2. Products
- 12.1.13.3. Company Financials
- 12.1.13.4. SWOT Analysis
- 12.1.14 Knowles Electronics LLC
- 12.1.14.1. Company Overview
- 12.1.14.2. Products
- 12.1.14.3. Company Financials
- 12.1.14.4. SWOT Analysis
- 12.1.15 Apple Inc
- 12.1.15.1. Company Overview
- 12.1.15.2. Products
- 12.1.15.3. Company Financials
- 12.1.15.4. SWOT Analysis
- 12.1.16 Shenzhen Goodix Technology Co Ltd
- 12.1.16.1. Company Overview
- 12.1.16.2. Products
- 12.1.16.3. Company Financials
- 12.1.16.4. SWOT Analysis
- 12.1.17 Assa Abloy AB
- 12.1.17.1. Company Overview
- 12.1.17.2. Products
- 12.1.17.3. Company Financials
- 12.1.17.4. SWOT Analysis
- 12.1.1 IDEX Biometrics ASA
- 12.2. Market Entropy
- 12.2.1 Company's Key Areas Served
- 12.2.2 Recent Developments
- 12.3. Company Market Share Analysis 2025
- 12.3.1 Top 5 Companies Market Share Analysis
- 12.3.2 Top 3 Companies Market Share Analysis
- 12.4. List of Potential Customers
- 13. Research Methodology
List of Figures
- Figure 1: Global Consumer Biometrics Industry Revenue Breakdown (billion, %) by Region 2025 & 2033
- Figure 2: North America: United States Canada Mexico Consumer Biometrics Industry Revenue (billion), by Sensing Module 2025 & 2033
- Figure 3: North America: United States Canada Mexico Consumer Biometrics Industry Revenue Share (%), by Sensing Module 2025 & 2033
- Figure 4: North America: United States Canada Mexico Consumer Biometrics Industry Revenue (billion), by End Users 2025 & 2033
- Figure 5: North America: United States Canada Mexico Consumer Biometrics Industry Revenue Share (%), by End Users 2025 & 2033
- Figure 6: North America: United States Canada Mexico Consumer Biometrics Industry Revenue (billion), by Country 2025 & 2033
- Figure 7: North America: United States Canada Mexico Consumer Biometrics Industry Revenue Share (%), by Country 2025 & 2033
- Figure 8: Europe: Germany: France: Italy: United Kingdom Netherlands Rest of Europe Consumer Biometrics Industry Revenue (billion), by Sensing Module 2025 & 2033
- Figure 9: Europe: Germany: France: Italy: United Kingdom Netherlands Rest of Europe Consumer Biometrics Industry Revenue Share (%), by Sensing Module 2025 & 2033
- Figure 10: Europe: Germany: France: Italy: United Kingdom Netherlands Rest of Europe Consumer Biometrics Industry Revenue (billion), by End Users 2025 & 2033
- Figure 11: Europe: Germany: France: Italy: United Kingdom Netherlands Rest of Europe Consumer Biometrics Industry Revenue Share (%), by End Users 2025 & 2033
- Figure 12: Europe: Germany: France: Italy: United Kingdom Netherlands Rest of Europe Consumer Biometrics Industry Revenue (billion), by Country 2025 & 2033
- Figure 13: Europe: Germany: France: Italy: United Kingdom Netherlands Rest of Europe Consumer Biometrics Industry Revenue Share (%), by Country 2025 & 2033
- Figure 14: Asia Pacific: China, Japan, India, South Korea, Taiwan, Australia, Rest of Asia-Pacific Consumer Biometrics Industry Revenue (billion), by Sensing Module 2025 & 2033
- Figure 15: Asia Pacific: China, Japan, India, South Korea, Taiwan, Australia, Rest of Asia-Pacific Consumer Biometrics Industry Revenue Share (%), by Sensing Module 2025 & 2033
- Figure 16: Asia Pacific: China, Japan, India, South Korea, Taiwan, Australia, Rest of Asia-Pacific Consumer Biometrics Industry Revenue (billion), by End Users 2025 & 2033
- Figure 17: Asia Pacific: China, Japan, India, South Korea, Taiwan, Australia, Rest of Asia-Pacific Consumer Biometrics Industry Revenue Share (%), by End Users 2025 & 2033
- Figure 18: Asia Pacific: China, Japan, India, South Korea, Taiwan, Australia, Rest of Asia-Pacific Consumer Biometrics Industry Revenue (billion), by Country 2025 & 2033
- Figure 19: Asia Pacific: China, Japan, India, South Korea, Taiwan, Australia, Rest of Asia-Pacific Consumer Biometrics Industry Revenue Share (%), by Country 2025 & 2033
- Figure 20: South America : Brazil, Argentina, Rest of South America Consumer Biometrics Industry Revenue (billion), by Sensing Module 2025 & 2033
- Figure 21: South America : Brazil, Argentina, Rest of South America Consumer Biometrics Industry Revenue Share (%), by Sensing Module 2025 & 2033
- Figure 22: South America : Brazil, Argentina, Rest of South America Consumer Biometrics Industry Revenue (billion), by End Users 2025 & 2033
- Figure 23: South America : Brazil, Argentina, Rest of South America Consumer Biometrics Industry Revenue Share (%), by End Users 2025 & 2033
- Figure 24: South America : Brazil, Argentina, Rest of South America Consumer Biometrics Industry Revenue (billion), by Country 2025 & 2033
- Figure 25: South America : Brazil, Argentina, Rest of South America Consumer Biometrics Industry Revenue Share (%), by Country 2025 & 2033
- Figure 26: MEA: Middle East, Africa Consumer Biometrics Industry Revenue (billion), by Sensing Module 2025 & 2033
- Figure 27: MEA: Middle East, Africa Consumer Biometrics Industry Revenue Share (%), by Sensing Module 2025 & 2033
- Figure 28: MEA: Middle East, Africa Consumer Biometrics Industry Revenue (billion), by End Users 2025 & 2033
- Figure 29: MEA: Middle East, Africa Consumer Biometrics Industry Revenue Share (%), by End Users 2025 & 2033
- Figure 30: MEA: Middle East, Africa Consumer Biometrics Industry Revenue (billion), by Country 2025 & 2033
- Figure 31: MEA: Middle East, Africa Consumer Biometrics Industry Revenue Share (%), by Country 2025 & 2033
List of Tables
- Table 1: Global Consumer Biometrics Industry Revenue billion Forecast, by Sensing Module 2020 & 2033
- Table 2: Global Consumer Biometrics Industry Revenue billion Forecast, by End Users 2020 & 2033
- Table 3: Global Consumer Biometrics Industry Revenue billion Forecast, by Region 2020 & 2033
- Table 4: Global Consumer Biometrics Industry Revenue billion Forecast, by Sensing Module 2020 & 2033
- Table 5: Global Consumer Biometrics Industry Revenue billion Forecast, by End Users 2020 & 2033
- Table 6: Global Consumer Biometrics Industry Revenue billion Forecast, by Country 2020 & 2033
- Table 7: Global Consumer Biometrics Industry Revenue billion Forecast, by Sensing Module 2020 & 2033
- Table 8: Global Consumer Biometrics Industry Revenue billion Forecast, by End Users 2020 & 2033
- Table 9: Global Consumer Biometrics Industry Revenue billion Forecast, by Country 2020 & 2033
- Table 10: Global Consumer Biometrics Industry Revenue billion Forecast, by Sensing Module 2020 & 2033
- Table 11: Global Consumer Biometrics Industry Revenue billion Forecast, by End Users 2020 & 2033
- Table 12: Global Consumer Biometrics Industry Revenue billion Forecast, by Country 2020 & 2033
- Table 13: Global Consumer Biometrics Industry Revenue billion Forecast, by Sensing Module 2020 & 2033
- Table 14: Global Consumer Biometrics Industry Revenue billion Forecast, by End Users 2020 & 2033
- Table 15: Global Consumer Biometrics Industry Revenue billion Forecast, by Country 2020 & 2033
- Table 16: Global Consumer Biometrics Industry Revenue billion Forecast, by Sensing Module 2020 & 2033
- Table 17: Global Consumer Biometrics Industry Revenue billion Forecast, by End Users 2020 & 2033
- Table 18: Global Consumer Biometrics Industry Revenue billion Forecast, by Country 2020 & 2033
Frequently Asked Questions
1. What is the projected Compound Annual Growth Rate (CAGR) of the Consumer Biometrics Industry?
The projected CAGR is approximately 12.3%.
2. Which companies are prominent players in the Consumer Biometrics Industry?
Key companies in the market include IDEX Biometrics ASA, Precise Biometrics AB, NEXT Biometrics Group ASA, Infineon Technologies, Princeton Identity, Omnivision Technologies, Egis Technologies Inc, STMicroelectronics NV, Qualcomm Incorporated, ON Semiconductor, Synaptics Inc, LG Innotek Co Ltd, Idemia France SAS, Knowles Electronics LLC, Apple Inc, Shenzhen Goodix Technology Co Ltd, Assa Abloy AB.
3. What are the main segments of the Consumer Biometrics Industry?
The market segments include Sensing Module, End Users.
4. Can you provide details about the market size?
The market size is estimated to be USD 53.22 billion as of 2022.
5. What are some drivers contributing to market growth?
; Widening Applications of Biometrics; Technological Advancements in Biometrics.
6. What are the notable trends driving market growth?
Fingerprint Sensing Modules to Hold the Major Share.
7. Are there any restraints impacting market growth?
; Data Security and Privacy Concerns.
8. Can you provide examples of recent developments in the market?
N/A
9. What pricing options are available for accessing the report?
Pricing options include single-user, multi-user, and enterprise licenses priced at USD 4750, USD 5250, and USD 8750 respectively.
10. Is the market size provided in terms of value or volume?
The market size is provided in terms of value, measured in billion.
11. Are there any specific market keywords associated with the report?
Yes, the market keyword associated with the report is "Consumer Biometrics Industry," which aids in identifying and referencing the specific market segment covered.
12. How do I determine which pricing option suits my needs best?
The pricing options vary based on user requirements and access needs. Individual users may opt for single-user licenses, while businesses requiring broader access may choose multi-user or enterprise licenses for cost-effective access to the report.
13. Are there any additional resources or data provided in the Consumer Biometrics Industry report?
While the report offers comprehensive insights, it's advisable to review the specific contents or supplementary materials provided to ascertain if additional resources or data are available.
14. How can I stay updated on further developments or reports in the Consumer Biometrics Industry?
To stay informed about further developments, trends, and reports in the Consumer Biometrics Industry, consider subscribing to industry newsletters, following relevant companies and organizations, or regularly checking reputable industry news sources and publications.
Methodology
Step 1 - Identification of Relevant Samples Size from Population Database


Step 2 - Approaches for Defining Global Market Size (Value, Volume* & Price*)

Note*: In applicable scenarios
Step 3 - Data Sources
Primary Research
- Web Analytics
- Survey Reports
- Research Institute
- Latest Research Reports
- Opinion Leaders
Secondary Research
- Annual Reports
- White Paper
- Latest Press Release
- Industry Association
- Paid Database
- Investor Presentations

Step 4 - Data Triangulation
Involves using different sources of information in order to increase the validity of a study
These sources are likely to be stakeholders in a program - participants, other researchers, program staff, other community members, and so on.
Then we put all data in single framework & apply various statistical tools to find out the dynamic on the market.
During the analysis stage, feedback from the stakeholder groups would be compared to determine areas of agreement as well as areas of divergence