

Key Insights
The global Building Automation market is projected for substantial growth, with an estimated market size of $101.34 billion by 2025. The market is expected to experience a robust Compound Annual Growth Rate (CAGR) of 13.4% during the forecast period of 2025-2033. This expansion is primarily driven by the increasing imperative for energy efficiency and sustainability in both commercial and residential buildings. Escalating energy costs and supportive government regulations for green building practices are compelling building owners and operators to invest in smart technologies for optimizing energy consumption, reducing operational expenses, and minimizing environmental impact. The widespread adoption of IoT devices and advanced analytics further facilitates sophisticated control and monitoring of building systems, enhancing occupant comfort, security, and facility management. The demand for intelligent solutions is accelerating the creation of more responsive, efficient, and occupant-centric built environments.
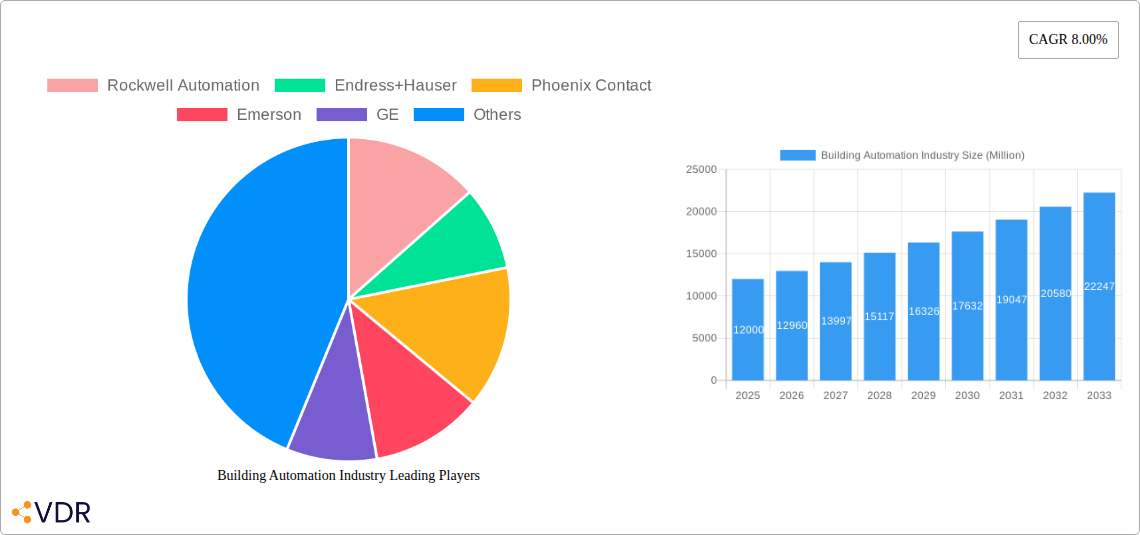
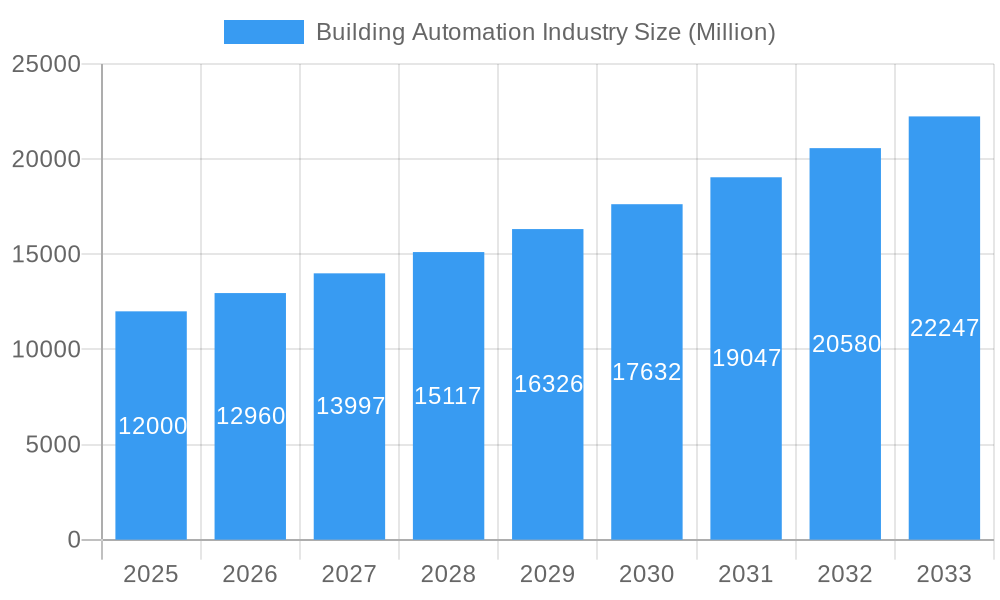
Building Automation Industry Market Size (In Billion)
The market is segmented by product type, encompassing HVAC, Building Management Systems (BMS), Security and Access Control Systems, Energy Management Systems, and Lighting Management Systems. These solutions cater to diverse applications including Multifamily, Office, and Retail spaces. Integrated systems offer a comprehensive approach to building operations, enabling seamless control and data-driven decision-making. Leading companies such as Siemens, Honeywell, Schneider Electric, Rockwell Automation, and Emerson are driving innovation with advanced solutions that utilize artificial intelligence and machine learning to optimize building performance. Geographically, North America and Europe currently lead the market due to early adoption of smart building technologies and strong energy efficiency regulations. However, the Asia Pacific region, particularly China and India, presents a high-growth opportunity, fueled by rapid urbanization, rising disposable incomes, and increasing awareness of smart building benefits.
Building Automation Industry Company Market Share
Building Automation Industry: Comprehensive Market Analysis and Forecast (2019-2033)
This report provides an in-depth analysis of the global Building Automation Industry, encompassing market dynamics, growth trends, regional dominance, product landscape, key drivers, barriers, and emerging opportunities. With a study period spanning from 2019 to 2033, including a base year of 2025 and a forecast period from 2025 to 2033, this report offers a holistic view of market evolution, technological advancements, and strategic insights for industry professionals. Values are presented in Million units for clarity and comparability.
Building Automation Industry Market Dynamics & Structure
The Building Automation Industry is characterized by a moderately concentrated market, driven by rapid technological innovation and increasing demand for energy efficiency and occupant comfort. Key innovation drivers include the integration of Artificial Intelligence (AI) and Machine Learning (ML) for predictive maintenance and optimized energy consumption, the proliferation of the Internet of Things (IoT) for enhanced connectivity and data analytics, and the development of advanced sensor technologies. Regulatory frameworks, such as stringent energy codes and sustainability mandates, further fuel market growth and compel building owners to adopt advanced automation solutions. Competitive product substitutes exist, primarily in the form of standalone building systems, but the integrated approach of comprehensive building automation systems offers superior efficiency and lifecycle cost benefits. End-user demographics are shifting towards a greater awareness of operational costs and environmental impact, with a growing preference for smart and sustainable buildings across residential, commercial, and industrial sectors. Mergers and acquisitions (M&A) are a significant trend, with major players consolidating their market positions and expanding their service portfolios. For instance, recent M&A activities in the historical period (2019-2024) show a volume of approximately 15-25 deals annually, with an average deal value of $50 Million to $200 Million. Barriers to innovation include high initial investment costs for advanced systems and the need for skilled labor to manage complex integrations.
Building Automation Industry Growth Trends & Insights
The Building Automation Industry is poised for robust growth, driven by an escalating global demand for smarter, more energy-efficient, and secure buildings. The market size is projected to grow from an estimated $15,000 Million in 2025 to approximately $30,000 Million by 2033, exhibiting a Compound Annual Growth Rate (CAGR) of xx% during the forecast period. This expansion is fueled by increasing adoption rates of Building Management Systems (BMS), HVAC control systems, and advanced security solutions across various building types. Technological disruptions, such as the convergence of IoT, AI, and cloud computing, are revolutionizing how buildings are managed, enabling real-time monitoring, predictive analytics, and automated decision-making. Consumer behavior is shifting towards a greater emphasis on occupant well-being, productivity, and sustainability, making building automation an essential component for modern infrastructure. The market penetration of smart building technologies is expected to reach xx% by 2033, up from approximately xx% in 2024. The increasing awareness of operational cost savings through optimized energy consumption, reduced maintenance, and enhanced operational efficiency is a primary catalyst for this growth. Furthermore, government incentives and favorable policies promoting green building certifications are also significantly contributing to the upward trajectory of the market. The COVID-19 pandemic also accelerated the adoption of touchless technologies and enhanced air quality monitoring systems, further boosting the demand for intelligent building solutions.
Dominant Regions, Countries, or Segments in Building Automation Industry
North America currently stands as the dominant region in the Building Automation Industry, driven by a strong emphasis on energy efficiency regulations, a mature commercial real estate market, and significant investments in smart city initiatives. The United States, in particular, accounts for a substantial market share, estimated at xx% of the global market in 2025. Key drivers for this dominance include robust economic policies supporting green building construction and retrofitting, coupled with advanced technological adoption. The presence of leading industry players with extensive research and development capabilities further solidifies North America's position.
Product Type Dominance: Within the Product Type segment, Building Management Systems (BMS) are expected to lead market growth, projected to capture xx% of the total market share by 2033. This is attributed to their comprehensive capabilities in integrating and controlling various building sub-systems, offering centralized management and optimization of energy, security, and comfort.
Application Dominance: In terms of application, the Office segment is anticipated to be the largest contributor to market growth, holding an estimated xx% of the market share by 2033. This is due to the increasing demand for intelligent office spaces that prioritize employee productivity, well-being, and energy efficiency, especially in a post-pandemic world.
Key Drivers for Dominance:
- Economic Policies: Favorable government incentives and tax credits for energy-efficient buildings and smart technology adoption in North America.
- Infrastructure: High density of commercial and residential buildings, coupled with ongoing modernization and new construction projects.
- Technological Advancement: Early adoption and development of cutting-edge building automation technologies, including IoT and AI.
- Consumer Demand: Growing tenant and owner preference for sustainable, comfortable, and secure living and working environments.
While North America leads, regions like Europe and Asia-Pacific are exhibiting significant growth potential due to increasing investments in smart city projects and stricter environmental regulations.
Building Automation Industry Product Landscape
The Building Automation Industry's product landscape is characterized by a continuous stream of innovations aimed at enhancing functionality, efficiency, and user experience. Key product categories include sophisticated HVAC systems that optimize temperature control and ventilation based on occupancy and external conditions, advanced Security and Access Control Systems leveraging AI for threat detection and biometric authentication, and intelligent Energy Management Systems that monitor and regulate energy consumption in real-time. Lighting Management Systems are evolving with adaptive controls and daylight harvesting features, while integrated Building Management Systems serve as the central nervous system, orchestrating all automated functions. Notable technological advancements include the integration of predictive maintenance algorithms, self-learning capabilities for system optimization, and enhanced cybersecurity features to protect sensitive building data. These innovations offer unique selling propositions by reducing operational costs, improving occupant comfort and safety, and contributing to sustainability goals.
Key Drivers, Barriers & Challenges in Building Automation Industry
The Building Automation Industry is propelled by several key drivers, including the escalating global focus on energy efficiency and sustainability, stringent government regulations mandating energy-efficient building practices, and the growing demand for enhanced occupant comfort, safety, and productivity. Technological advancements such as the Internet of Things (IoT), Artificial Intelligence (AI), and cloud computing are enabling more sophisticated and integrated building automation solutions. The increasing adoption of smart buildings in the commercial and residential sectors, coupled with the need for operational cost reductions, further fuels market expansion.
However, the industry faces significant challenges and restraints. High initial investment costs for implementing advanced building automation systems remain a major barrier for small and medium-sized enterprises. Supply chain disruptions and the availability of skilled labor for installation, maintenance, and management of complex systems also pose challenges. Regulatory hurdles and the lack of standardization across different platforms can hinder interoperability and widespread adoption. Competitive pressures from established players and emerging technologies, alongside cybersecurity concerns, also require continuous attention.
Emerging Opportunities in Building Automation Industry
Emerging opportunities in the Building Automation Industry lie in the burgeoning demand for retrofitting existing buildings with smart technologies to improve their energy performance and occupant experience. The integration of advanced analytics and AI for predictive maintenance and anomaly detection presents a significant avenue for value creation, moving beyond simple automation to intelligent building management. The increasing focus on health and well-being, accelerated by recent global events, is driving the adoption of sophisticated air quality monitoring and control systems. Furthermore, the expansion of building automation into underserved markets, such as educational institutions and healthcare facilities, offers substantial untapped potential. The development of open-source platforms and interoperable solutions will also foster innovation and broader market accessibility.
Growth Accelerators in the Building Automation Industry Industry
Several key catalysts are accelerating growth in the Building Automation Industry. Technological breakthroughs in AI, IoT, and edge computing are enabling more intelligent, responsive, and efficient building operations. Strategic partnerships and collaborations between technology providers, system integrators, and real estate developers are crucial for expanding market reach and offering comprehensive solutions. The increasing demand for net-zero energy buildings and sustainable infrastructure is a powerful growth driver, pushing the adoption of advanced energy management systems. Market expansion into emerging economies with rapidly developing urban landscapes and a growing awareness of sustainability will also contribute significantly to long-term growth.
Key Players Shaping the Building Automation Industry Market
- Rockwell Automation
- Endress+Hauser
- Phoenix Contact
- Emerson
- GE
- Honeywell
- IMI Precision Engineering
- Siemens
- Yokogawa Electric
- Schneider Electric
- Ametek EIG
- Fortive
- Mitsubishi Electric
- Omron
- ABB
Notable Milestones in Building Automation Industry Sector
- 2019: Significant increase in IoT device integration for enhanced building connectivity and data collection.
- 2020: Accelerated adoption of touchless technologies and enhanced air quality monitoring systems in response to the COVID-19 pandemic.
- 2021: Growing emphasis on AI and machine learning for predictive maintenance and energy optimization algorithms.
- 2022: Launch of advanced cybersecurity solutions specifically tailored for building automation systems.
- 2023: Increased M&A activity as major players consolidate their portfolios and expand market presence.
- 2024: Growing adoption of edge computing for real-time data processing and localized control within buildings.
In-Depth Building Automation Industry Market Outlook
The future outlook for the Building Automation Industry is exceptionally promising, driven by the sustained integration of advanced technologies and a global imperative for sustainable infrastructure. Growth accelerators, including the continuous evolution of AI for sophisticated building management, the expansion of IoT ecosystems, and the increasing demand for smart and healthy buildings, are poised to shape market trajectories. Strategic opportunities lie in catering to the retrofitting market, developing interoperable and open platforms, and expanding into emerging economies. The industry is set to witness significant innovation in areas such as predictive energy management, personalized occupant experiences, and autonomous building operations, further solidifying its role in shaping the future of the built environment.
Building Automation Industry Segmentation
-
1. Product Type
- 1.1. HVAC
- 1.2. Building Management Systems
- 1.3. Security and Access Control Systems
- 1.4. Energy Management Systems
- 1.5. Lighting Management Systems
-
2. Application
- 2.1. Multifamily
- 2.2. Office
- 2.3. Retail
Building Automation Industry Segmentation By Geography
-
1. North America
- 1.1. United States
- 1.2. Canada
- 1.3. Mexico
- 1.4. Rest of North America
-
2. Europe
- 2.1. Germany
- 2.2. United Kingdom
- 2.3. France
- 2.4. Russia
- 2.5. Spain
- 2.6. Rest of Europe
-
3. Asia Pacific
- 3.1. India
- 3.2. China
- 3.3. Japan
- 3.4. Rest of Asia Pacific
-
4. South America
- 4.1. Brazil
- 4.2. Argentina
-
5. Middle East
- 5.1. United Arab Emirates
- 5.2. Saudi Arabia
- 5.3. Rest of Middle East
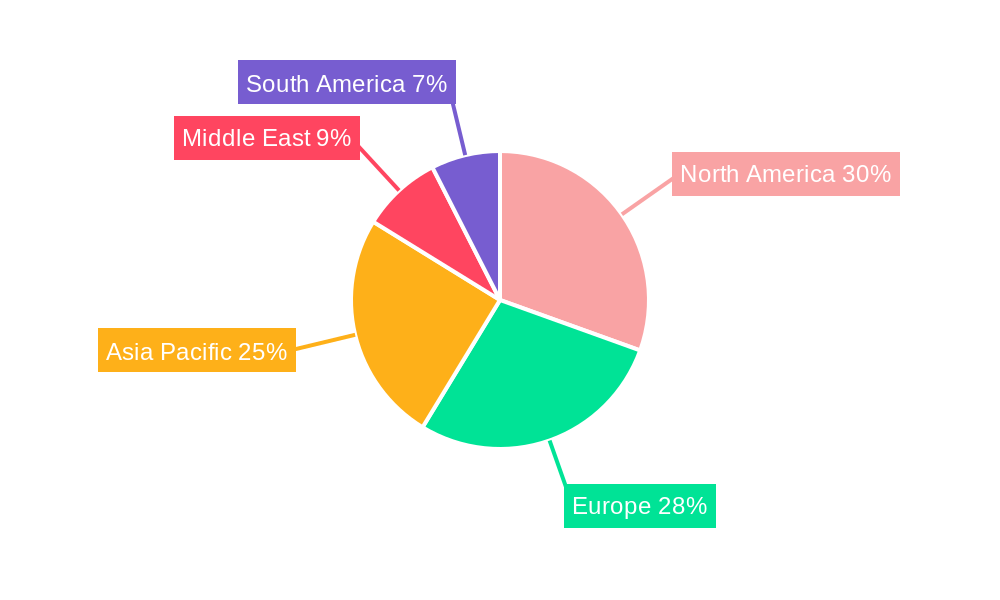
Building Automation Industry Regional Market Share
Geographic Coverage of Building Automation Industry
Building Automation Industry REPORT HIGHLIGHTS
| Aspects | Details |
|---|---|
| Study Period | 2020-2034 |
| Base Year | 2025 |
| Estimated Year | 2026 |
| Forecast Period | 2026-2034 |
| Historical Period | 2020-2025 |
| Growth Rate | CAGR of 13.4% from 2020-2034 |
| Segmentation |
|
Table of Contents
- 1. Introduction
- 1.1. Research Scope
- 1.2. Market Segmentation
- 1.3. Research Objective
- 1.4. Definitions and Assumptions
- 2. Executive Summary
- 2.1. Market Snapshot
- 3. Market Dynamics
- 3.1. Market Drivers
- 3.2. Market Restrains
- 3.3. Market Trends
- 3.4. Market Opportunities
- 4. Market Factor Analysis
- 4.1. Porters Five Forces
- 4.1.1. Bargaining Power of Suppliers
- 4.1.2. Bargaining Power of Buyers
- 4.1.3. Threat of New Entrants
- 4.1.4. Threat of Substitutes
- 4.1.5. Competitive Rivalry
- 4.2. PESTEL analysis
- 4.3. BCG Analysis
- 4.3.1. Stars (High Growth, High Market Share)
- 4.3.2. Cash Cows (Low Growth, High Market Share)
- 4.3.3. Question Mark (High Growth, Low Market Share)
- 4.3.4. Dogs (Low Growth, Low Market Share)
- 4.4. Ansoff Matrix Analysis
- 4.5. Supply Chain Analysis
- 4.6. Regulatory Landscape
- 4.7. Current Market Potential and Opportunity Assessment (TAM–SAM–SOM Framework)
- 4.8. VDR Analyst Note
- 4.1. Porters Five Forces
- 5. Market Analysis, Insights and Forecast 2021-2033
- 5.1. Market Analysis, Insights and Forecast - by Product Type
- 5.1.1. HVAC
- 5.1.2. Building Management Systems
- 5.1.3. Security and Access Control Systems
- 5.1.4. Energy Management Systems
- 5.1.5. Lighting Management Systems
- 5.2. Market Analysis, Insights and Forecast - by Application
- 5.2.1. Multifamily
- 5.2.2. Office
- 5.2.3. Retail
- 5.3. Market Analysis, Insights and Forecast - by Region
- 5.3.1. North America
- 5.3.2. Europe
- 5.3.3. Asia Pacific
- 5.3.4. South America
- 5.3.5. Middle East
- 5.1. Market Analysis, Insights and Forecast - by Product Type
- 6. Global Building Automation Industry Analysis, Insights and Forecast, 2021-2033
- 6.1. Market Analysis, Insights and Forecast - by Product Type
- 6.1.1. HVAC
- 6.1.2. Building Management Systems
- 6.1.3. Security and Access Control Systems
- 6.1.4. Energy Management Systems
- 6.1.5. Lighting Management Systems
- 6.2. Market Analysis, Insights and Forecast - by Application
- 6.2.1. Multifamily
- 6.2.2. Office
- 6.2.3. Retail
- 6.1. Market Analysis, Insights and Forecast - by Product Type
- 7. North America Building Automation Industry Analysis, Insights and Forecast, 2021-2033
- 7.1. Market Analysis, Insights and Forecast - by Product Type
- 7.1.1. HVAC
- 7.1.2. Building Management Systems
- 7.1.3. Security and Access Control Systems
- 7.1.4. Energy Management Systems
- 7.1.5. Lighting Management Systems
- 7.2. Market Analysis, Insights and Forecast - by Application
- 7.2.1. Multifamily
- 7.2.2. Office
- 7.2.3. Retail
- 7.1. Market Analysis, Insights and Forecast - by Product Type
- 8. Europe Building Automation Industry Analysis, Insights and Forecast, 2021-2033
- 8.1. Market Analysis, Insights and Forecast - by Product Type
- 8.1.1. HVAC
- 8.1.2. Building Management Systems
- 8.1.3. Security and Access Control Systems
- 8.1.4. Energy Management Systems
- 8.1.5. Lighting Management Systems
- 8.2. Market Analysis, Insights and Forecast - by Application
- 8.2.1. Multifamily
- 8.2.2. Office
- 8.2.3. Retail
- 8.1. Market Analysis, Insights and Forecast - by Product Type
- 9. Asia Pacific Building Automation Industry Analysis, Insights and Forecast, 2021-2033
- 9.1. Market Analysis, Insights and Forecast - by Product Type
- 9.1.1. HVAC
- 9.1.2. Building Management Systems
- 9.1.3. Security and Access Control Systems
- 9.1.4. Energy Management Systems
- 9.1.5. Lighting Management Systems
- 9.2. Market Analysis, Insights and Forecast - by Application
- 9.2.1. Multifamily
- 9.2.2. Office
- 9.2.3. Retail
- 9.1. Market Analysis, Insights and Forecast - by Product Type
- 10. South America Building Automation Industry Analysis, Insights and Forecast, 2021-2033
- 10.1. Market Analysis, Insights and Forecast - by Product Type
- 10.1.1. HVAC
- 10.1.2. Building Management Systems
- 10.1.3. Security and Access Control Systems
- 10.1.4. Energy Management Systems
- 10.1.5. Lighting Management Systems
- 10.2. Market Analysis, Insights and Forecast - by Application
- 10.2.1. Multifamily
- 10.2.2. Office
- 10.2.3. Retail
- 10.1. Market Analysis, Insights and Forecast - by Product Type
- 11. Middle East Building Automation Industry Analysis, Insights and Forecast, 2021-2033
- 11.1. Market Analysis, Insights and Forecast - by Product Type
- 11.1.1. HVAC
- 11.1.2. Building Management Systems
- 11.1.3. Security and Access Control Systems
- 11.1.4. Energy Management Systems
- 11.1.5. Lighting Management Systems
- 11.2. Market Analysis, Insights and Forecast - by Application
- 11.2.1. Multifamily
- 11.2.2. Office
- 11.2.3. Retail
- 11.1. Market Analysis, Insights and Forecast - by Product Type
- 12. Competitive Analysis
- 12.1. Company Profiles
- 12.1.1 Rockwell Automation
- 12.1.1.1. Company Overview
- 12.1.1.2. Products
- 12.1.1.3. Company Financials
- 12.1.1.4. SWOT Analysis
- 12.1.2 Endress+Hauser
- 12.1.2.1. Company Overview
- 12.1.2.2. Products
- 12.1.2.3. Company Financials
- 12.1.2.4. SWOT Analysis
- 12.1.3 Phoenix Contact
- 12.1.3.1. Company Overview
- 12.1.3.2. Products
- 12.1.3.3. Company Financials
- 12.1.3.4. SWOT Analysis
- 12.1.4 Emerson
- 12.1.4.1. Company Overview
- 12.1.4.2. Products
- 12.1.4.3. Company Financials
- 12.1.4.4. SWOT Analysis
- 12.1.5 GE
- 12.1.5.1. Company Overview
- 12.1.5.2. Products
- 12.1.5.3. Company Financials
- 12.1.5.4. SWOT Analysis
- 12.1.6 Honeywell
- 12.1.6.1. Company Overview
- 12.1.6.2. Products
- 12.1.6.3. Company Financials
- 12.1.6.4. SWOT Analysis
- 12.1.7 IMI Precision Engineering*List Not Exhaustive
- 12.1.7.1. Company Overview
- 12.1.7.2. Products
- 12.1.7.3. Company Financials
- 12.1.7.4. SWOT Analysis
- 12.1.8 Siemens
- 12.1.8.1. Company Overview
- 12.1.8.2. Products
- 12.1.8.3. Company Financials
- 12.1.8.4. SWOT Analysis
- 12.1.9 Yokogawa Electric
- 12.1.9.1. Company Overview
- 12.1.9.2. Products
- 12.1.9.3. Company Financials
- 12.1.9.4. SWOT Analysis
- 12.1.10 Schneider Electric
- 12.1.10.1. Company Overview
- 12.1.10.2. Products
- 12.1.10.3. Company Financials
- 12.1.10.4. SWOT Analysis
- 12.1.11 Ametek EIG
- 12.1.11.1. Company Overview
- 12.1.11.2. Products
- 12.1.11.3. Company Financials
- 12.1.11.4. SWOT Analysis
- 12.1.12 Fortive
- 12.1.12.1. Company Overview
- 12.1.12.2. Products
- 12.1.12.3. Company Financials
- 12.1.12.4. SWOT Analysis
- 12.1.13 Mitsubishi Electric
- 12.1.13.1. Company Overview
- 12.1.13.2. Products
- 12.1.13.3. Company Financials
- 12.1.13.4. SWOT Analysis
- 12.1.14 Omron
- 12.1.14.1. Company Overview
- 12.1.14.2. Products
- 12.1.14.3. Company Financials
- 12.1.14.4. SWOT Analysis
- 12.1.15 ABB
- 12.1.15.1. Company Overview
- 12.1.15.2. Products
- 12.1.15.3. Company Financials
- 12.1.15.4. SWOT Analysis
- 12.1.1 Rockwell Automation
- 12.2. Market Entropy
- 12.2.1 Company's Key Areas Served
- 12.2.2 Recent Developments
- 12.3. Company Market Share Analysis 2025
- 12.3.1 Top 5 Companies Market Share Analysis
- 12.3.2 Top 3 Companies Market Share Analysis
- 12.4. List of Potential Customers
- 13. Research Methodology
List of Figures
- Figure 1: Global Building Automation Industry Revenue Breakdown (billion, %) by Region 2025 & 2033
- Figure 2: North America Building Automation Industry Revenue (billion), by Product Type 2025 & 2033
- Figure 3: North America Building Automation Industry Revenue Share (%), by Product Type 2025 & 2033
- Figure 4: North America Building Automation Industry Revenue (billion), by Application 2025 & 2033
- Figure 5: North America Building Automation Industry Revenue Share (%), by Application 2025 & 2033
- Figure 6: North America Building Automation Industry Revenue (billion), by Country 2025 & 2033
- Figure 7: North America Building Automation Industry Revenue Share (%), by Country 2025 & 2033
- Figure 8: Europe Building Automation Industry Revenue (billion), by Product Type 2025 & 2033
- Figure 9: Europe Building Automation Industry Revenue Share (%), by Product Type 2025 & 2033
- Figure 10: Europe Building Automation Industry Revenue (billion), by Application 2025 & 2033
- Figure 11: Europe Building Automation Industry Revenue Share (%), by Application 2025 & 2033
- Figure 12: Europe Building Automation Industry Revenue (billion), by Country 2025 & 2033
- Figure 13: Europe Building Automation Industry Revenue Share (%), by Country 2025 & 2033
- Figure 14: Asia Pacific Building Automation Industry Revenue (billion), by Product Type 2025 & 2033
- Figure 15: Asia Pacific Building Automation Industry Revenue Share (%), by Product Type 2025 & 2033
- Figure 16: Asia Pacific Building Automation Industry Revenue (billion), by Application 2025 & 2033
- Figure 17: Asia Pacific Building Automation Industry Revenue Share (%), by Application 2025 & 2033
- Figure 18: Asia Pacific Building Automation Industry Revenue (billion), by Country 2025 & 2033
- Figure 19: Asia Pacific Building Automation Industry Revenue Share (%), by Country 2025 & 2033
- Figure 20: South America Building Automation Industry Revenue (billion), by Product Type 2025 & 2033
- Figure 21: South America Building Automation Industry Revenue Share (%), by Product Type 2025 & 2033
- Figure 22: South America Building Automation Industry Revenue (billion), by Application 2025 & 2033
- Figure 23: South America Building Automation Industry Revenue Share (%), by Application 2025 & 2033
- Figure 24: South America Building Automation Industry Revenue (billion), by Country 2025 & 2033
- Figure 25: South America Building Automation Industry Revenue Share (%), by Country 2025 & 2033
- Figure 26: Middle East Building Automation Industry Revenue (billion), by Product Type 2025 & 2033
- Figure 27: Middle East Building Automation Industry Revenue Share (%), by Product Type 2025 & 2033
- Figure 28: Middle East Building Automation Industry Revenue (billion), by Application 2025 & 2033
- Figure 29: Middle East Building Automation Industry Revenue Share (%), by Application 2025 & 2033
- Figure 30: Middle East Building Automation Industry Revenue (billion), by Country 2025 & 2033
- Figure 31: Middle East Building Automation Industry Revenue Share (%), by Country 2025 & 2033
List of Tables
- Table 1: Global Building Automation Industry Revenue billion Forecast, by Product Type 2020 & 2033
- Table 2: Global Building Automation Industry Revenue billion Forecast, by Application 2020 & 2033
- Table 3: Global Building Automation Industry Revenue billion Forecast, by Region 2020 & 2033
- Table 4: Global Building Automation Industry Revenue billion Forecast, by Product Type 2020 & 2033
- Table 5: Global Building Automation Industry Revenue billion Forecast, by Application 2020 & 2033
- Table 6: Global Building Automation Industry Revenue billion Forecast, by Country 2020 & 2033
- Table 7: United States Building Automation Industry Revenue (billion) Forecast, by Application 2020 & 2033
- Table 8: Canada Building Automation Industry Revenue (billion) Forecast, by Application 2020 & 2033
- Table 9: Mexico Building Automation Industry Revenue (billion) Forecast, by Application 2020 & 2033
- Table 10: Rest of North America Building Automation Industry Revenue (billion) Forecast, by Application 2020 & 2033
- Table 11: Global Building Automation Industry Revenue billion Forecast, by Product Type 2020 & 2033
- Table 12: Global Building Automation Industry Revenue billion Forecast, by Application 2020 & 2033
- Table 13: Global Building Automation Industry Revenue billion Forecast, by Country 2020 & 2033
- Table 14: Germany Building Automation Industry Revenue (billion) Forecast, by Application 2020 & 2033
- Table 15: United Kingdom Building Automation Industry Revenue (billion) Forecast, by Application 2020 & 2033
- Table 16: France Building Automation Industry Revenue (billion) Forecast, by Application 2020 & 2033
- Table 17: Russia Building Automation Industry Revenue (billion) Forecast, by Application 2020 & 2033
- Table 18: Spain Building Automation Industry Revenue (billion) Forecast, by Application 2020 & 2033
- Table 19: Rest of Europe Building Automation Industry Revenue (billion) Forecast, by Application 2020 & 2033
- Table 20: Global Building Automation Industry Revenue billion Forecast, by Product Type 2020 & 2033
- Table 21: Global Building Automation Industry Revenue billion Forecast, by Application 2020 & 2033
- Table 22: Global Building Automation Industry Revenue billion Forecast, by Country 2020 & 2033
- Table 23: India Building Automation Industry Revenue (billion) Forecast, by Application 2020 & 2033
- Table 24: China Building Automation Industry Revenue (billion) Forecast, by Application 2020 & 2033
- Table 25: Japan Building Automation Industry Revenue (billion) Forecast, by Application 2020 & 2033
- Table 26: Rest of Asia Pacific Building Automation Industry Revenue (billion) Forecast, by Application 2020 & 2033
- Table 27: Global Building Automation Industry Revenue billion Forecast, by Product Type 2020 & 2033
- Table 28: Global Building Automation Industry Revenue billion Forecast, by Application 2020 & 2033
- Table 29: Global Building Automation Industry Revenue billion Forecast, by Country 2020 & 2033
- Table 30: Brazil Building Automation Industry Revenue (billion) Forecast, by Application 2020 & 2033
- Table 31: Argentina Building Automation Industry Revenue (billion) Forecast, by Application 2020 & 2033
- Table 32: Global Building Automation Industry Revenue billion Forecast, by Product Type 2020 & 2033
- Table 33: Global Building Automation Industry Revenue billion Forecast, by Application 2020 & 2033
- Table 34: Global Building Automation Industry Revenue billion Forecast, by Country 2020 & 2033
- Table 35: United Arab Emirates Building Automation Industry Revenue (billion) Forecast, by Application 2020 & 2033
- Table 36: Saudi Arabia Building Automation Industry Revenue (billion) Forecast, by Application 2020 & 2033
- Table 37: Rest of Middle East Building Automation Industry Revenue (billion) Forecast, by Application 2020 & 2033
Frequently Asked Questions
1. What is the projected Compound Annual Growth Rate (CAGR) of the Building Automation Industry?
The projected CAGR is approximately 13.4%.
2. Which companies are prominent players in the Building Automation Industry?
Key companies in the market include Rockwell Automation, Endress+Hauser, Phoenix Contact, Emerson, GE, Honeywell, IMI Precision Engineering*List Not Exhaustive, Siemens, Yokogawa Electric, Schneider Electric, Ametek EIG, Fortive, Mitsubishi Electric, Omron, ABB.
3. What are the main segments of the Building Automation Industry?
The market segments include Product Type, Application.
4. Can you provide details about the market size?
The market size is estimated to be USD 101.34 billion as of 2022.
5. What are some drivers contributing to market growth?
Adoption of Digitalization to Improve Production; Introduction of Cloud Technology to Consolidate the Information.
6. What are the notable trends driving market growth?
Growth in Global Green Building Market.
7. Are there any restraints impacting market growth?
Lack of Interoperability among Dissimilar Product Versions.
8. Can you provide examples of recent developments in the market?
N/A
9. What pricing options are available for accessing the report?
Pricing options include single-user, multi-user, and enterprise licenses priced at USD 4750, USD 5250, and USD 8750 respectively.
10. Is the market size provided in terms of value or volume?
The market size is provided in terms of value, measured in billion.
11. Are there any specific market keywords associated with the report?
Yes, the market keyword associated with the report is "Building Automation Industry," which aids in identifying and referencing the specific market segment covered.
12. How do I determine which pricing option suits my needs best?
The pricing options vary based on user requirements and access needs. Individual users may opt for single-user licenses, while businesses requiring broader access may choose multi-user or enterprise licenses for cost-effective access to the report.
13. Are there any additional resources or data provided in the Building Automation Industry report?
While the report offers comprehensive insights, it's advisable to review the specific contents or supplementary materials provided to ascertain if additional resources or data are available.
14. How can I stay updated on further developments or reports in the Building Automation Industry?
To stay informed about further developments, trends, and reports in the Building Automation Industry, consider subscribing to industry newsletters, following relevant companies and organizations, or regularly checking reputable industry news sources and publications.
Methodology
Step 1 - Identification of Relevant Samples Size from Population Database


Step 2 - Approaches for Defining Global Market Size (Value, Volume* & Price*)

Note*: In applicable scenarios
Step 3 - Data Sources
Primary Research
- Web Analytics
- Survey Reports
- Research Institute
- Latest Research Reports
- Opinion Leaders
Secondary Research
- Annual Reports
- White Paper
- Latest Press Release
- Industry Association
- Paid Database
- Investor Presentations

Step 4 - Data Triangulation
Involves using different sources of information in order to increase the validity of a study
These sources are likely to be stakeholders in a program - participants, other researchers, program staff, other community members, and so on.
Then we put all data in single framework & apply various statistical tools to find out the dynamic on the market.
During the analysis stage, feedback from the stakeholder groups would be compared to determine areas of agreement as well as areas of divergence