

Key Insights
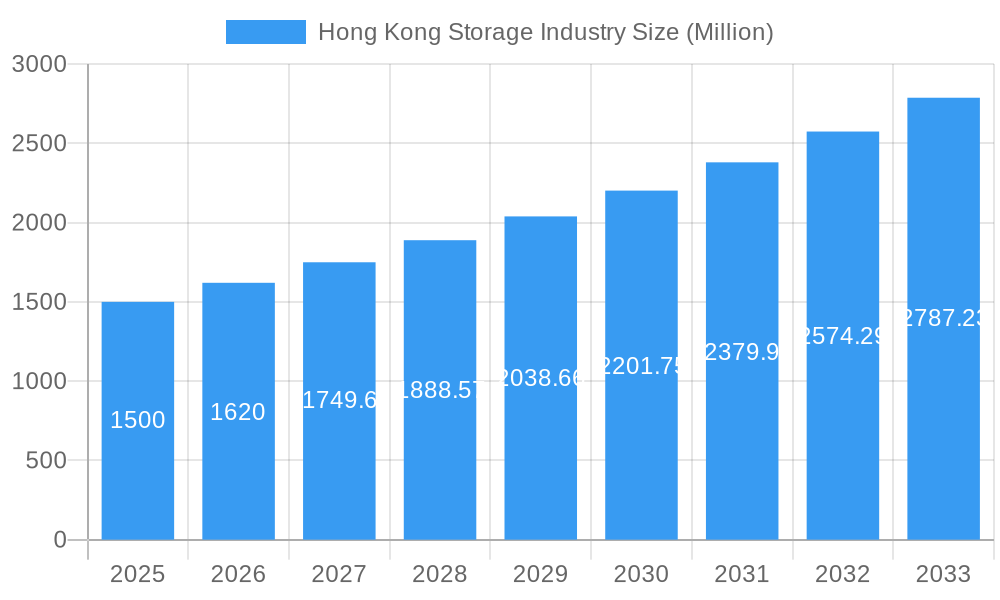
The Hong Kong storage market is set for substantial expansion, forecasted to reach a value of 3.96 million by 2025, with a Compound Annual Growth Rate (CAGR) of 8% through 2033. Key growth drivers include increasing urbanization, shrinking residential spaces, and a thriving e-commerce sector demanding efficient logistics. Rising disposable incomes and a growing preference for decluttering are boosting demand for self-storage from both individual and business sectors. Technological advancements, including smart access, climate-controlled units, and mobile applications, are improving user experience and driving market adoption.
Hong Kong Storage Industry Market Size (In Million)
Significant opportunities exist within the Hong Kong storage sector. Limited real estate in this densely populated city fuels consistent demand for off-site storage. The expanding e-commerce landscape and the adoption of hybrid work models create dual demand for business logistics and flexible personal storage. The presence of established and emerging companies indicates a competitive and dynamic market. While high rental costs are a potential challenge, the fundamental value of secure and accessible storage for businesses optimizing costs and individuals maximizing living space will continue to drive market growth. The market is also expected to see an increase in specialized storage solutions for items like art, wine, and documents.
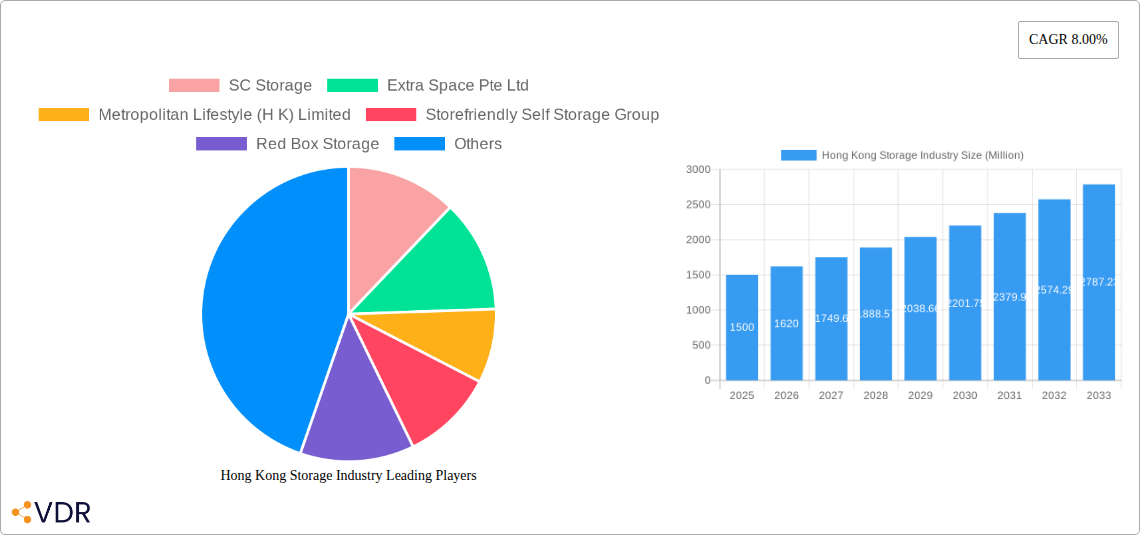
Hong Kong Storage Industry Company Market Share
Hong Kong Storage Industry: Market Dynamics, Growth Trends, and Future Outlook (2019-2033)
This comprehensive report provides an in-depth analysis of the Hong Kong storage industry, encompassing its market dynamics, growth trajectory, regional dominance, product landscape, key drivers, challenges, emerging opportunities, and future outlook. Analyzing data from 2019 to 2033, with a base and estimated year of 2025, this report offers critical insights for industry professionals, investors, and stakeholders seeking to navigate this rapidly evolving sector. It examines both the broader parent market and the specialized child market of self-storage, highlighting key trends and competitive landscapes.
Hong Kong Storage Industry Market Dynamics & Structure
The Hong Kong storage industry is characterized by a moderate market concentration, with a few key players holding significant market share, but also a growing number of smaller operators catering to niche demands. Technological innovation is a primary driver, with advancements in smart storage solutions, integrated inventory management systems, and climate-controlled storage facilities enhancing operational efficiency and customer experience. Regulatory frameworks, while evolving, generally support business growth, though zoning laws and building regulations for storage facilities can present some complexities. Competitive product substitutes are limited primarily to alternative storage solutions like unused residential or commercial space, which are often less flexible and cost-effective for many end-users. End-user demographics are diverse, encompassing both personal storage needs (e.g., decluttering, temporary relocation) and robust business storage demands (e.g., inventory management, document archiving, e-commerce fulfillment). Mergers and acquisitions (M&A) trends indicate a consolidating market, with larger players acquiring smaller ones to expand their footprint and service offerings.
- Market Concentration: Dominated by a blend of established operators and emerging niche providers.
- Technological Innovation: Focus on smart access, digital inventory, and environmental controls.
- Regulatory Environment: Generally supportive but with specific building and operational compliance requirements.
- Competitive Substitutes: Primarily informal storage solutions and underutilized property spaces.
- End-User Segmentation: Strong demand from both individual consumers and commercial entities.
- M&A Activity: Indicative of market maturation and strategic expansion.
Hong Kong Storage Industry Growth Trends & Insights
The Hong Kong storage industry has witnessed substantial growth, fueled by increasing urbanization, rising rental costs for residential and commercial spaces, and a growing propensity for decluttering and efficient space management. The market size has evolved significantly, moving from an estimated HKD 5,000 Million in 2019 to an estimated HKD 7,500 Million in 2024. This growth trajectory is projected to continue, with an anticipated Compound Annual Growth Rate (CAGR) of approximately 7.5% from 2025 to 2033, reaching an estimated market size of HKD 13,000 Million by the end of the forecast period. Adoption rates for professional storage solutions are steadily increasing as awareness of their benefits, such as enhanced security, accessibility, and cost-effectiveness, grows among both personal and business users. Technological disruptions are playing a pivotal role, with the integration of IoT devices for real-time monitoring, automated inventory systems, and mobile applications for seamless access and management enhancing the user experience and operational efficiency. Consumer behavior shifts are evident, with a greater willingness to outsource storage needs to free up valuable living and working spaces, particularly among younger demographics and small to medium-sized enterprises (SMEs) focused on optimizing their operational expenditures. The business segment, in particular, is driving growth through its demand for flexible inventory solutions for e-commerce and the need for secure, off-site document storage. The parent market, encompassing traditional warehousing and logistics, is seeing integration with specialized self-storage offerings, creating a more diversified and comprehensive storage ecosystem.
Dominant Regions, Countries, or Segments in Hong Kong Storage Industry
Within the Hong Kong storage industry, the Business end-user segment stands out as the primary driver of market growth, exhibiting a dominant market share and significant growth potential. This dominance is underpinned by several key factors, including the city's status as a major international business hub and the prevailing economic policies that encourage entrepreneurial activity and trade. The relentless demand for flexible and scalable storage solutions from businesses, particularly those in the burgeoning e-commerce sector, SMEs requiring inventory management, and corporations needing secure document archiving, propels this segment's growth. Furthermore, the high cost of commercial real estate in Hong Kong makes it economically prudent for businesses to opt for dedicated storage facilities rather than expanding their own premises. The government's focus on fostering innovation and trade also indirectly benefits the storage industry by supporting business growth. The New Territories, with its availability of larger industrial spaces and more favorable rental rates compared to Hong Kong Island, has emerged as a dominant region for the establishment of large-scale storage facilities and fulfillment centers, catering to the logistical needs of these businesses. Market share within the business segment is estimated to be around 65% of the total market revenue, with a projected CAGR of 8.2% over the forecast period. In contrast, the personal storage segment, while growing, currently represents approximately 35% of the market revenue with a slightly lower CAGR of 6.5%. The infrastructure development within the New Territories, including improved transportation networks, further solidifies its position as a crucial area for storage operators serving the business community.
- Key Drivers for Business Segment Dominance:
- High cost of commercial real estate in Hong Kong.
- Rapid growth of the e-commerce sector and its inventory management needs.
- Demand for secure document storage and archiving solutions.
- Flexibility and scalability offered by professional storage services.
- Favorable economic policies supporting business expansion and trade.
- Dominant Region: New Territories:
- Availability of larger industrial spaces at competitive rental rates.
- Developing transportation infrastructure for efficient logistics.
- Strategic location for serving both local and regional businesses.
- Higher concentration of large-scale storage facilities and fulfillment centers.
- Market Share & Growth Potential:
- Business Segment: ~65% market share, ~8.2% CAGR (2025-2033).
- Personal Segment: ~35% market share, ~6.5% CAGR (2025-2033).
Hong Kong Storage Industry Product Landscape
The Hong Kong storage industry's product landscape is evolving rapidly, moving beyond basic storage units to offer sophisticated solutions. Key product innovations include smart self-storage units equipped with individual climate control, humidity regulation, and advanced security features like biometric access and real-time monitoring. Mobile applications are integral, allowing users to remotely manage their storage units, schedule pickups and deliveries, and even virtually tour available spaces. The integration of inventory management software for business clients provides real-time visibility into stored goods, optimizing stock levels and streamlining operations. Performance metrics are increasingly focused on accessibility, security uptime, and environmental controls, ensuring items are preserved in optimal conditions. Unique selling propositions often revolve around convenience, customization, and technology-driven efficiency, catering to a discerning clientele seeking more than just space.
Key Drivers, Barriers & Challenges in Hong Kong Storage Industry
The Hong Kong storage industry is propelled by several key drivers. Increasing urbanization and shrinking living spaces are primary motivators for individuals seeking external storage. The robust growth of e-commerce and SMEs demands efficient and flexible inventory management solutions, creating a significant B2B market. Technological advancements in smart storage, automation, and digital platforms enhance user experience and operational efficiency. Economic growth and business expansion further fuel the demand for storage services.
However, the industry faces several barriers and challenges. High real estate costs in Hong Kong present a significant hurdle for operators looking to acquire or lease space for new facilities. Stringent building codes and regulatory compliance can also add complexity and cost to development and operations. Intense competition from both established players and new entrants can pressure pricing and profit margins. Supply chain disruptions, though less direct for storage operators themselves, can impact the overall demand from businesses reliant on smooth logistics.
Emerging Opportunities in Hong Kong Storage Industry
Emerging opportunities in the Hong Kong storage industry lie in several key areas. The development of specialized storage solutions for high-value items, such as art, wine, or electronics, presents a lucrative niche. The growing demand for flexible co-working spaces with integrated storage solutions offers a unique synergy. Furthermore, the adoption of eco-friendly and sustainable storage practices, including energy-efficient facilities and recycling programs, caters to an increasingly environmentally conscious consumer base. The expansion into last-mile delivery and fulfillment services integrated with storage facilities can create a comprehensive logistics ecosystem for e-commerce businesses.
Growth Accelerators in the Hong Kong Storage Industry Industry
Several catalysts are accelerating the growth of the Hong Kong storage industry. Strategic partnerships between storage providers and real estate developers, logistics companies, and e-commerce platforms are expanding reach and service offerings. Technological breakthroughs, particularly in AI-powered inventory management and automation, are enhancing efficiency and customer convenience. Market expansion strategies, including the development of more compact and accessible storage facilities in densely populated urban areas, are crucial for capturing a wider customer base. The increasing adoption of smart building technologies within storage facilities also contributes to operational efficiency and improved customer experience, further driving growth.
Key Players Shaping the Hong Kong Storage Industry Market
- SC Storage
- Extra Space Pte Ltd
- Metropolitan Lifestyle (H K) Limited
- Storefriendly Self Storage Group
- Red Box Storage
- Boxful Self Storage
- Cube Self Storage
- Apple Storage (tai Yau Storage Group Limited)
- Spacebox Limited
- In N Out Storage
- Hongkong Storage
- Storhub Self Storage
Notable Milestones in Hong Kong Storage Industry Sector
- April 2023: Storefriendly, the Asia self-storage operator backed by investment giant Blackstone, recently introduced its two latest locations at redeveloped properties on Hong Kong Island and in the New Territories.
- December 2023: A joint venture between US private equity giant Blackstone and Hong Kong-based self-storage operator StoreFriendly has acquired an industrial building in Hong Kong’s New Territories for HKD560 million (USD 72 million), with plans to convert the Tsuen Wan property into a self-storage facility.
In-Depth Hong Kong Storage Industry Market Outlook
The outlook for the Hong Kong storage industry remains exceptionally positive, driven by a confluence of sustained demand and innovative strategies. Future market potential is amplified by the ongoing trend of space optimization in one of the world's most densely populated cities. Strategic opportunities abound in the continued integration of technology to create smarter, more user-friendly storage experiences, particularly for the burgeoning business segment. The industry's ability to adapt to evolving consumer preferences for convenience, security, and flexibility will be paramount. Expect continued consolidation through M&A, alongside the emergence of specialized services addressing niche market demands, solidifying Hong Kong's position as a key hub for advanced storage solutions in Asia.
Hong Kong Storage Industry Segmentation
-
1. End User
- 1.1. Personal
- 1.2. Business
Hong Kong Storage Industry Segmentation By Geography
-
1. North America
- 1.1. United States
- 1.2. Canada
- 1.3. Mexico
-
2. South America
- 2.1. Brazil
- 2.2. Argentina
- 2.3. Rest of South America
-
3. Europe
- 3.1. United Kingdom
- 3.2. Germany
- 3.3. France
- 3.4. Italy
- 3.5. Spain
- 3.6. Russia
- 3.7. Benelux
- 3.8. Nordics
- 3.9. Rest of Europe
-
4. Middle East & Africa
- 4.1. Turkey
- 4.2. Israel
- 4.3. GCC
- 4.4. North Africa
- 4.5. South Africa
- 4.6. Rest of Middle East & Africa
-
5. Asia Pacific
- 5.1. China
- 5.2. India
- 5.3. Japan
- 5.4. South Korea
- 5.5. ASEAN
- 5.6. Oceania
- 5.7. Rest of Asia Pacific
Hong Kong Storage Industry Regional Market Share
Geographic Coverage of Hong Kong Storage Industry
Hong Kong Storage Industry REPORT HIGHLIGHTS
| Aspects | Details |
|---|---|
| Study Period | 2020-2034 |
| Base Year | 2025 |
| Estimated Year | 2026 |
| Forecast Period | 2026-2034 |
| Historical Period | 2020-2025 |
| Growth Rate | CAGR of 8% from 2020-2034 |
| Segmentation |
|
Table of Contents
- 1. Introduction
- 1.1. Research Scope
- 1.2. Market Segmentation
- 1.3. Research Objective
- 1.4. Definitions and Assumptions
- 2. Executive Summary
- 2.1. Market Snapshot
- 3. Market Dynamics
- 3.1. Market Drivers
- 3.2. Market Restrains
- 3.3. Market Trends
- 3.4. Market Opportunities
- 4. Market Factor Analysis
- 4.1. Porters Five Forces
- 4.1.1. Bargaining Power of Suppliers
- 4.1.2. Bargaining Power of Buyers
- 4.1.3. Threat of New Entrants
- 4.1.4. Threat of Substitutes
- 4.1.5. Competitive Rivalry
- 4.2. PESTEL analysis
- 4.3. BCG Analysis
- 4.3.1. Stars (High Growth, High Market Share)
- 4.3.2. Cash Cows (Low Growth, High Market Share)
- 4.3.3. Question Mark (High Growth, Low Market Share)
- 4.3.4. Dogs (Low Growth, Low Market Share)
- 4.4. Ansoff Matrix Analysis
- 4.5. Supply Chain Analysis
- 4.6. Regulatory Landscape
- 4.7. Current Market Potential and Opportunity Assessment (TAM–SAM–SOM Framework)
- 4.8. VDR Analyst Note
- 4.1. Porters Five Forces
- 5. Market Analysis, Insights and Forecast 2021-2033
- 5.1. Market Analysis, Insights and Forecast - by End User
- 5.1.1. Personal
- 5.1.2. Business
- 5.2. Market Analysis, Insights and Forecast - by Region
- 5.2.1. North America
- 5.2.2. South America
- 5.2.3. Europe
- 5.2.4. Middle East & Africa
- 5.2.5. Asia Pacific
- 5.1. Market Analysis, Insights and Forecast - by End User
- 6. Global Hong Kong Storage Industry Analysis, Insights and Forecast, 2021-2033
- 6.1. Market Analysis, Insights and Forecast - by End User
- 6.1.1. Personal
- 6.1.2. Business
- 6.1. Market Analysis, Insights and Forecast - by End User
- 7. North America Hong Kong Storage Industry Analysis, Insights and Forecast, 2021-2033
- 7.1. Market Analysis, Insights and Forecast - by End User
- 7.1.1. Personal
- 7.1.2. Business
- 7.1. Market Analysis, Insights and Forecast - by End User
- 8. South America Hong Kong Storage Industry Analysis, Insights and Forecast, 2021-2033
- 8.1. Market Analysis, Insights and Forecast - by End User
- 8.1.1. Personal
- 8.1.2. Business
- 8.1. Market Analysis, Insights and Forecast - by End User
- 9. Europe Hong Kong Storage Industry Analysis, Insights and Forecast, 2021-2033
- 9.1. Market Analysis, Insights and Forecast - by End User
- 9.1.1. Personal
- 9.1.2. Business
- 9.1. Market Analysis, Insights and Forecast - by End User
- 10. Middle East & Africa Hong Kong Storage Industry Analysis, Insights and Forecast, 2021-2033
- 10.1. Market Analysis, Insights and Forecast - by End User
- 10.1.1. Personal
- 10.1.2. Business
- 10.1. Market Analysis, Insights and Forecast - by End User
- 11. Asia Pacific Hong Kong Storage Industry Analysis, Insights and Forecast, 2021-2033
- 11.1. Market Analysis, Insights and Forecast - by End User
- 11.1.1. Personal
- 11.1.2. Business
- 11.1. Market Analysis, Insights and Forecast - by End User
- 12. Competitive Analysis
- 12.1. Company Profiles
- 12.1.1 SC Storage
- 12.1.1.1. Company Overview
- 12.1.1.2. Products
- 12.1.1.3. Company Financials
- 12.1.1.4. SWOT Analysis
- 12.1.2 Extra Space Pte Ltd
- 12.1.2.1. Company Overview
- 12.1.2.2. Products
- 12.1.2.3. Company Financials
- 12.1.2.4. SWOT Analysis
- 12.1.3 Metropolitan Lifestyle (H K) Limited
- 12.1.3.1. Company Overview
- 12.1.3.2. Products
- 12.1.3.3. Company Financials
- 12.1.3.4. SWOT Analysis
- 12.1.4 Storefriendly Self Storage Group
- 12.1.4.1. Company Overview
- 12.1.4.2. Products
- 12.1.4.3. Company Financials
- 12.1.4.4. SWOT Analysis
- 12.1.5 Red Box Storage
- 12.1.5.1. Company Overview
- 12.1.5.2. Products
- 12.1.5.3. Company Financials
- 12.1.5.4. SWOT Analysis
- 12.1.6 Boxful Self Storage
- 12.1.6.1. Company Overview
- 12.1.6.2. Products
- 12.1.6.3. Company Financials
- 12.1.6.4. SWOT Analysis
- 12.1.7 Cube Self Storage
- 12.1.7.1. Company Overview
- 12.1.7.2. Products
- 12.1.7.3. Company Financials
- 12.1.7.4. SWOT Analysis
- 12.1.8 Apple Storage (tai Yau Storage Group Limited)
- 12.1.8.1. Company Overview
- 12.1.8.2. Products
- 12.1.8.3. Company Financials
- 12.1.8.4. SWOT Analysis
- 12.1.9 Spacebox Limited
- 12.1.9.1. Company Overview
- 12.1.9.2. Products
- 12.1.9.3. Company Financials
- 12.1.9.4. SWOT Analysis
- 12.1.10 In N Out Storage
- 12.1.10.1. Company Overview
- 12.1.10.2. Products
- 12.1.10.3. Company Financials
- 12.1.10.4. SWOT Analysis
- 12.1.11 Hongkong Storage
- 12.1.11.1. Company Overview
- 12.1.11.2. Products
- 12.1.11.3. Company Financials
- 12.1.11.4. SWOT Analysis
- 12.1.12 Storhub Self Storage*List Not Exhaustive
- 12.1.12.1. Company Overview
- 12.1.12.2. Products
- 12.1.12.3. Company Financials
- 12.1.12.4. SWOT Analysis
- 12.1.1 SC Storage
- 12.2. Market Entropy
- 12.2.1 Company's Key Areas Served
- 12.2.2 Recent Developments
- 12.3. Company Market Share Analysis 2025
- 12.3.1 Top 5 Companies Market Share Analysis
- 12.3.2 Top 3 Companies Market Share Analysis
- 12.4. List of Potential Customers
- 13. Research Methodology
List of Figures
- Figure 1: Global Hong Kong Storage Industry Revenue Breakdown (million, %) by Region 2025 & 2033
- Figure 2: Global Hong Kong Storage Industry Volume Breakdown (Million, %) by Region 2025 & 2033
- Figure 3: North America Hong Kong Storage Industry Revenue (million), by End User 2025 & 2033
- Figure 4: North America Hong Kong Storage Industry Volume (Million), by End User 2025 & 2033
- Figure 5: North America Hong Kong Storage Industry Revenue Share (%), by End User 2025 & 2033
- Figure 6: North America Hong Kong Storage Industry Volume Share (%), by End User 2025 & 2033
- Figure 7: North America Hong Kong Storage Industry Revenue (million), by Country 2025 & 2033
- Figure 8: North America Hong Kong Storage Industry Volume (Million), by Country 2025 & 2033
- Figure 9: North America Hong Kong Storage Industry Revenue Share (%), by Country 2025 & 2033
- Figure 10: North America Hong Kong Storage Industry Volume Share (%), by Country 2025 & 2033
- Figure 11: South America Hong Kong Storage Industry Revenue (million), by End User 2025 & 2033
- Figure 12: South America Hong Kong Storage Industry Volume (Million), by End User 2025 & 2033
- Figure 13: South America Hong Kong Storage Industry Revenue Share (%), by End User 2025 & 2033
- Figure 14: South America Hong Kong Storage Industry Volume Share (%), by End User 2025 & 2033
- Figure 15: South America Hong Kong Storage Industry Revenue (million), by Country 2025 & 2033
- Figure 16: South America Hong Kong Storage Industry Volume (Million), by Country 2025 & 2033
- Figure 17: South America Hong Kong Storage Industry Revenue Share (%), by Country 2025 & 2033
- Figure 18: South America Hong Kong Storage Industry Volume Share (%), by Country 2025 & 2033
- Figure 19: Europe Hong Kong Storage Industry Revenue (million), by End User 2025 & 2033
- Figure 20: Europe Hong Kong Storage Industry Volume (Million), by End User 2025 & 2033
- Figure 21: Europe Hong Kong Storage Industry Revenue Share (%), by End User 2025 & 2033
- Figure 22: Europe Hong Kong Storage Industry Volume Share (%), by End User 2025 & 2033
- Figure 23: Europe Hong Kong Storage Industry Revenue (million), by Country 2025 & 2033
- Figure 24: Europe Hong Kong Storage Industry Volume (Million), by Country 2025 & 2033
- Figure 25: Europe Hong Kong Storage Industry Revenue Share (%), by Country 2025 & 2033
- Figure 26: Europe Hong Kong Storage Industry Volume Share (%), by Country 2025 & 2033
- Figure 27: Middle East & Africa Hong Kong Storage Industry Revenue (million), by End User 2025 & 2033
- Figure 28: Middle East & Africa Hong Kong Storage Industry Volume (Million), by End User 2025 & 2033
- Figure 29: Middle East & Africa Hong Kong Storage Industry Revenue Share (%), by End User 2025 & 2033
- Figure 30: Middle East & Africa Hong Kong Storage Industry Volume Share (%), by End User 2025 & 2033
- Figure 31: Middle East & Africa Hong Kong Storage Industry Revenue (million), by Country 2025 & 2033
- Figure 32: Middle East & Africa Hong Kong Storage Industry Volume (Million), by Country 2025 & 2033
- Figure 33: Middle East & Africa Hong Kong Storage Industry Revenue Share (%), by Country 2025 & 2033
- Figure 34: Middle East & Africa Hong Kong Storage Industry Volume Share (%), by Country 2025 & 2033
- Figure 35: Asia Pacific Hong Kong Storage Industry Revenue (million), by End User 2025 & 2033
- Figure 36: Asia Pacific Hong Kong Storage Industry Volume (Million), by End User 2025 & 2033
- Figure 37: Asia Pacific Hong Kong Storage Industry Revenue Share (%), by End User 2025 & 2033
- Figure 38: Asia Pacific Hong Kong Storage Industry Volume Share (%), by End User 2025 & 2033
- Figure 39: Asia Pacific Hong Kong Storage Industry Revenue (million), by Country 2025 & 2033
- Figure 40: Asia Pacific Hong Kong Storage Industry Volume (Million), by Country 2025 & 2033
- Figure 41: Asia Pacific Hong Kong Storage Industry Revenue Share (%), by Country 2025 & 2033
- Figure 42: Asia Pacific Hong Kong Storage Industry Volume Share (%), by Country 2025 & 2033
List of Tables
- Table 1: Global Hong Kong Storage Industry Revenue million Forecast, by End User 2020 & 2033
- Table 2: Global Hong Kong Storage Industry Volume Million Forecast, by End User 2020 & 2033
- Table 3: Global Hong Kong Storage Industry Revenue million Forecast, by Region 2020 & 2033
- Table 4: Global Hong Kong Storage Industry Volume Million Forecast, by Region 2020 & 2033
- Table 5: Global Hong Kong Storage Industry Revenue million Forecast, by End User 2020 & 2033
- Table 6: Global Hong Kong Storage Industry Volume Million Forecast, by End User 2020 & 2033
- Table 7: Global Hong Kong Storage Industry Revenue million Forecast, by Country 2020 & 2033
- Table 8: Global Hong Kong Storage Industry Volume Million Forecast, by Country 2020 & 2033
- Table 9: United States Hong Kong Storage Industry Revenue (million) Forecast, by Application 2020 & 2033
- Table 10: United States Hong Kong Storage Industry Volume (Million) Forecast, by Application 2020 & 2033
- Table 11: Canada Hong Kong Storage Industry Revenue (million) Forecast, by Application 2020 & 2033
- Table 12: Canada Hong Kong Storage Industry Volume (Million) Forecast, by Application 2020 & 2033
- Table 13: Mexico Hong Kong Storage Industry Revenue (million) Forecast, by Application 2020 & 2033
- Table 14: Mexico Hong Kong Storage Industry Volume (Million) Forecast, by Application 2020 & 2033
- Table 15: Global Hong Kong Storage Industry Revenue million Forecast, by End User 2020 & 2033
- Table 16: Global Hong Kong Storage Industry Volume Million Forecast, by End User 2020 & 2033
- Table 17: Global Hong Kong Storage Industry Revenue million Forecast, by Country 2020 & 2033
- Table 18: Global Hong Kong Storage Industry Volume Million Forecast, by Country 2020 & 2033
- Table 19: Brazil Hong Kong Storage Industry Revenue (million) Forecast, by Application 2020 & 2033
- Table 20: Brazil Hong Kong Storage Industry Volume (Million) Forecast, by Application 2020 & 2033
- Table 21: Argentina Hong Kong Storage Industry Revenue (million) Forecast, by Application 2020 & 2033
- Table 22: Argentina Hong Kong Storage Industry Volume (Million) Forecast, by Application 2020 & 2033
- Table 23: Rest of South America Hong Kong Storage Industry Revenue (million) Forecast, by Application 2020 & 2033
- Table 24: Rest of South America Hong Kong Storage Industry Volume (Million) Forecast, by Application 2020 & 2033
- Table 25: Global Hong Kong Storage Industry Revenue million Forecast, by End User 2020 & 2033
- Table 26: Global Hong Kong Storage Industry Volume Million Forecast, by End User 2020 & 2033
- Table 27: Global Hong Kong Storage Industry Revenue million Forecast, by Country 2020 & 2033
- Table 28: Global Hong Kong Storage Industry Volume Million Forecast, by Country 2020 & 2033
- Table 29: United Kingdom Hong Kong Storage Industry Revenue (million) Forecast, by Application 2020 & 2033
- Table 30: United Kingdom Hong Kong Storage Industry Volume (Million) Forecast, by Application 2020 & 2033
- Table 31: Germany Hong Kong Storage Industry Revenue (million) Forecast, by Application 2020 & 2033
- Table 32: Germany Hong Kong Storage Industry Volume (Million) Forecast, by Application 2020 & 2033
- Table 33: France Hong Kong Storage Industry Revenue (million) Forecast, by Application 2020 & 2033
- Table 34: France Hong Kong Storage Industry Volume (Million) Forecast, by Application 2020 & 2033
- Table 35: Italy Hong Kong Storage Industry Revenue (million) Forecast, by Application 2020 & 2033
- Table 36: Italy Hong Kong Storage Industry Volume (Million) Forecast, by Application 2020 & 2033
- Table 37: Spain Hong Kong Storage Industry Revenue (million) Forecast, by Application 2020 & 2033
- Table 38: Spain Hong Kong Storage Industry Volume (Million) Forecast, by Application 2020 & 2033
- Table 39: Russia Hong Kong Storage Industry Revenue (million) Forecast, by Application 2020 & 2033
- Table 40: Russia Hong Kong Storage Industry Volume (Million) Forecast, by Application 2020 & 2033
- Table 41: Benelux Hong Kong Storage Industry Revenue (million) Forecast, by Application 2020 & 2033
- Table 42: Benelux Hong Kong Storage Industry Volume (Million) Forecast, by Application 2020 & 2033
- Table 43: Nordics Hong Kong Storage Industry Revenue (million) Forecast, by Application 2020 & 2033
- Table 44: Nordics Hong Kong Storage Industry Volume (Million) Forecast, by Application 2020 & 2033
- Table 45: Rest of Europe Hong Kong Storage Industry Revenue (million) Forecast, by Application 2020 & 2033
- Table 46: Rest of Europe Hong Kong Storage Industry Volume (Million) Forecast, by Application 2020 & 2033
- Table 47: Global Hong Kong Storage Industry Revenue million Forecast, by End User 2020 & 2033
- Table 48: Global Hong Kong Storage Industry Volume Million Forecast, by End User 2020 & 2033
- Table 49: Global Hong Kong Storage Industry Revenue million Forecast, by Country 2020 & 2033
- Table 50: Global Hong Kong Storage Industry Volume Million Forecast, by Country 2020 & 2033
- Table 51: Turkey Hong Kong Storage Industry Revenue (million) Forecast, by Application 2020 & 2033
- Table 52: Turkey Hong Kong Storage Industry Volume (Million) Forecast, by Application 2020 & 2033
- Table 53: Israel Hong Kong Storage Industry Revenue (million) Forecast, by Application 2020 & 2033
- Table 54: Israel Hong Kong Storage Industry Volume (Million) Forecast, by Application 2020 & 2033
- Table 55: GCC Hong Kong Storage Industry Revenue (million) Forecast, by Application 2020 & 2033
- Table 56: GCC Hong Kong Storage Industry Volume (Million) Forecast, by Application 2020 & 2033
- Table 57: North Africa Hong Kong Storage Industry Revenue (million) Forecast, by Application 2020 & 2033
- Table 58: North Africa Hong Kong Storage Industry Volume (Million) Forecast, by Application 2020 & 2033
- Table 59: South Africa Hong Kong Storage Industry Revenue (million) Forecast, by Application 2020 & 2033
- Table 60: South Africa Hong Kong Storage Industry Volume (Million) Forecast, by Application 2020 & 2033
- Table 61: Rest of Middle East & Africa Hong Kong Storage Industry Revenue (million) Forecast, by Application 2020 & 2033
- Table 62: Rest of Middle East & Africa Hong Kong Storage Industry Volume (Million) Forecast, by Application 2020 & 2033
- Table 63: Global Hong Kong Storage Industry Revenue million Forecast, by End User 2020 & 2033
- Table 64: Global Hong Kong Storage Industry Volume Million Forecast, by End User 2020 & 2033
- Table 65: Global Hong Kong Storage Industry Revenue million Forecast, by Country 2020 & 2033
- Table 66: Global Hong Kong Storage Industry Volume Million Forecast, by Country 2020 & 2033
- Table 67: China Hong Kong Storage Industry Revenue (million) Forecast, by Application 2020 & 2033
- Table 68: China Hong Kong Storage Industry Volume (Million) Forecast, by Application 2020 & 2033
- Table 69: India Hong Kong Storage Industry Revenue (million) Forecast, by Application 2020 & 2033
- Table 70: India Hong Kong Storage Industry Volume (Million) Forecast, by Application 2020 & 2033
- Table 71: Japan Hong Kong Storage Industry Revenue (million) Forecast, by Application 2020 & 2033
- Table 72: Japan Hong Kong Storage Industry Volume (Million) Forecast, by Application 2020 & 2033
- Table 73: South Korea Hong Kong Storage Industry Revenue (million) Forecast, by Application 2020 & 2033
- Table 74: South Korea Hong Kong Storage Industry Volume (Million) Forecast, by Application 2020 & 2033
- Table 75: ASEAN Hong Kong Storage Industry Revenue (million) Forecast, by Application 2020 & 2033
- Table 76: ASEAN Hong Kong Storage Industry Volume (Million) Forecast, by Application 2020 & 2033
- Table 77: Oceania Hong Kong Storage Industry Revenue (million) Forecast, by Application 2020 & 2033
- Table 78: Oceania Hong Kong Storage Industry Volume (Million) Forecast, by Application 2020 & 2033
- Table 79: Rest of Asia Pacific Hong Kong Storage Industry Revenue (million) Forecast, by Application 2020 & 2033
- Table 80: Rest of Asia Pacific Hong Kong Storage Industry Volume (Million) Forecast, by Application 2020 & 2033
Frequently Asked Questions
1. What is the projected Compound Annual Growth Rate (CAGR) of the Hong Kong Storage Industry?
The projected CAGR is approximately 8%.
2. Which companies are prominent players in the Hong Kong Storage Industry?
Key companies in the market include SC Storage, Extra Space Pte Ltd, Metropolitan Lifestyle (H K) Limited, Storefriendly Self Storage Group, Red Box Storage, Boxful Self Storage, Cube Self Storage, Apple Storage (tai Yau Storage Group Limited), Spacebox Limited, In N Out Storage, Hongkong Storage, Storhub Self Storage*List Not Exhaustive.
3. What are the main segments of the Hong Kong Storage Industry?
The market segments include End User.
4. Can you provide details about the market size?
The market size is estimated to be USD 3.96 million as of 2022.
5. What are some drivers contributing to market growth?
Growing Population Density is the Key Driver of the Market.
6. What are the notable trends driving market growth?
Personal Segment is Expected to Drive the Market.
7. Are there any restraints impacting market growth?
Lack of Enough Space to Build Self-storage Facilities.
8. Can you provide examples of recent developments in the market?
April 2023 - Storefriendly, the Asia self-storage operator backed by investment giant Blackstone, recently introduced its two latest locations at redeveloped properties on Hong Kong Island and in the New Territories.
9. What pricing options are available for accessing the report?
Pricing options include single-user, multi-user, and enterprise licenses priced at USD 3800, USD 4500, and USD 5800 respectively.
10. Is the market size provided in terms of value or volume?
The market size is provided in terms of value, measured in million and volume, measured in Million.
11. Are there any specific market keywords associated with the report?
Yes, the market keyword associated with the report is "Hong Kong Storage Industry," which aids in identifying and referencing the specific market segment covered.
12. How do I determine which pricing option suits my needs best?
The pricing options vary based on user requirements and access needs. Individual users may opt for single-user licenses, while businesses requiring broader access may choose multi-user or enterprise licenses for cost-effective access to the report.
13. Are there any additional resources or data provided in the Hong Kong Storage Industry report?
While the report offers comprehensive insights, it's advisable to review the specific contents or supplementary materials provided to ascertain if additional resources or data are available.
14. How can I stay updated on further developments or reports in the Hong Kong Storage Industry?
To stay informed about further developments, trends, and reports in the Hong Kong Storage Industry, consider subscribing to industry newsletters, following relevant companies and organizations, or regularly checking reputable industry news sources and publications.
Methodology
Step 1 - Identification of Relevant Samples Size from Population Database


Step 2 - Approaches for Defining Global Market Size (Value, Volume* & Price*)

Note*: In applicable scenarios
Step 3 - Data Sources
Primary Research
- Web Analytics
- Survey Reports
- Research Institute
- Latest Research Reports
- Opinion Leaders
Secondary Research
- Annual Reports
- White Paper
- Latest Press Release
- Industry Association
- Paid Database
- Investor Presentations

Step 4 - Data Triangulation
Involves using different sources of information in order to increase the validity of a study
These sources are likely to be stakeholders in a program - participants, other researchers, program staff, other community members, and so on.
Then we put all data in single framework & apply various statistical tools to find out the dynamic on the market.
During the analysis stage, feedback from the stakeholder groups would be compared to determine areas of agreement as well as areas of divergence