

Key Insights
The North American Solid State Drive (SSD) Caching Market is projected for substantial growth. With a market size of 52.94 billion in the base year 2025, the market is expected to expand at a Compound Annual Growth Rate (CAGR) of 14.94%. This expansion is fueled by the escalating demand for superior data access speeds and enhanced application performance in enterprise and consumer computing. Key growth catalysts include the surge in data-intensive applications, widespread cloud computing adoption, and the inherent performance advantages of SSDs over traditional HDDs in latency and throughput. Enterprises are increasingly deploying SSD caching to accelerate critical workloads, optimize storage investments, and elevate operational efficiency. For consumers, faster system boot times, rapid application loading, and a more responsive computing experience are driving adoption, particularly among gamers, content creators, and power users.
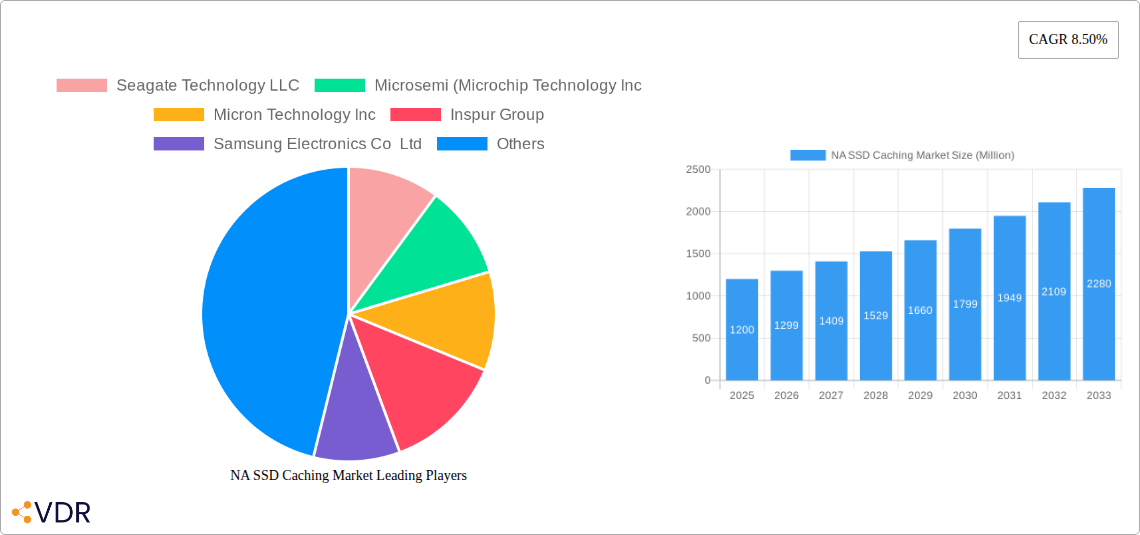
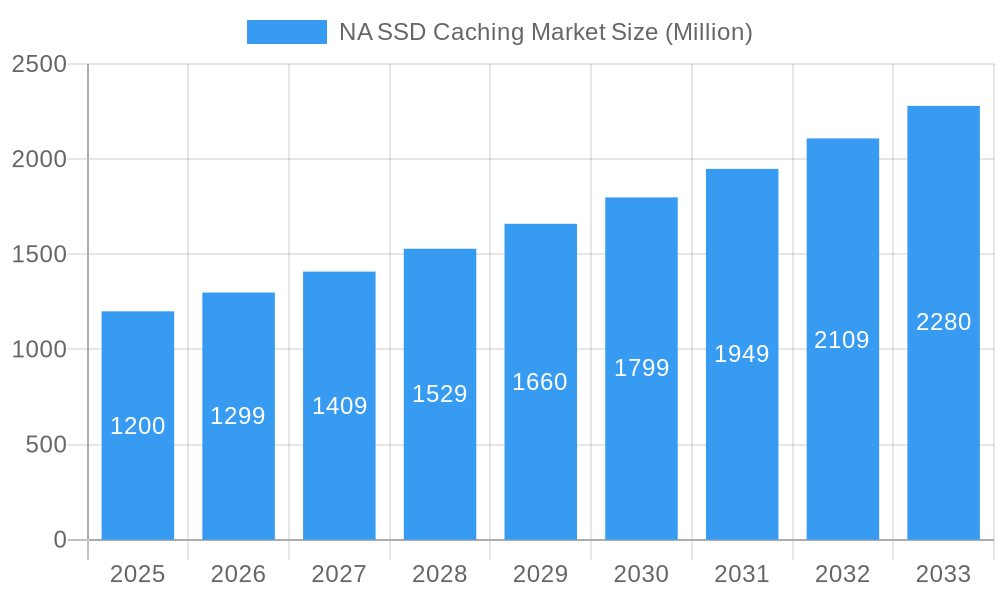
NA SSD Caching Market Market Size (In Billion)
While the growth outlook is positive, market restraints exist. The initial investment for SSDs, though decreasing, can still present a challenge for smaller businesses and budget-conscious consumers. Additionally, the intricacies of implementing and managing caching solutions, especially in large-scale enterprise deployments, may necessitate specialized technical skills. Nevertheless, innovations in caching software, intelligent data placement algorithms, and the increasing affordability of NAND flash memory are poised to address these limitations. The market is segmented into Enterprise Storage and Personal Storage. Currently, enterprise applications lead market share due to their critical reliance on high-performance computing. Emerging trends such as AI and machine learning integration for predictive caching, the ascendancy of NVMe SSDs for unparalleled performance, and the development of tiered storage solutions will continue to define the future of the North American SSD Caching Market.
NA SSD Caching Market Company Market Share
NA SSD Caching Market Report: Unleashing Performance and Driving Digital Transformation
This comprehensive report provides an in-depth analysis of the North American Solid State Drive (SSD) Caching market, a critical technology enabling enhanced data access speeds and overall system performance. Examining the period from 2019 to 2033, with a base year of 2025, this report delves into market dynamics, growth trends, dominant segments, product innovations, key players, and future opportunities. With a focus on enterprise storage and personal storage applications, this analysis leverages high-traffic keywords to maximize search engine visibility and deliver actionable insights for industry professionals.
NA SSD Caching Market Market Dynamics & Structure
The North American SSD Caching market is characterized by a moderately concentrated landscape, driven by continuous technological innovation and a robust demand for faster data processing. Key drivers include the escalating need for improved application performance in enterprise environments and the increasing adoption of high-speed storage solutions in personal computing. Regulatory frameworks, while not overtly restrictive, emphasize data security and privacy, influencing product development and deployment strategies. Competitive product substitutes, primarily traditional Hard Disk Drives (HDDs) and hybrid storage solutions, are being increasingly displaced by SSD caching's superior speed and efficiency. End-user demographics span a wide spectrum, from large enterprises requiring high-throughput data solutions to individual gamers and content creators seeking rapid load times. Mergers and acquisition (M&A) trends, while not extensively documented, are anticipated to consolidate market players and foster technological advancements.
- Market Concentration: Moderately concentrated, with a few key players holding significant market share.
- Technological Innovation: Driven by advancements in NAND flash technology, NVMe interfaces, and intelligent caching algorithms.
- Regulatory Frameworks: Focus on data security, privacy, and compliance standards, influencing product features and adoption.
- Competitive Substitutes: Traditional HDDs, hybrid drives, and increasingly, all-flash arrays are present, but SSD caching offers a compelling performance-per-dollar advantage for specific workloads.
- End-User Demographics: Broad appeal across enterprise (servers, storage arrays) and consumer (PCs, gaming rigs) segments.
- M&A Trends: Potential for consolidation to gain technological edge and market reach.
NA SSD Caching Market Growth Trends & Insights
The North American SSD Caching market is projected to experience robust growth, fueled by the ever-increasing volume of data generated and the insatiable demand for real-time data access. The market size evolution is characterized by a steady upward trajectory, with adoption rates accelerating as businesses and consumers recognize the tangible benefits of improved performance and reduced latency. Technological disruptions, such as the ongoing advancements in NVMe PCIe Gen4 and Gen5 interfaces, coupled with more sophisticated caching algorithms, are constantly pushing the boundaries of what's possible. Consumer behavior shifts are also playing a pivotal role, with a growing preference for faster boot times, quicker application loading, and seamless multitasking in both professional and personal computing environments. The forecast period is expected to witness a significant compound annual growth rate (CAGR) as the cost-effectiveness and performance advantages of SSD caching become more widely appreciated.
The market is expected to grow from approximately 750 million units in 2025 to an estimated 1,500 million units by 2033, exhibiting a CAGR of approximately 9.2% during the forecast period. This growth is underpinned by several factors:
- Accelerated Data Demands: The proliferation of big data analytics, AI/ML workloads, and cloud computing necessitates faster data retrieval, directly benefiting SSD caching solutions.
- Cost-Effectiveness: SSD caching provides a more economical pathway to achieving near-SSD performance for traditional HDD-based systems, making it an attractive upgrade option.
- Improved User Experience: For consumers, faster loading times for games, applications, and operating systems translate to a significantly enhanced digital experience.
- Enterprise Productivity Gains: In enterprise settings, reduced I/O latency directly translates to increased application responsiveness, improved productivity, and better resource utilization.
- Technological Advancements: Ongoing improvements in NAND flash density, endurance, and interface speeds (PCIe Gen4, Gen5) continue to enhance the capabilities and appeal of SSD caching.
- Market Penetration: While already significant in enterprise, the penetration in the personal storage segment is poised for substantial growth as prices continue to decline and awareness increases.
Dominant Regions, Countries, or Segments in NA SSD Caching Market
Within the North American SSD Caching market, the Enterprise Storage segment is unequivocally the dominant force driving market growth. This dominance stems from a confluence of factors, including substantial IT infrastructure investments by large corporations, the critical need for high-performance computing in data-intensive industries, and the availability of capital for technology upgrades. The United States, as the economic powerhouse of North America, spearheads this demand, with Canada and Mexico also contributing significantly.
Key drivers for the dominance of Enterprise Storage include:
- High-Performance Computing Demands: Industries such as finance, healthcare, manufacturing, and research heavily rely on rapid data access for complex simulations, real-time analytics, and large-scale database operations. SSD caching directly addresses these performance bottlenecks.
- Cloud Infrastructure Expansion: The massive build-out of data centers and cloud infrastructure by major tech giants necessitates highly efficient storage solutions to handle the immense data traffic and ensure low latency for cloud services.
- Big Data and Analytics Adoption: As businesses increasingly leverage big data for insights and decision-making, the ability to quickly process and analyze vast datasets becomes paramount, making SSD caching an indispensable component.
- Server Virtualization and Consolidation: The trend towards server virtualization and consolidation amplifies I/O demands on storage systems, where SSD caching plays a crucial role in optimizing performance.
- Government and Defense Sector Needs: National security, intelligence agencies, and research institutions often require extremely high-performance and secure data storage solutions, driving demand for advanced caching technologies.
- Economic Policies and Incentives: Favorable economic policies that encourage technological adoption and innovation within the US business landscape further bolster the enterprise segment's growth.
The market share within the Enterprise Storage segment is substantial, estimated to account for over 70% of the total NA SSD Caching market in 2025. The growth potential remains exceptionally high due to the continuous evolution of enterprise workloads and the ongoing digital transformation initiatives across all sectors.
NA SSD Caching Market Product Landscape
The NA SSD Caching market product landscape is defined by continuous innovation aimed at maximizing performance, endurance, and cost-effectiveness. Key product developments focus on integrating advanced NAND flash technologies, such as triple-level cell (TLC) and quad-level cell (QLC), with high-speed interfaces like PCIe Gen4 and the emerging Gen5. Intelligent caching algorithms, powered by sophisticated firmware, are crucial for optimizing data placement and retrieval, ensuring that frequently accessed data resides in the fastest tiers of storage. Performance metrics, including sequential and random read/write speeds, latency, and endurance (measured in terabytes written - TBW), are key differentiators. Products are tailored for various applications, from read-intensive enterprise workloads to mixed-use scenarios in personal computing, with unique selling propositions often revolving around enhanced I/O operations per second (IOPS) and improved total cost of ownership.
Key Drivers, Barriers & Challenges in NA SSD Caching Market
Key Drivers:
- Demand for Faster Data Access: The core driver remains the incessant need for quicker data retrieval and processing across enterprise and consumer applications.
- Advancements in NAND Flash Technology: Ongoing improvements in NAND density, performance, and endurance enable more efficient and cost-effective SSD caching solutions.
- Growth of Data-Intensive Workloads: Big data analytics, AI/ML, IoT, and cloud computing generate massive datasets, necessitating high-performance storage.
- Cost-Effectiveness for Performance Gains: SSD caching offers a more budget-friendly way to achieve significant performance improvements compared to all-flash arrays for certain use cases.
- Technological Evolution of Interfaces: The adoption of faster interfaces like NVMe PCIe Gen4 and Gen5 directly translates to higher throughput for SSD caching.
Barriers & Challenges:
- Endurance Limitations of QLC NAND: While cost-effective, QLC NAND flash has lower endurance compared to TLC, which can be a concern for write-intensive enterprise applications.
- Complexity of Cache Management: Optimizing cache algorithms to effectively manage data placement and eviction can be complex and require sophisticated software.
- Competition from All-Flash Arrays: As all-flash array prices decrease, they present a more direct, albeit often more expensive, alternative for high-performance needs.
- Supply Chain Disruptions: Global semiconductor shortages and geopolitical factors can impact the availability and pricing of components.
- Power Consumption Considerations: While generally efficient, high-performance caching solutions can still contribute to overall data center power consumption.
- Data Integrity and Recovery Concerns: Ensuring data integrity and robust recovery mechanisms in caching systems is paramount, especially in enterprise environments.
Emerging Opportunities in NA SSD Caching Market
Emerging opportunities in the NA SSD Caching market lie in the continued innovation of intelligent caching software that can dynamically adapt to changing workloads. The expansion of edge computing and the increasing demand for real-time data processing at the network's edge present a significant untapped market for compact and high-performance SSD caching solutions. Furthermore, the integration of AI-powered predictive caching algorithms that can anticipate data needs before they arise offers a revolutionary approach to performance optimization. The growing use of SSD caching in specialized applications, such as high-frequency trading platforms, scientific research, and advanced gaming, also presents lucrative avenues for growth. The development of more energy-efficient caching solutions will also appeal to data centers focused on sustainability.
Growth Accelerators in the NA SSD Caching Market Industry
Several key catalysts are expected to accelerate long-term growth in the NA SSD Caching market. Continuous advancements in NAND flash technology, leading to higher capacities and improved endurance at lower costs, will be a primary growth accelerator. Strategic partnerships between SSD manufacturers, server vendors, and software developers will foster tighter integration and more optimized caching solutions. The increasing adoption of data analytics, AI, and machine learning across all industries will necessitate faster data access, directly driving demand for SSD caching. Furthermore, the ongoing digital transformation initiatives by businesses of all sizes, coupled with government investments in digital infrastructure, will create sustained demand for high-performance storage technologies. The expanding ecosystem of NVMe-compatible devices and software will also facilitate broader adoption.
Key Players Shaping the NA SSD Caching Market Market
- Seagate Technology LLC
- Microsemi (Microchip Technology Inc)
- Micron Technology Inc
- Inspur Group
- Samsung Electronics Co Ltd
- Transcend Information Inc
- Kioxia (Toshiba Memory Corporation)
- ADATA Technology Co Ltd
- Western Digital Corporation
- SK Hynix Inc
- NetApp Inc
- Intel Corporation
- QNAP Systems Inc
Notable Milestones in NA SSD Caching Market Sector
- March 2021: Intel released the SSD 670p. This client SSD, a 144-layer quad-level cell-based device, offers up to two terabytes of storage. It is designed for everyday computing and extreme gaming, providing improved performance with 2-times sequential read speeds and a 20% endurance boost compared to its predecessor. It is optimized for low queue depth and mixed workloads.
- August 2020: Intel launched the SSD D7-P550/5600 Series. These enterprise-grade SSDs are built with an all-new Intel PCIe Gen4 controller and firmware, enhancing IT efficiency and data security. They deliver low latency, improved administration capabilities, scalability, and new NVMe features crucial for Enterprise and Cloud settings, designed for optimal performance and capacity in all-TLC arrays.
In-Depth NA SSD Caching Market Market Outlook
The NA SSD Caching market outlook remains exceptionally positive, driven by the persistent need for enhanced data performance and the continuous evolution of storage technologies. Future growth accelerators will include further advancements in NAND flash density and endurance, leading to more cost-effective and higher-capacity caching solutions. The expanding role of AI and machine learning in data analytics will continue to fuel demand for rapid data access, making SSD caching an indispensable component of modern IT infrastructure. Strategic partnerships and collaborations among key industry players are expected to foster more integrated and intelligent caching solutions. The ongoing digital transformation across all sectors, from enterprise to consumer, will create sustained demand for performance-enhancing technologies like SSD caching, positioning it for significant and sustained growth throughout the forecast period.
NA SSD Caching Market Segmentation
-
1. Application
- 1.1. Enterprise Storage
- 1.2. Personal Storage
NA SSD Caching Market Segmentation By Geography
-
1. North America
- 1.1. United States
- 1.2. Canada
- 1.3. Mexico
-
2. South America
- 2.1. Brazil
- 2.2. Argentina
- 2.3. Rest of South America
-
3. Europe
- 3.1. United Kingdom
- 3.2. Germany
- 3.3. France
- 3.4. Italy
- 3.5. Spain
- 3.6. Russia
- 3.7. Benelux
- 3.8. Nordics
- 3.9. Rest of Europe
-
4. Middle East & Africa
- 4.1. Turkey
- 4.2. Israel
- 4.3. GCC
- 4.4. North Africa
- 4.5. South Africa
- 4.6. Rest of Middle East & Africa
-
5. Asia Pacific
- 5.1. China
- 5.2. India
- 5.3. Japan
- 5.4. South Korea
- 5.5. ASEAN
- 5.6. Oceania
- 5.7. Rest of Asia Pacific
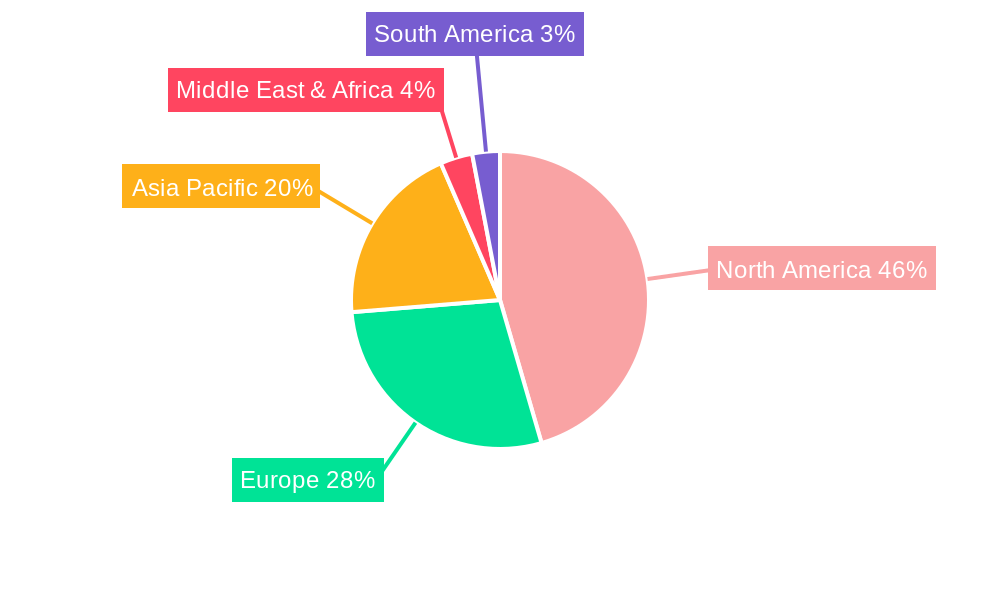
NA SSD Caching Market Regional Market Share
Geographic Coverage of NA SSD Caching Market
NA SSD Caching Market REPORT HIGHLIGHTS
| Aspects | Details |
|---|---|
| Study Period | 2020-2034 |
| Base Year | 2025 |
| Estimated Year | 2026 |
| Forecast Period | 2026-2034 |
| Historical Period | 2020-2025 |
| Growth Rate | CAGR of 14.94% from 2020-2034 |
| Segmentation |
|
Table of Contents
- 1. Introduction
- 1.1. Research Scope
- 1.2. Market Segmentation
- 1.3. Research Objective
- 1.4. Definitions and Assumptions
- 2. Executive Summary
- 2.1. Market Snapshot
- 3. Market Dynamics
- 3.1. Market Drivers
- 3.2. Market Restrains
- 3.3. Market Trends
- 3.4. Market Opportunities
- 4. Market Factor Analysis
- 4.1. Porters Five Forces
- 4.1.1. Bargaining Power of Suppliers
- 4.1.2. Bargaining Power of Buyers
- 4.1.3. Threat of New Entrants
- 4.1.4. Threat of Substitutes
- 4.1.5. Competitive Rivalry
- 4.2. PESTEL analysis
- 4.3. BCG Analysis
- 4.3.1. Stars (High Growth, High Market Share)
- 4.3.2. Cash Cows (Low Growth, High Market Share)
- 4.3.3. Question Mark (High Growth, Low Market Share)
- 4.3.4. Dogs (Low Growth, Low Market Share)
- 4.4. Ansoff Matrix Analysis
- 4.5. Supply Chain Analysis
- 4.6. Regulatory Landscape
- 4.7. Current Market Potential and Opportunity Assessment (TAM–SAM–SOM Framework)
- 4.8. VDR Analyst Note
- 4.1. Porters Five Forces
- 5. Market Analysis, Insights and Forecast 2021-2033
- 5.1. Market Analysis, Insights and Forecast - by Application
- 5.1.1. Enterprise Storage
- 5.1.2. Personal Storage
- 5.2. Market Analysis, Insights and Forecast - by Region
- 5.2.1. North America
- 5.2.2. South America
- 5.2.3. Europe
- 5.2.4. Middle East & Africa
- 5.2.5. Asia Pacific
- 5.1. Market Analysis, Insights and Forecast - by Application
- 6. Global NA SSD Caching Market Analysis, Insights and Forecast, 2021-2033
- 6.1. Market Analysis, Insights and Forecast - by Application
- 6.1.1. Enterprise Storage
- 6.1.2. Personal Storage
- 6.1. Market Analysis, Insights and Forecast - by Application
- 7. North America NA SSD Caching Market Analysis, Insights and Forecast, 2021-2033
- 7.1. Market Analysis, Insights and Forecast - by Application
- 7.1.1. Enterprise Storage
- 7.1.2. Personal Storage
- 7.1. Market Analysis, Insights and Forecast - by Application
- 8. South America NA SSD Caching Market Analysis, Insights and Forecast, 2021-2033
- 8.1. Market Analysis, Insights and Forecast - by Application
- 8.1.1. Enterprise Storage
- 8.1.2. Personal Storage
- 8.1. Market Analysis, Insights and Forecast - by Application
- 9. Europe NA SSD Caching Market Analysis, Insights and Forecast, 2021-2033
- 9.1. Market Analysis, Insights and Forecast - by Application
- 9.1.1. Enterprise Storage
- 9.1.2. Personal Storage
- 9.1. Market Analysis, Insights and Forecast - by Application
- 10. Middle East & Africa NA SSD Caching Market Analysis, Insights and Forecast, 2021-2033
- 10.1. Market Analysis, Insights and Forecast - by Application
- 10.1.1. Enterprise Storage
- 10.1.2. Personal Storage
- 10.1. Market Analysis, Insights and Forecast - by Application
- 11. Asia Pacific NA SSD Caching Market Analysis, Insights and Forecast, 2021-2033
- 11.1. Market Analysis, Insights and Forecast - by Application
- 11.1.1. Enterprise Storage
- 11.1.2. Personal Storage
- 11.1. Market Analysis, Insights and Forecast - by Application
- 12. Competitive Analysis
- 12.1. Company Profiles
- 12.1.1 Seagate Technology LLC
- 12.1.1.1. Company Overview
- 12.1.1.2. Products
- 12.1.1.3. Company Financials
- 12.1.1.4. SWOT Analysis
- 12.1.2 Microsemi (Microchip Technology Inc
- 12.1.2.1. Company Overview
- 12.1.2.2. Products
- 12.1.2.3. Company Financials
- 12.1.2.4. SWOT Analysis
- 12.1.3 Micron Technology Inc
- 12.1.3.1. Company Overview
- 12.1.3.2. Products
- 12.1.3.3. Company Financials
- 12.1.3.4. SWOT Analysis
- 12.1.4 Inspur Group
- 12.1.4.1. Company Overview
- 12.1.4.2. Products
- 12.1.4.3. Company Financials
- 12.1.4.4. SWOT Analysis
- 12.1.5 Samsung Electronics Co Ltd
- 12.1.5.1. Company Overview
- 12.1.5.2. Products
- 12.1.5.3. Company Financials
- 12.1.5.4. SWOT Analysis
- 12.1.6 Transcend Information Inc
- 12.1.6.1. Company Overview
- 12.1.6.2. Products
- 12.1.6.3. Company Financials
- 12.1.6.4. SWOT Analysis
- 12.1.7 Kioxia (Toshiba Memory Corporation)
- 12.1.7.1. Company Overview
- 12.1.7.2. Products
- 12.1.7.3. Company Financials
- 12.1.7.4. SWOT Analysis
- 12.1.8 ADATA Technology Co Ltd
- 12.1.8.1. Company Overview
- 12.1.8.2. Products
- 12.1.8.3. Company Financials
- 12.1.8.4. SWOT Analysis
- 12.1.9 Western Digital Corporation
- 12.1.9.1. Company Overview
- 12.1.9.2. Products
- 12.1.9.3. Company Financials
- 12.1.9.4. SWOT Analysis
- 12.1.10 SK Hynix Inc
- 12.1.10.1. Company Overview
- 12.1.10.2. Products
- 12.1.10.3. Company Financials
- 12.1.10.4. SWOT Analysis
- 12.1.11 NetApp Inc
- 12.1.11.1. Company Overview
- 12.1.11.2. Products
- 12.1.11.3. Company Financials
- 12.1.11.4. SWOT Analysis
- 12.1.12 Intel Corporation
- 12.1.12.1. Company Overview
- 12.1.12.2. Products
- 12.1.12.3. Company Financials
- 12.1.12.4. SWOT Analysis
- 12.1.13 QNAP Systems Inc
- 12.1.13.1. Company Overview
- 12.1.13.2. Products
- 12.1.13.3. Company Financials
- 12.1.13.4. SWOT Analysis
- 12.1.1 Seagate Technology LLC
- 12.2. Market Entropy
- 12.2.1 Company's Key Areas Served
- 12.2.2 Recent Developments
- 12.3. Company Market Share Analysis 2025
- 12.3.1 Top 5 Companies Market Share Analysis
- 12.3.2 Top 3 Companies Market Share Analysis
- 12.4. List of Potential Customers
- 13. Research Methodology
List of Figures
- Figure 1: Global NA SSD Caching Market Revenue Breakdown (billion, %) by Region 2025 & 2033
- Figure 2: North America NA SSD Caching Market Revenue (billion), by Application 2025 & 2033
- Figure 3: North America NA SSD Caching Market Revenue Share (%), by Application 2025 & 2033
- Figure 4: North America NA SSD Caching Market Revenue (billion), by Country 2025 & 2033
- Figure 5: North America NA SSD Caching Market Revenue Share (%), by Country 2025 & 2033
- Figure 6: South America NA SSD Caching Market Revenue (billion), by Application 2025 & 2033
- Figure 7: South America NA SSD Caching Market Revenue Share (%), by Application 2025 & 2033
- Figure 8: South America NA SSD Caching Market Revenue (billion), by Country 2025 & 2033
- Figure 9: South America NA SSD Caching Market Revenue Share (%), by Country 2025 & 2033
- Figure 10: Europe NA SSD Caching Market Revenue (billion), by Application 2025 & 2033
- Figure 11: Europe NA SSD Caching Market Revenue Share (%), by Application 2025 & 2033
- Figure 12: Europe NA SSD Caching Market Revenue (billion), by Country 2025 & 2033
- Figure 13: Europe NA SSD Caching Market Revenue Share (%), by Country 2025 & 2033
- Figure 14: Middle East & Africa NA SSD Caching Market Revenue (billion), by Application 2025 & 2033
- Figure 15: Middle East & Africa NA SSD Caching Market Revenue Share (%), by Application 2025 & 2033
- Figure 16: Middle East & Africa NA SSD Caching Market Revenue (billion), by Country 2025 & 2033
- Figure 17: Middle East & Africa NA SSD Caching Market Revenue Share (%), by Country 2025 & 2033
- Figure 18: Asia Pacific NA SSD Caching Market Revenue (billion), by Application 2025 & 2033
- Figure 19: Asia Pacific NA SSD Caching Market Revenue Share (%), by Application 2025 & 2033
- Figure 20: Asia Pacific NA SSD Caching Market Revenue (billion), by Country 2025 & 2033
- Figure 21: Asia Pacific NA SSD Caching Market Revenue Share (%), by Country 2025 & 2033
List of Tables
- Table 1: Global NA SSD Caching Market Revenue billion Forecast, by Application 2020 & 2033
- Table 2: Global NA SSD Caching Market Revenue billion Forecast, by Region 2020 & 2033
- Table 3: Global NA SSD Caching Market Revenue billion Forecast, by Application 2020 & 2033
- Table 4: Global NA SSD Caching Market Revenue billion Forecast, by Country 2020 & 2033
- Table 5: United States NA SSD Caching Market Revenue (billion) Forecast, by Application 2020 & 2033
- Table 6: Canada NA SSD Caching Market Revenue (billion) Forecast, by Application 2020 & 2033
- Table 7: Mexico NA SSD Caching Market Revenue (billion) Forecast, by Application 2020 & 2033
- Table 8: Global NA SSD Caching Market Revenue billion Forecast, by Application 2020 & 2033
- Table 9: Global NA SSD Caching Market Revenue billion Forecast, by Country 2020 & 2033
- Table 10: Brazil NA SSD Caching Market Revenue (billion) Forecast, by Application 2020 & 2033
- Table 11: Argentina NA SSD Caching Market Revenue (billion) Forecast, by Application 2020 & 2033
- Table 12: Rest of South America NA SSD Caching Market Revenue (billion) Forecast, by Application 2020 & 2033
- Table 13: Global NA SSD Caching Market Revenue billion Forecast, by Application 2020 & 2033
- Table 14: Global NA SSD Caching Market Revenue billion Forecast, by Country 2020 & 2033
- Table 15: United Kingdom NA SSD Caching Market Revenue (billion) Forecast, by Application 2020 & 2033
- Table 16: Germany NA SSD Caching Market Revenue (billion) Forecast, by Application 2020 & 2033
- Table 17: France NA SSD Caching Market Revenue (billion) Forecast, by Application 2020 & 2033
- Table 18: Italy NA SSD Caching Market Revenue (billion) Forecast, by Application 2020 & 2033
- Table 19: Spain NA SSD Caching Market Revenue (billion) Forecast, by Application 2020 & 2033
- Table 20: Russia NA SSD Caching Market Revenue (billion) Forecast, by Application 2020 & 2033
- Table 21: Benelux NA SSD Caching Market Revenue (billion) Forecast, by Application 2020 & 2033
- Table 22: Nordics NA SSD Caching Market Revenue (billion) Forecast, by Application 2020 & 2033
- Table 23: Rest of Europe NA SSD Caching Market Revenue (billion) Forecast, by Application 2020 & 2033
- Table 24: Global NA SSD Caching Market Revenue billion Forecast, by Application 2020 & 2033
- Table 25: Global NA SSD Caching Market Revenue billion Forecast, by Country 2020 & 2033
- Table 26: Turkey NA SSD Caching Market Revenue (billion) Forecast, by Application 2020 & 2033
- Table 27: Israel NA SSD Caching Market Revenue (billion) Forecast, by Application 2020 & 2033
- Table 28: GCC NA SSD Caching Market Revenue (billion) Forecast, by Application 2020 & 2033
- Table 29: North Africa NA SSD Caching Market Revenue (billion) Forecast, by Application 2020 & 2033
- Table 30: South Africa NA SSD Caching Market Revenue (billion) Forecast, by Application 2020 & 2033
- Table 31: Rest of Middle East & Africa NA SSD Caching Market Revenue (billion) Forecast, by Application 2020 & 2033
- Table 32: Global NA SSD Caching Market Revenue billion Forecast, by Application 2020 & 2033
- Table 33: Global NA SSD Caching Market Revenue billion Forecast, by Country 2020 & 2033
- Table 34: China NA SSD Caching Market Revenue (billion) Forecast, by Application 2020 & 2033
- Table 35: India NA SSD Caching Market Revenue (billion) Forecast, by Application 2020 & 2033
- Table 36: Japan NA SSD Caching Market Revenue (billion) Forecast, by Application 2020 & 2033
- Table 37: South Korea NA SSD Caching Market Revenue (billion) Forecast, by Application 2020 & 2033
- Table 38: ASEAN NA SSD Caching Market Revenue (billion) Forecast, by Application 2020 & 2033
- Table 39: Oceania NA SSD Caching Market Revenue (billion) Forecast, by Application 2020 & 2033
- Table 40: Rest of Asia Pacific NA SSD Caching Market Revenue (billion) Forecast, by Application 2020 & 2033
Frequently Asked Questions
1. What is the projected Compound Annual Growth Rate (CAGR) of the NA SSD Caching Market?
The projected CAGR is approximately 14.94%.
2. Which companies are prominent players in the NA SSD Caching Market?
Key companies in the market include Seagate Technology LLC, Microsemi (Microchip Technology Inc, Micron Technology Inc, Inspur Group, Samsung Electronics Co Ltd, Transcend Information Inc, Kioxia (Toshiba Memory Corporation), ADATA Technology Co Ltd, Western Digital Corporation, SK Hynix Inc, NetApp Inc, Intel Corporation, QNAP Systems Inc.
3. What are the main segments of the NA SSD Caching Market?
The market segments include Application.
4. Can you provide details about the market size?
The market size is estimated to be USD 52.94 billion as of 2022.
5. What are some drivers contributing to market growth?
Improvements Offered by SSDs Over Conventional HDDs.
6. What are the notable trends driving market growth?
Enterprise Storage Expected to Hold Major Share.
7. Are there any restraints impacting market growth?
Slow Pace in Development of Applications Despite Heavy investments in R&D; Commplexities in Hardware Designing.
8. Can you provide examples of recent developments in the market?
March 2021 - A Solid State Drive (SSD) 670p has been released by Intel. The client SSD is a 144-layer quad-level cell-based device. The SSD can hold up to two terabytes of data in a single drive. According to Intel, SSDs can be used to supplement everyday computing needs and assist extreme gaming. When compared to the previous generation Intel QLC 3D NAND SSD, the new SSD 670p is said to give improved performance, including a 2-times sequential read and a 20% endurance boost. To meet normal processing demands, the Intel SSD 670p has been optimized for low queue depth and mixed workloads.
9. What pricing options are available for accessing the report?
Pricing options include single-user, multi-user, and enterprise licenses priced at USD 3800, USD 4500, and USD 5800 respectively.
10. Is the market size provided in terms of value or volume?
The market size is provided in terms of value, measured in billion.
11. Are there any specific market keywords associated with the report?
Yes, the market keyword associated with the report is "NA SSD Caching Market," which aids in identifying and referencing the specific market segment covered.
12. How do I determine which pricing option suits my needs best?
The pricing options vary based on user requirements and access needs. Individual users may opt for single-user licenses, while businesses requiring broader access may choose multi-user or enterprise licenses for cost-effective access to the report.
13. Are there any additional resources or data provided in the NA SSD Caching Market report?
While the report offers comprehensive insights, it's advisable to review the specific contents or supplementary materials provided to ascertain if additional resources or data are available.
14. How can I stay updated on further developments or reports in the NA SSD Caching Market?
To stay informed about further developments, trends, and reports in the NA SSD Caching Market, consider subscribing to industry newsletters, following relevant companies and organizations, or regularly checking reputable industry news sources and publications.
Methodology
Step 1 - Identification of Relevant Samples Size from Population Database


Step 2 - Approaches for Defining Global Market Size (Value, Volume* & Price*)

Note*: In applicable scenarios
Step 3 - Data Sources
Primary Research
- Web Analytics
- Survey Reports
- Research Institute
- Latest Research Reports
- Opinion Leaders
Secondary Research
- Annual Reports
- White Paper
- Latest Press Release
- Industry Association
- Paid Database
- Investor Presentations

Step 4 - Data Triangulation
Involves using different sources of information in order to increase the validity of a study
These sources are likely to be stakeholders in a program - participants, other researchers, program staff, other community members, and so on.
Then we put all data in single framework & apply various statistical tools to find out the dynamic on the market.
During the analysis stage, feedback from the stakeholder groups would be compared to determine areas of agreement as well as areas of divergence