
Key Insights
The Telecom Expense Management (TEM) industry is experiencing robust growth, projected to reach a market size of $4.33 billion in 2025 and maintain a Compound Annual Growth Rate (CAGR) of 14.26% from 2025 to 2033. This expansion is driven by several key factors. Firstly, the increasing complexity of telecom services and contracts necessitates efficient management solutions. Businesses, particularly large enterprises across sectors like BFSI, Consumer Goods & Retail, and Manufacturing, are adopting TEM solutions to optimize spending, improve visibility into telecom expenses, and streamline procurement processes. Secondly, the rise of cloud-based and managed TEM services is fueling market growth, offering scalability, flexibility, and reduced IT infrastructure costs. Furthermore, the increasing adoption of 5G technology and the Internet of Things (IoT) is generating a larger volume of telecom expenses, thereby increasing the demand for sophisticated TEM solutions to manage this complexity. The hosted service model is expected to hold a significant market share due to its ease of implementation and cost-effectiveness.
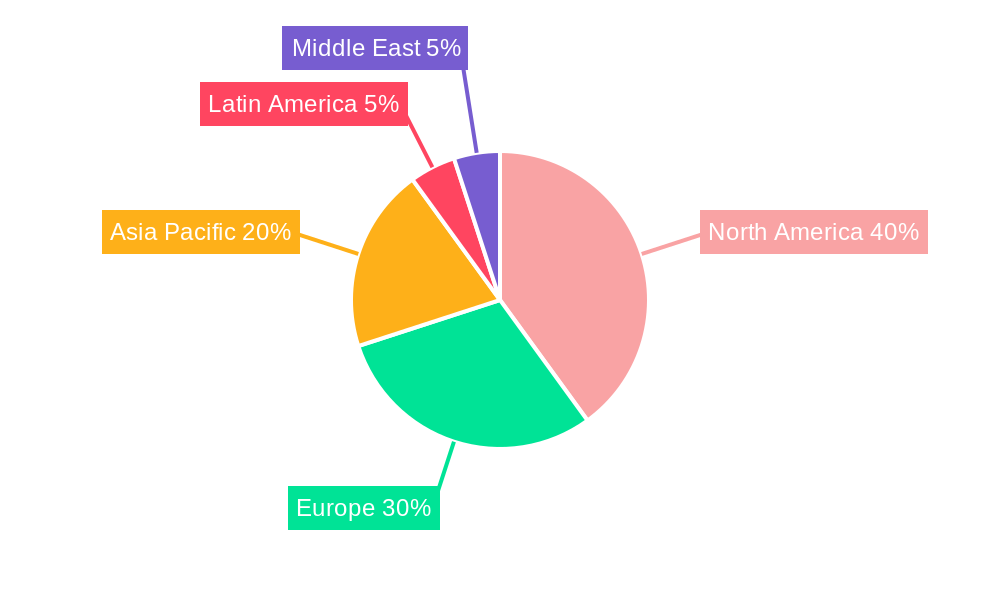
Geographic expansion also contributes significantly to market growth. While North America currently holds a leading position, the Asia-Pacific region is expected to witness substantial growth due to the increasing adoption of advanced technologies and rising telecom spending in developing economies. However, challenges remain. The high initial investment costs associated with implementing TEM solutions can deter smaller businesses. Also, ensuring data security and compliance with evolving regulations pose ongoing concerns for TEM providers. Despite these restraints, the industry's long-term outlook remains positive, driven by the unrelenting growth in telecom usage and the need for cost optimization within organizations globally. The market segmentation across solutions (Invoice Management, Sourcing Management, etc.) and services (Hosted, Managed) offers multiple avenues for growth and innovation within the TEM landscape.

Telecom Expense Management (TEM) Market Report: 2019-2033
This comprehensive report provides an in-depth analysis of the Telecom Expense Management (TEM) industry, encompassing market dynamics, growth trends, regional dominance, product landscape, key players, and future outlook. The report covers the parent market of Telecom Expense Management and its child markets within various segments. The study period spans from 2019 to 2033, with 2025 as the base and estimated year. The market size is presented in millions of units.
Telecom Expense Management Industry Market Dynamics & Structure
The global Telecom Expense Management (TEM) market, a sector valued at [Insert Updated Market Value in 2024] Million, exhibits a moderately consolidated structure. While a few major players hold significant market share, a vibrant ecosystem of smaller, niche providers fuels intense competition. The market's growth trajectory is significantly propelled by technological advancements, particularly in automation and artificial intelligence (AI). Stringent regulatory landscapes, focused on telecom data privacy and security, heavily influence market dynamics. Furthermore, the market faces competitive pressures from substitute products, including cloud-based solutions offering comparable functionalities. The primary end-user demographic comprises large enterprises across diverse sectors, directly shaping market demand. Mergers and acquisitions (M&A) activity within the TEM sector remains moderate, with transactions primarily targeting the expansion of service offerings and technological capabilities.
- Market Concentration: Moderately Consolidated (Top 5 players hold approximately [Insert Updated Percentage] market share)
- Technological Innovation: AI, Automation, Cloud Computing, and advanced analytics are key growth drivers.
- Regulatory Framework: GDPR, CCPA, and other data privacy and security regulations significantly impact market operations and solution development.
- Competitive Substitutes: Cloud-based solutions, internally developed TEM systems, and simplified telecom billing platforms offer alternative solutions.
- M&A Activity: Moderate, driven by expansion of services, technological acquisition, and strategic market positioning. [Insert Updated Number] M&A deals were recorded between 2019-2024.
Telecom Expense Management Industry Growth Trends & Insights
The TEM market experienced significant growth between 2019 and 2024, driven by increasing telecom expenses, the need for enhanced cost optimization, and the adoption of advanced technologies. The market is projected to continue its upward trajectory, with a Compound Annual Growth Rate (CAGR) of xx% from 2025 to 2033, reaching xx Million by 2033. This growth is fueled by the rising adoption of cloud-based TEM solutions, increasing mobile data usage, and the growing complexity of telecom services. Technological disruptions, such as AI-powered invoice processing and predictive analytics, further accelerate market growth. Consumer behavior is shifting towards demand for greater transparency and control over telecom costs, contributing to the rise in TEM adoption. Market penetration is expected to increase from xx% in 2025 to xx% by 2033.

Dominant Regions, Countries, or Segments in Telecom Expense Management Industry
North America currently retains the largest market share within the TEM industry, fueled by substantial telecom spending and the early adoption of cutting-edge technologies. Among the various segments, Invoice Management remains the dominant area, followed by Sourcing Management and Contract Lifecycle Management. The BFSI (Banking, Financial Services, and Insurance) and IT & Telecom end-user industries consistently represent the most significant contributors to market revenue.
- Leading Region: North America (Market share: [Insert Updated Percentage]%)
- Dominant Segment (by solution): Invoice Management (Market share: [Insert Updated Percentage]%)
- Key End-user Industry: BFSI and IT & Telecom (Combined market share: [Insert Updated Percentage]%)
- Drivers: High telecom spending in North America, robust IT infrastructure, increasingly stringent regulatory compliance requirements, and the persistent need for efficient cost management within BFSI and IT & Telecom sectors.
Telecom Expense Management Industry Product Landscape
The TEM product landscape is diverse, encompassing a wide range of solutions, including cloud-based platforms, on-premise systems, and specialized modules designed for invoice management, sourcing optimization, contract negotiation, and dispute resolution. Product innovation is heavily focused on enhancing automation capabilities, refining data analytics functionalities, and integrating robust AI-powered features for predictive analysis and anomaly detection. Key value propositions consistently highlight cost savings, improved operational efficiency, enhanced visibility into telecom spending patterns, and streamlined business processes. Technological advancements continually drive improvements in accuracy, processing speed, and the quality of reporting functionalities.
Key Drivers, Barriers & Challenges in Telecom Expense Management Industry
Key Drivers: Rising telecom expenses, need for cost optimization, increasing regulatory compliance, and adoption of advanced technologies like AI and automation.
Challenges: High initial implementation costs, complexity of integration with existing systems, lack of skilled professionals, and data security concerns. The market faces challenges from xx% year-on-year increase in the price of cloud services impacting the SaaS market of TEM solutions.
Emerging Opportunities in Telecom Expense Management Industry
The proliferation of 5G and the Internet of Things (IoT) presents significant opportunities for TEM providers to effectively manage the rising complexity of network costs associated with these technologies. The expansion of TEM services to small and medium-sized enterprises (SMEs) represents a substantial untapped market segment with considerable growth potential. Innovative applications, such as AI-driven predictive analytics for optimizing telecom spending and blockchain technology for ensuring secure data management, offer promising avenues for future market expansion.
Growth Accelerators in the Telecom Expense Management Industry
Strategic partnerships between TEM providers and telecom operators are actively driving market growth by enhancing service offerings and expanding market reach. Significant technological breakthroughs in AI and machine learning are continuously improving automation capabilities, resulting in substantial cost optimization and enhanced efficiency. The strategic expansion of TEM services into new geographical regions and underserved market segments, such as SMEs, is a key factor contributing to overall market growth. The increasing adoption of cloud-based solutions is also significantly accelerating market expansion.
Key Players Shaping the Telecom Expense Management Industry Market
- Auditel Inc
- Valicom Corporation
- Tangoe Inc
- Avotus Corporation
- Calero-MDSL
- CGI Inc
- WidePoint Solutions Corporation
- Upland Software Inc (Cimpl)
- Sakon Inc
- TeleManagement Technologies Inc
Notable Milestones in Telecom Expense Management Industry Sector
- September 2023: Prodapt partners with ServiceNow to expand its TMT business, driving digital workflows for CSPs.
- November 2022: Renodis acquires 12 Points Consulting, enhancing its telecom and utility management services.
- September 2022: Tangoe integrates robotic process automation, improving data processing efficiency.
In-Depth Telecom Expense Management Industry Market Outlook
The TEM market is poised for continued growth, driven by technological advancements, strategic partnerships, and expanding market penetration. The focus on AI-powered solutions, cloud-based platforms, and the increasing demand for cost optimization present significant strategic opportunities for market players. The potential for growth within the SME segment and expansion into new geographical areas remains substantial, shaping the future trajectory of the TEM market.
Telecom Expense Management Industry Segmentation
-
1. Solution
- 1.1. Invoice Management
- 1.2. Sourcing Management
- 1.3. Business Management
- 1.4. Dispute Management
- 1.5. Other Solutions
-
2. Service
- 2.1. Hosted Service
- 2.2. Managed Service
-
3. End-user Industry
- 3.1. BFSI
- 3.2. Consumer Goods & Retail
- 3.3. Manufacturing
- 3.4. IT & Telecom
- 3.5. Healthcare
- 3.6. Other End-user Industries
Telecom Expense Management Industry Segmentation By Geography
- 1. North America
- 2. Europe
- 3. Asia Pacific
- 4. Latin America
- 5. Middle East
Telecom Expense Management Industry REPORT HIGHLIGHTS
| Aspects | Details |
|---|---|
| Study Period | 2019-2033 |
| Base Year | 2024 |
| Estimated Year | 2025 |
| Forecast Period | 2025-2033 |
| Historical Period | 2019-2024 |
| Growth Rate | CAGR of 14.26% from 2019-2033 |
| Segmentation |
|
Table of Contents
- 1. Introduction
- 1.1. Research Scope
- 1.2. Market Segmentation
- 1.3. Research Methodology
- 1.4. Definitions and Assumptions
- 2. Executive Summary
- 2.1. Introduction
- 3. Market Dynamics
- 3.1. Introduction
- 3.2. Market Drivers
- 3.2.1. Increasing Adoption of Mobile Phones and Other Portable Devices; Significant Cost Reduction and Expense Visibility
- 3.3. Market Restrains
- 3.3.1. Lack of Interoperability Due to Set Industry Standards
- 3.4. Market Trends
- 3.4.1. BFSI Segment is Expected to Gain Significant Traction
- 4. Market Factor Analysis
- 4.1. Porters Five Forces
- 4.2. Supply/Value Chain
- 4.3. PESTEL analysis
- 4.4. Market Entropy
- 4.5. Patent/Trademark Analysis
- 5. Global Telecom Expense Management Industry Analysis, Insights and Forecast, 2019-2031
- 5.1. Market Analysis, Insights and Forecast - by Solution
- 5.1.1. Invoice Management
- 5.1.2. Sourcing Management
- 5.1.3. Business Management
- 5.1.4. Dispute Management
- 5.1.5. Other Solutions
- 5.2. Market Analysis, Insights and Forecast - by Service
- 5.2.1. Hosted Service
- 5.2.2. Managed Service
- 5.3. Market Analysis, Insights and Forecast - by End-user Industry
- 5.3.1. BFSI
- 5.3.2. Consumer Goods & Retail
- 5.3.3. Manufacturing
- 5.3.4. IT & Telecom
- 5.3.5. Healthcare
- 5.3.6. Other End-user Industries
- 5.4. Market Analysis, Insights and Forecast - by Region
- 5.4.1. North America
- 5.4.2. Europe
- 5.4.3. Asia Pacific
- 5.4.4. Latin America
- 5.4.5. Middle East
- 5.1. Market Analysis, Insights and Forecast - by Solution
- 6. North America Telecom Expense Management Industry Analysis, Insights and Forecast, 2019-2031
- 6.1. Market Analysis, Insights and Forecast - by Solution
- 6.1.1. Invoice Management
- 6.1.2. Sourcing Management
- 6.1.3. Business Management
- 6.1.4. Dispute Management
- 6.1.5. Other Solutions
- 6.2. Market Analysis, Insights and Forecast - by Service
- 6.2.1. Hosted Service
- 6.2.2. Managed Service
- 6.3. Market Analysis, Insights and Forecast - by End-user Industry
- 6.3.1. BFSI
- 6.3.2. Consumer Goods & Retail
- 6.3.3. Manufacturing
- 6.3.4. IT & Telecom
- 6.3.5. Healthcare
- 6.3.6. Other End-user Industries
- 6.1. Market Analysis, Insights and Forecast - by Solution
- 7. Europe Telecom Expense Management Industry Analysis, Insights and Forecast, 2019-2031
- 7.1. Market Analysis, Insights and Forecast - by Solution
- 7.1.1. Invoice Management
- 7.1.2. Sourcing Management
- 7.1.3. Business Management
- 7.1.4. Dispute Management
- 7.1.5. Other Solutions
- 7.2. Market Analysis, Insights and Forecast - by Service
- 7.2.1. Hosted Service
- 7.2.2. Managed Service
- 7.3. Market Analysis, Insights and Forecast - by End-user Industry
- 7.3.1. BFSI
- 7.3.2. Consumer Goods & Retail
- 7.3.3. Manufacturing
- 7.3.4. IT & Telecom
- 7.3.5. Healthcare
- 7.3.6. Other End-user Industries
- 7.1. Market Analysis, Insights and Forecast - by Solution
- 8. Asia Pacific Telecom Expense Management Industry Analysis, Insights and Forecast, 2019-2031
- 8.1. Market Analysis, Insights and Forecast - by Solution
- 8.1.1. Invoice Management
- 8.1.2. Sourcing Management
- 8.1.3. Business Management
- 8.1.4. Dispute Management
- 8.1.5. Other Solutions
- 8.2. Market Analysis, Insights and Forecast - by Service
- 8.2.1. Hosted Service
- 8.2.2. Managed Service
- 8.3. Market Analysis, Insights and Forecast - by End-user Industry
- 8.3.1. BFSI
- 8.3.2. Consumer Goods & Retail
- 8.3.3. Manufacturing
- 8.3.4. IT & Telecom
- 8.3.5. Healthcare
- 8.3.6. Other End-user Industries
- 8.1. Market Analysis, Insights and Forecast - by Solution
- 9. Latin America Telecom Expense Management Industry Analysis, Insights and Forecast, 2019-2031
- 9.1. Market Analysis, Insights and Forecast - by Solution
- 9.1.1. Invoice Management
- 9.1.2. Sourcing Management
- 9.1.3. Business Management
- 9.1.4. Dispute Management
- 9.1.5. Other Solutions
- 9.2. Market Analysis, Insights and Forecast - by Service
- 9.2.1. Hosted Service
- 9.2.2. Managed Service
- 9.3. Market Analysis, Insights and Forecast - by End-user Industry
- 9.3.1. BFSI
- 9.3.2. Consumer Goods & Retail
- 9.3.3. Manufacturing
- 9.3.4. IT & Telecom
- 9.3.5. Healthcare
- 9.3.6. Other End-user Industries
- 9.1. Market Analysis, Insights and Forecast - by Solution
- 10. Middle East Telecom Expense Management Industry Analysis, Insights and Forecast, 2019-2031
- 10.1. Market Analysis, Insights and Forecast - by Solution
- 10.1.1. Invoice Management
- 10.1.2. Sourcing Management
- 10.1.3. Business Management
- 10.1.4. Dispute Management
- 10.1.5. Other Solutions
- 10.2. Market Analysis, Insights and Forecast - by Service
- 10.2.1. Hosted Service
- 10.2.2. Managed Service
- 10.3. Market Analysis, Insights and Forecast - by End-user Industry
- 10.3.1. BFSI
- 10.3.2. Consumer Goods & Retail
- 10.3.3. Manufacturing
- 10.3.4. IT & Telecom
- 10.3.5. Healthcare
- 10.3.6. Other End-user Industries
- 10.1. Market Analysis, Insights and Forecast - by Solution
- 11. North America Telecom Expense Management Industry Analysis, Insights and Forecast, 2019-2031
- 11.1. Market Analysis, Insights and Forecast - By Country/Sub-region
- 11.1.1.
- 12. Europe Telecom Expense Management Industry Analysis, Insights and Forecast, 2019-2031
- 12.1. Market Analysis, Insights and Forecast - By Country/Sub-region
- 12.1.1.
- 13. Asia Pacific Telecom Expense Management Industry Analysis, Insights and Forecast, 2019-2031
- 13.1. Market Analysis, Insights and Forecast - By Country/Sub-region
- 13.1.1.
- 14. Latin America Telecom Expense Management Industry Analysis, Insights and Forecast, 2019-2031
- 14.1. Market Analysis, Insights and Forecast - By Country/Sub-region
- 14.1.1.
- 15. Middle East Telecom Expense Management Industry Analysis, Insights and Forecast, 2019-2031
- 15.1. Market Analysis, Insights and Forecast - By Country/Sub-region
- 15.1.1.
- 16. Competitive Analysis
- 16.1. Global Market Share Analysis 2024
- 16.2. Company Profiles
- 16.2.1 Auditel Inc *List Not Exhaustive
- 16.2.1.1. Overview
- 16.2.1.2. Products
- 16.2.1.3. SWOT Analysis
- 16.2.1.4. Recent Developments
- 16.2.1.5. Financials (Based on Availability)
- 16.2.2 Valicom Corporation
- 16.2.2.1. Overview
- 16.2.2.2. Products
- 16.2.2.3. SWOT Analysis
- 16.2.2.4. Recent Developments
- 16.2.2.5. Financials (Based on Availability)
- 16.2.3 Tangoe Inc
- 16.2.3.1. Overview
- 16.2.3.2. Products
- 16.2.3.3. SWOT Analysis
- 16.2.3.4. Recent Developments
- 16.2.3.5. Financials (Based on Availability)
- 16.2.4 Avotus Corporation
- 16.2.4.1. Overview
- 16.2.4.2. Products
- 16.2.4.3. SWOT Analysis
- 16.2.4.4. Recent Developments
- 16.2.4.5. Financials (Based on Availability)
- 16.2.5 Calero-MDSL
- 16.2.5.1. Overview
- 16.2.5.2. Products
- 16.2.5.3. SWOT Analysis
- 16.2.5.4. Recent Developments
- 16.2.5.5. Financials (Based on Availability)
- 16.2.6 CGI Inc
- 16.2.6.1. Overview
- 16.2.6.2. Products
- 16.2.6.3. SWOT Analysis
- 16.2.6.4. Recent Developments
- 16.2.6.5. Financials (Based on Availability)
- 16.2.7 WidePoint Solutions Corporation
- 16.2.7.1. Overview
- 16.2.7.2. Products
- 16.2.7.3. SWOT Analysis
- 16.2.7.4. Recent Developments
- 16.2.7.5. Financials (Based on Availability)
- 16.2.8 Upland Software Inc (Cimpl)
- 16.2.8.1. Overview
- 16.2.8.2. Products
- 16.2.8.3. SWOT Analysis
- 16.2.8.4. Recent Developments
- 16.2.8.5. Financials (Based on Availability)
- 16.2.9 Sakon Inc
- 16.2.9.1. Overview
- 16.2.9.2. Products
- 16.2.9.3. SWOT Analysis
- 16.2.9.4. Recent Developments
- 16.2.9.5. Financials (Based on Availability)
- 16.2.10 TeleManagement Technologies Inc
- 16.2.10.1. Overview
- 16.2.10.2. Products
- 16.2.10.3. SWOT Analysis
- 16.2.10.4. Recent Developments
- 16.2.10.5. Financials (Based on Availability)
- 16.2.1 Auditel Inc *List Not Exhaustive
List of Figures
- Figure 1: Global Telecom Expense Management Industry Revenue Breakdown (Million, %) by Region 2024 & 2032
- Figure 2: North America Telecom Expense Management Industry Revenue (Million), by Country 2024 & 2032
- Figure 3: North America Telecom Expense Management Industry Revenue Share (%), by Country 2024 & 2032
- Figure 4: Europe Telecom Expense Management Industry Revenue (Million), by Country 2024 & 2032
- Figure 5: Europe Telecom Expense Management Industry Revenue Share (%), by Country 2024 & 2032
- Figure 6: Asia Pacific Telecom Expense Management Industry Revenue (Million), by Country 2024 & 2032
- Figure 7: Asia Pacific Telecom Expense Management Industry Revenue Share (%), by Country 2024 & 2032
- Figure 8: Latin America Telecom Expense Management Industry Revenue (Million), by Country 2024 & 2032
- Figure 9: Latin America Telecom Expense Management Industry Revenue Share (%), by Country 2024 & 2032
- Figure 10: Middle East Telecom Expense Management Industry Revenue (Million), by Country 2024 & 2032
- Figure 11: Middle East Telecom Expense Management Industry Revenue Share (%), by Country 2024 & 2032
- Figure 12: North America Telecom Expense Management Industry Revenue (Million), by Solution 2024 & 2032
- Figure 13: North America Telecom Expense Management Industry Revenue Share (%), by Solution 2024 & 2032
- Figure 14: North America Telecom Expense Management Industry Revenue (Million), by Service 2024 & 2032
- Figure 15: North America Telecom Expense Management Industry Revenue Share (%), by Service 2024 & 2032
- Figure 16: North America Telecom Expense Management Industry Revenue (Million), by End-user Industry 2024 & 2032
- Figure 17: North America Telecom Expense Management Industry Revenue Share (%), by End-user Industry 2024 & 2032
- Figure 18: North America Telecom Expense Management Industry Revenue (Million), by Country 2024 & 2032
- Figure 19: North America Telecom Expense Management Industry Revenue Share (%), by Country 2024 & 2032
- Figure 20: Europe Telecom Expense Management Industry Revenue (Million), by Solution 2024 & 2032
- Figure 21: Europe Telecom Expense Management Industry Revenue Share (%), by Solution 2024 & 2032
- Figure 22: Europe Telecom Expense Management Industry Revenue (Million), by Service 2024 & 2032
- Figure 23: Europe Telecom Expense Management Industry Revenue Share (%), by Service 2024 & 2032
- Figure 24: Europe Telecom Expense Management Industry Revenue (Million), by End-user Industry 2024 & 2032
- Figure 25: Europe Telecom Expense Management Industry Revenue Share (%), by End-user Industry 2024 & 2032
- Figure 26: Europe Telecom Expense Management Industry Revenue (Million), by Country 2024 & 2032
- Figure 27: Europe Telecom Expense Management Industry Revenue Share (%), by Country 2024 & 2032
- Figure 28: Asia Pacific Telecom Expense Management Industry Revenue (Million), by Solution 2024 & 2032
- Figure 29: Asia Pacific Telecom Expense Management Industry Revenue Share (%), by Solution 2024 & 2032
- Figure 30: Asia Pacific Telecom Expense Management Industry Revenue (Million), by Service 2024 & 2032
- Figure 31: Asia Pacific Telecom Expense Management Industry Revenue Share (%), by Service 2024 & 2032
- Figure 32: Asia Pacific Telecom Expense Management Industry Revenue (Million), by End-user Industry 2024 & 2032
- Figure 33: Asia Pacific Telecom Expense Management Industry Revenue Share (%), by End-user Industry 2024 & 2032
- Figure 34: Asia Pacific Telecom Expense Management Industry Revenue (Million), by Country 2024 & 2032
- Figure 35: Asia Pacific Telecom Expense Management Industry Revenue Share (%), by Country 2024 & 2032
- Figure 36: Latin America Telecom Expense Management Industry Revenue (Million), by Solution 2024 & 2032
- Figure 37: Latin America Telecom Expense Management Industry Revenue Share (%), by Solution 2024 & 2032
- Figure 38: Latin America Telecom Expense Management Industry Revenue (Million), by Service 2024 & 2032
- Figure 39: Latin America Telecom Expense Management Industry Revenue Share (%), by Service 2024 & 2032
- Figure 40: Latin America Telecom Expense Management Industry Revenue (Million), by End-user Industry 2024 & 2032
- Figure 41: Latin America Telecom Expense Management Industry Revenue Share (%), by End-user Industry 2024 & 2032
- Figure 42: Latin America Telecom Expense Management Industry Revenue (Million), by Country 2024 & 2032
- Figure 43: Latin America Telecom Expense Management Industry Revenue Share (%), by Country 2024 & 2032
- Figure 44: Middle East Telecom Expense Management Industry Revenue (Million), by Solution 2024 & 2032
- Figure 45: Middle East Telecom Expense Management Industry Revenue Share (%), by Solution 2024 & 2032
- Figure 46: Middle East Telecom Expense Management Industry Revenue (Million), by Service 2024 & 2032
- Figure 47: Middle East Telecom Expense Management Industry Revenue Share (%), by Service 2024 & 2032
- Figure 48: Middle East Telecom Expense Management Industry Revenue (Million), by End-user Industry 2024 & 2032
- Figure 49: Middle East Telecom Expense Management Industry Revenue Share (%), by End-user Industry 2024 & 2032
- Figure 50: Middle East Telecom Expense Management Industry Revenue (Million), by Country 2024 & 2032
- Figure 51: Middle East Telecom Expense Management Industry Revenue Share (%), by Country 2024 & 2032
List of Tables
- Table 1: Global Telecom Expense Management Industry Revenue Million Forecast, by Region 2019 & 2032
- Table 2: Global Telecom Expense Management Industry Revenue Million Forecast, by Solution 2019 & 2032
- Table 3: Global Telecom Expense Management Industry Revenue Million Forecast, by Service 2019 & 2032
- Table 4: Global Telecom Expense Management Industry Revenue Million Forecast, by End-user Industry 2019 & 2032
- Table 5: Global Telecom Expense Management Industry Revenue Million Forecast, by Region 2019 & 2032
- Table 6: Global Telecom Expense Management Industry Revenue Million Forecast, by Country 2019 & 2032
- Table 7: Telecom Expense Management Industry Revenue (Million) Forecast, by Application 2019 & 2032
- Table 8: Global Telecom Expense Management Industry Revenue Million Forecast, by Country 2019 & 2032
- Table 9: Telecom Expense Management Industry Revenue (Million) Forecast, by Application 2019 & 2032
- Table 10: Global Telecom Expense Management Industry Revenue Million Forecast, by Country 2019 & 2032
- Table 11: Telecom Expense Management Industry Revenue (Million) Forecast, by Application 2019 & 2032
- Table 12: Global Telecom Expense Management Industry Revenue Million Forecast, by Country 2019 & 2032
- Table 13: Telecom Expense Management Industry Revenue (Million) Forecast, by Application 2019 & 2032
- Table 14: Global Telecom Expense Management Industry Revenue Million Forecast, by Country 2019 & 2032
- Table 15: Telecom Expense Management Industry Revenue (Million) Forecast, by Application 2019 & 2032
- Table 16: Global Telecom Expense Management Industry Revenue Million Forecast, by Solution 2019 & 2032
- Table 17: Global Telecom Expense Management Industry Revenue Million Forecast, by Service 2019 & 2032
- Table 18: Global Telecom Expense Management Industry Revenue Million Forecast, by End-user Industry 2019 & 2032
- Table 19: Global Telecom Expense Management Industry Revenue Million Forecast, by Country 2019 & 2032
- Table 20: Global Telecom Expense Management Industry Revenue Million Forecast, by Solution 2019 & 2032
- Table 21: Global Telecom Expense Management Industry Revenue Million Forecast, by Service 2019 & 2032
- Table 22: Global Telecom Expense Management Industry Revenue Million Forecast, by End-user Industry 2019 & 2032
- Table 23: Global Telecom Expense Management Industry Revenue Million Forecast, by Country 2019 & 2032
- Table 24: Global Telecom Expense Management Industry Revenue Million Forecast, by Solution 2019 & 2032
- Table 25: Global Telecom Expense Management Industry Revenue Million Forecast, by Service 2019 & 2032
- Table 26: Global Telecom Expense Management Industry Revenue Million Forecast, by End-user Industry 2019 & 2032
- Table 27: Global Telecom Expense Management Industry Revenue Million Forecast, by Country 2019 & 2032
- Table 28: Global Telecom Expense Management Industry Revenue Million Forecast, by Solution 2019 & 2032
- Table 29: Global Telecom Expense Management Industry Revenue Million Forecast, by Service 2019 & 2032
- Table 30: Global Telecom Expense Management Industry Revenue Million Forecast, by End-user Industry 2019 & 2032
- Table 31: Global Telecom Expense Management Industry Revenue Million Forecast, by Country 2019 & 2032
- Table 32: Global Telecom Expense Management Industry Revenue Million Forecast, by Solution 2019 & 2032
- Table 33: Global Telecom Expense Management Industry Revenue Million Forecast, by Service 2019 & 2032
- Table 34: Global Telecom Expense Management Industry Revenue Million Forecast, by End-user Industry 2019 & 2032
- Table 35: Global Telecom Expense Management Industry Revenue Million Forecast, by Country 2019 & 2032
Frequently Asked Questions
1. What is the projected Compound Annual Growth Rate (CAGR) of the Telecom Expense Management Industry?
The projected CAGR is approximately 14.26%.
2. Which companies are prominent players in the Telecom Expense Management Industry?
Key companies in the market include Auditel Inc *List Not Exhaustive, Valicom Corporation, Tangoe Inc, Avotus Corporation, Calero-MDSL, CGI Inc, WidePoint Solutions Corporation, Upland Software Inc (Cimpl), Sakon Inc, TeleManagement Technologies Inc.
3. What are the main segments of the Telecom Expense Management Industry?
The market segments include Solution, Service, End-user Industry.
4. Can you provide details about the market size?
The market size is estimated to be USD 4.33 Million as of 2022.
5. What are some drivers contributing to market growth?
Increasing Adoption of Mobile Phones and Other Portable Devices; Significant Cost Reduction and Expense Visibility.
6. What are the notable trends driving market growth?
BFSI Segment is Expected to Gain Significant Traction.
7. Are there any restraints impacting market growth?
Lack of Interoperability Due to Set Industry Standards.
8. Can you provide examples of recent developments in the market?
September 2023: Prodapt, one of the largest and fastest-growing specialized firms in the Connectedness industry, partnered to enable ServiceNow to expand its telecom, media, and tech (TMT) business to assist Communication Service Providers (CSPs). The expanded scope would drive digital workflows for greater operational agility, enhanced productivity, and intuitive customer experiences.
9. What pricing options are available for accessing the report?
Pricing options include single-user, multi-user, and enterprise licenses priced at USD 4750, USD 5250, and USD 8750 respectively.
10. Is the market size provided in terms of value or volume?
The market size is provided in terms of value, measured in Million.
11. Are there any specific market keywords associated with the report?
Yes, the market keyword associated with the report is "Telecom Expense Management Industry," which aids in identifying and referencing the specific market segment covered.
12. How do I determine which pricing option suits my needs best?
The pricing options vary based on user requirements and access needs. Individual users may opt for single-user licenses, while businesses requiring broader access may choose multi-user or enterprise licenses for cost-effective access to the report.
13. Are there any additional resources or data provided in the Telecom Expense Management Industry report?
While the report offers comprehensive insights, it's advisable to review the specific contents or supplementary materials provided to ascertain if additional resources or data are available.
14. How can I stay updated on further developments or reports in the Telecom Expense Management Industry?
To stay informed about further developments, trends, and reports in the Telecom Expense Management Industry, consider subscribing to industry newsletters, following relevant companies and organizations, or regularly checking reputable industry news sources and publications.
Methodology
Step 1 - Identification of Relevant Samples Size from Population Database


Step 2 - Approaches for Defining Global Market Size (Value, Volume* & Price*)

Note*: In applicable scenarios
Step 3 - Data Sources
Primary Research
- Web Analytics
- Survey Reports
- Research Institute
- Latest Research Reports
- Opinion Leaders
Secondary Research
- Annual Reports
- White Paper
- Latest Press Release
- Industry Association
- Paid Database
- Investor Presentations

Step 4 - Data Triangulation
Involves using different sources of information in order to increase the validity of a study
These sources are likely to be stakeholders in a program - participants, other researchers, program staff, other community members, and so on.
Then we put all data in single framework & apply various statistical tools to find out the dynamic on the market.
During the analysis stage, feedback from the stakeholder groups would be compared to determine areas of agreement as well as areas of divergence


