
Key Insights
The OLED microdisplay market is experiencing explosive growth, projected to reach a value of $0.73 billion in 2025 and exhibiting a remarkable Compound Annual Growth Rate (CAGR) of 60.20%. This surge is driven by several key factors. Firstly, the increasing demand for high-resolution, energy-efficient displays in diverse applications like augmented reality (AR) and virtual reality (VR) headsets is a major catalyst. Advancements in OLED technology, leading to improved brightness, contrast ratios, and reduced power consumption, are further fueling market expansion. The miniaturization of OLED displays also opens doors for integration into smaller and more portable devices, enhancing user experience across various sectors. Furthermore, the growing adoption of OLED microdisplays in automotive applications, particularly for heads-up displays (HUDs) and instrument clusters, contributes significantly to market growth. The healthcare sector is also witnessing increasing adoption for medical visualization and surgical applications.
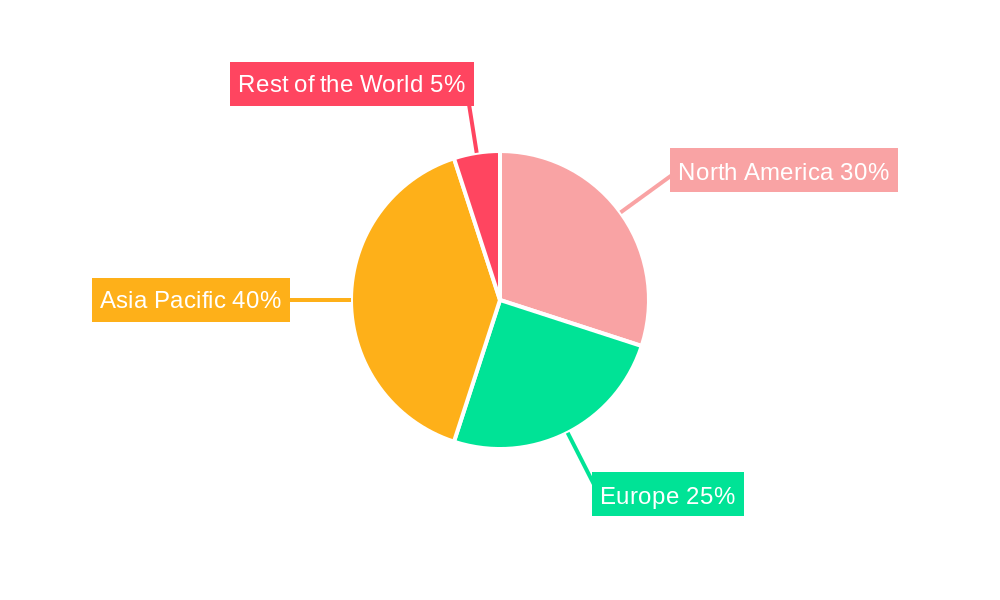
Segmentation reveals a dynamic market landscape. Near-to-eye displays dominate the type segment, driven by the aforementioned AR/VR boom. Among end-user industries, automotive leads in adoption, followed closely by the healthcare and consumer electronics sectors. While the Asia Pacific region is expected to hold a significant market share due to its robust electronics manufacturing base and burgeoning consumer demand, North America and Europe also contribute substantially, driven by technological innovation and early adoption. However, challenges remain. High manufacturing costs and potential supply chain disruptions could act as restraints to future growth. Nevertheless, continuous technological improvements and the expanding application base are anticipated to mitigate these limitations, ensuring the continued expansion of the OLED microdisplay market throughout the forecast period (2025-2033).

OLED Microdisplay Market: A Comprehensive Market Report (2019-2033)
This comprehensive report provides a detailed analysis of the OLED Microdisplay market, encompassing market dynamics, growth trends, regional dominance, product landscape, challenges, opportunities, and key players. The study period covers 2019-2033, with 2025 as the base and estimated year. The report segments the market by type (Near-to-eye, Projections) and end-user industry (Automotive, Healthcare, Industrial, Consumer Electronics, Aerospace & Defense, Law Enforcement, Other End-user Industries), offering a granular view of this rapidly evolving sector. Expect detailed insights into market size (in million units), CAGR, and market penetration rates, empowering strategic decision-making for industry professionals.
OLED Microdisplay Market Dynamics & Structure
This section delves into the intricate structure of the OLED microdisplay market, analyzing market concentration, technological innovation drivers, and regulatory landscapes. We examine the competitive dynamics, including the impact of mergers & acquisitions (M&A) and the presence of substitute products. End-user demographics and their evolving needs are also explored.
- Market Concentration: The OLED microdisplay market exhibits a moderately concentrated structure, with a few key players holding significant market share. Precise percentages are detailed within the full report.
- Technological Innovation: Continuous advancements in micro-OLED technology, such as improved resolution, brightness, and power efficiency, are major drivers of market expansion. Innovation barriers include high manufacturing costs and the need for specialized equipment.
- Regulatory Landscape: Government regulations related to safety and environmental standards in various end-use industries (e.g., automotive, aerospace) influence market growth and product development. Specific regulatory details are provided within the report.
- M&A Activity: The past five years have witnessed xx M&A deals in the OLED microdisplay market, indicating consolidation and strategic growth initiatives amongst key players. A detailed breakdown of these activities, including deal values and rationale, is included in the report.
- Competitive Substitutes: LCD and other microdisplay technologies compete with OLED microdisplays. The competitive advantage of OLEDs lies in their superior image quality and power efficiency, although pricing remains a factor. A comparative analysis is presented in the full report.
OLED Microdisplay Market Growth Trends & Insights
This section provides a thorough analysis of the OLED microdisplay market’s evolution, using data from 2019 to 2033. We examine market size, adoption rates, and the impact of technological advancements on market growth. Shifts in consumer preferences and behaviors are also investigated, providing valuable insights for businesses in the industry. The detailed report includes specific metrics like CAGR and market penetration rates to illustrate the market's trajectory. The market is expected to reach xx million units by 2033, driven by factors such as increasing demand from the consumer electronics and automotive sectors.

Dominant Regions, Countries, or Segments in OLED Microdisplay Market
This section identifies leading regions, countries, and market segments driving growth within the OLED microdisplay market. The analysis includes detailed breakdown by both Type (Near-to-eye and Projections) and End-user Industry (Automotive, Healthcare, Industrial, Consumer Electronics, Aerospace & Defense, Law Enforcement, and Others).
- North America is anticipated to hold the largest market share due to strong demand from the defense and consumer electronics sectors.
- Asia Pacific is projected to witness the highest CAGR, primarily driven by the rapidly growing consumer electronics market in countries like China and South Korea.
- Europe is expected to exhibit steady growth, owing to increasing adoption in automotive applications and advancements in healthcare technologies.
- The Near-to-eye segment currently dominates by type, given its prevalence in VR/AR headsets and other wearable devices.
- The Automotive segment dominates by end-user industry, primarily driven by the rise of Advanced Driver-Assistance Systems (ADAS) and infotainment systems. Specific market share data and growth projections for each segment and region are available in the complete report.
OLED Microdisplay Market Product Landscape
The OLED microdisplay market showcases a diverse range of products tailored to specific applications, from high-resolution displays for augmented reality (AR) headsets to compact solutions for medical imaging devices. Recent innovations are focused not only on enhancing resolution, brightness, and power efficiency, but also on addressing critical manufacturing challenges to reduce costs and increase production yield. These advancements translate to superior image quality, increasingly miniaturized form factors, and broader adoption across diverse end-user industries, including defense, medical, automotive, and consumer electronics. The market report provides a comprehensive product catalog with detailed specifications and a comparative performance benchmark analysis, enabling informed decision-making for businesses seeking to integrate OLED microdisplays into their products.
Key Drivers, Barriers & Challenges in OLED Microdisplay Market
Key Drivers:
- Increasing demand from consumer electronics (VR/AR headsets, smartphones) and automotive industries (head-up displays).
- Technological advancements leading to higher resolution, improved brightness, and lower power consumption.
- Government initiatives promoting the development and adoption of advanced display technologies.
Key Challenges:
- High manufacturing costs and complex fabrication processes.
- Competition from alternative display technologies (LCD, microLED).
- Supply chain disruptions affecting component availability and pricing.
Emerging Opportunities in OLED Microdisplay Market
Emerging trends such as the growth of the extended reality (XR) market, advancements in micro-LED technology, and the increasing demand for high-resolution displays in automotive applications present significant opportunities for growth in the OLED microdisplay market. Furthermore, untapped markets in developing economies hold substantial potential.
Growth Accelerators in the OLED Microdisplay Market Industry
Long-term growth in the OLED microdisplay market will be driven by strategic partnerships between display manufacturers and end-user industries, continuous technological innovation, and expansion into new application areas such as medical imaging and augmented reality. The report further highlights the impact of emerging technologies, such as micro-LED, and their potential to influence the future market landscape.
Key Players Shaping the OLED Microdisplay Market Market
- Sunlike Display Technology Corporation
- Wisechip Semiconductor Inc
- eMagin Corporation
- Microoled SA (Photonis Technologies SAS)
- Seiko Epson Corporation
- Sony Semiconductor Solutions Corp (Sony Corporation)
- Fraunhofer FEP
- Winstar Display Co Ltd
- Yunnan Olightek Opto-electronic Technology Co Ltd
- Kopin Corporation
Notable Milestones in OLED Microdisplay Market Sector
- February 2024: Kopin Corporation secured orders exceeding USD 3 million for simulated thermal sights integrated into armored vehicle training systems, underscoring the burgeoning demand within the defense and simulation sectors. This highlights the increasing importance of high-performance, compact displays for military applications.
- July 2023: MicroOLED SA received EUR 21 million (USD 22.97 million) in funding, signifying substantial investor confidence and providing the resources necessary for further technological advancements and expansion of their market reach. This investment underscores the significant growth potential seen in the OLED microdisplay sector.
- [Add another milestone here with date and description - Example: October 2023: Company X announced a new microdisplay with improved power efficiency]
In-Depth OLED Microdisplay Market Market Outlook
The OLED microdisplay market is poised for significant growth in the coming years, driven by ongoing technological advancements, the increasing adoption of AR/VR technology, and the expansion of applications in automotive and other sectors. Strategic partnerships and investments in R&D will be crucial factors in shaping the future of the market. The report concludes with a detailed forecast outlining the market's potential and key strategic opportunities for players seeking to capitalize on this expanding landscape.
OLED Microdisplay Market Segmentation
-
1. Type
- 1.1. Near-to-eye
- 1.2. Projections
-
2. End-user Industry
- 2.1. Automotive
- 2.2. Healthcare
- 2.3. Industrial
- 2.4. Consumer Electronics
- 2.5. Aerospace and Defense
- 2.6. Law Enforcement
- 2.7. Other End-user Industries
OLED Microdisplay Market Segmentation By Geography
- 1. North America
- 2. Europe
- 3. Asia
- 4. Australia and New Zealand
- 5. Latin America
- 6. Middle East and Africa
OLED Microdisplay Market REPORT HIGHLIGHTS
| Aspects | Details |
|---|---|
| Study Period | 2019-2033 |
| Base Year | 2024 |
| Estimated Year | 2025 |
| Forecast Period | 2025-2033 |
| Historical Period | 2019-2024 |
| Growth Rate | CAGR of 60.20% from 2019-2033 |
| Segmentation |
|
Table of Contents
- 1. Introduction
- 1.1. Research Scope
- 1.2. Market Segmentation
- 1.3. Research Methodology
- 1.4. Definitions and Assumptions
- 2. Executive Summary
- 2.1. Introduction
- 3. Market Dynamics
- 3.1. Introduction
- 3.2. Market Drivers
- 3.2.1 Increasing Number of Near-to-eye (NTE) Applications; High Resolution
- 3.2.2 Excellent Picture Quality
- 3.2.3 and Low Power Consumption
- 3.3. Market Restrains
- 3.3.1. Diminishing Profit Margins and Ongoing Changes in Macro-environment
- 3.4. Market Trends
- 3.4.1. Consumer Electronics Segment to Hold Major Market Share
- 4. Market Factor Analysis
- 4.1. Porters Five Forces
- 4.2. Supply/Value Chain
- 4.3. PESTEL analysis
- 4.4. Market Entropy
- 4.5. Patent/Trademark Analysis
- 5. Global OLED Microdisplay Market Analysis, Insights and Forecast, 2019-2031
- 5.1. Market Analysis, Insights and Forecast - by Type
- 5.1.1. Near-to-eye
- 5.1.2. Projections
- 5.2. Market Analysis, Insights and Forecast - by End-user Industry
- 5.2.1. Automotive
- 5.2.2. Healthcare
- 5.2.3. Industrial
- 5.2.4. Consumer Electronics
- 5.2.5. Aerospace and Defense
- 5.2.6. Law Enforcement
- 5.2.7. Other End-user Industries
- 5.3. Market Analysis, Insights and Forecast - by Region
- 5.3.1. North America
- 5.3.2. Europe
- 5.3.3. Asia
- 5.3.4. Australia and New Zealand
- 5.3.5. Latin America
- 5.3.6. Middle East and Africa
- 5.1. Market Analysis, Insights and Forecast - by Type
- 6. North America OLED Microdisplay Market Analysis, Insights and Forecast, 2019-2031
- 6.1. Market Analysis, Insights and Forecast - by Type
- 6.1.1. Near-to-eye
- 6.1.2. Projections
- 6.2. Market Analysis, Insights and Forecast - by End-user Industry
- 6.2.1. Automotive
- 6.2.2. Healthcare
- 6.2.3. Industrial
- 6.2.4. Consumer Electronics
- 6.2.5. Aerospace and Defense
- 6.2.6. Law Enforcement
- 6.2.7. Other End-user Industries
- 6.1. Market Analysis, Insights and Forecast - by Type
- 7. Europe OLED Microdisplay Market Analysis, Insights and Forecast, 2019-2031
- 7.1. Market Analysis, Insights and Forecast - by Type
- 7.1.1. Near-to-eye
- 7.1.2. Projections
- 7.2. Market Analysis, Insights and Forecast - by End-user Industry
- 7.2.1. Automotive
- 7.2.2. Healthcare
- 7.2.3. Industrial
- 7.2.4. Consumer Electronics
- 7.2.5. Aerospace and Defense
- 7.2.6. Law Enforcement
- 7.2.7. Other End-user Industries
- 7.1. Market Analysis, Insights and Forecast - by Type
- 8. Asia OLED Microdisplay Market Analysis, Insights and Forecast, 2019-2031
- 8.1. Market Analysis, Insights and Forecast - by Type
- 8.1.1. Near-to-eye
- 8.1.2. Projections
- 8.2. Market Analysis, Insights and Forecast - by End-user Industry
- 8.2.1. Automotive
- 8.2.2. Healthcare
- 8.2.3. Industrial
- 8.2.4. Consumer Electronics
- 8.2.5. Aerospace and Defense
- 8.2.6. Law Enforcement
- 8.2.7. Other End-user Industries
- 8.1. Market Analysis, Insights and Forecast - by Type
- 9. Australia and New Zealand OLED Microdisplay Market Analysis, Insights and Forecast, 2019-2031
- 9.1. Market Analysis, Insights and Forecast - by Type
- 9.1.1. Near-to-eye
- 9.1.2. Projections
- 9.2. Market Analysis, Insights and Forecast - by End-user Industry
- 9.2.1. Automotive
- 9.2.2. Healthcare
- 9.2.3. Industrial
- 9.2.4. Consumer Electronics
- 9.2.5. Aerospace and Defense
- 9.2.6. Law Enforcement
- 9.2.7. Other End-user Industries
- 9.1. Market Analysis, Insights and Forecast - by Type
- 10. Latin America OLED Microdisplay Market Analysis, Insights and Forecast, 2019-2031
- 10.1. Market Analysis, Insights and Forecast - by Type
- 10.1.1. Near-to-eye
- 10.1.2. Projections
- 10.2. Market Analysis, Insights and Forecast - by End-user Industry
- 10.2.1. Automotive
- 10.2.2. Healthcare
- 10.2.3. Industrial
- 10.2.4. Consumer Electronics
- 10.2.5. Aerospace and Defense
- 10.2.6. Law Enforcement
- 10.2.7. Other End-user Industries
- 10.1. Market Analysis, Insights and Forecast - by Type
- 11. Middle East and Africa OLED Microdisplay Market Analysis, Insights and Forecast, 2019-2031
- 11.1. Market Analysis, Insights and Forecast - by Type
- 11.1.1. Near-to-eye
- 11.1.2. Projections
- 11.2. Market Analysis, Insights and Forecast - by End-user Industry
- 11.2.1. Automotive
- 11.2.2. Healthcare
- 11.2.3. Industrial
- 11.2.4. Consumer Electronics
- 11.2.5. Aerospace and Defense
- 11.2.6. Law Enforcement
- 11.2.7. Other End-user Industries
- 11.1. Market Analysis, Insights and Forecast - by Type
- 12. North America OLED Microdisplay Market Analysis, Insights and Forecast, 2019-2031
- 12.1. Market Analysis, Insights and Forecast - By Country/Sub-region
- 12.1.1.
- 13. Europe OLED Microdisplay Market Analysis, Insights and Forecast, 2019-2031
- 13.1. Market Analysis, Insights and Forecast - By Country/Sub-region
- 13.1.1.
- 14. Asia Pacific OLED Microdisplay Market Analysis, Insights and Forecast, 2019-2031
- 14.1. Market Analysis, Insights and Forecast - By Country/Sub-region
- 14.1.1.
- 15. Rest of the World OLED Microdisplay Market Analysis, Insights and Forecast, 2019-2031
- 15.1. Market Analysis, Insights and Forecast - By Country/Sub-region
- 15.1.1.
- 16. Competitive Analysis
- 16.1. Global Market Share Analysis 2024
- 16.2. Company Profiles
- 16.2.1 Sunlike Display Technology Corporatio
- 16.2.1.1. Overview
- 16.2.1.2. Products
- 16.2.1.3. SWOT Analysis
- 16.2.1.4. Recent Developments
- 16.2.1.5. Financials (Based on Availability)
- 16.2.2 Wisechip Semiconductor Inc
- 16.2.2.1. Overview
- 16.2.2.2. Products
- 16.2.2.3. SWOT Analysis
- 16.2.2.4. Recent Developments
- 16.2.2.5. Financials (Based on Availability)
- 16.2.3 eMagin Corporation
- 16.2.3.1. Overview
- 16.2.3.2. Products
- 16.2.3.3. SWOT Analysis
- 16.2.3.4. Recent Developments
- 16.2.3.5. Financials (Based on Availability)
- 16.2.4 Microoled SA (Photonis Technologies SAS)
- 16.2.4.1. Overview
- 16.2.4.2. Products
- 16.2.4.3. SWOT Analysis
- 16.2.4.4. Recent Developments
- 16.2.4.5. Financials (Based on Availability)
- 16.2.5 Seiko Epson Corporation
- 16.2.5.1. Overview
- 16.2.5.2. Products
- 16.2.5.3. SWOT Analysis
- 16.2.5.4. Recent Developments
- 16.2.5.5. Financials (Based on Availability)
- 16.2.6 Sony Semiconductor Solutions Corp (Sony Corporation)
- 16.2.6.1. Overview
- 16.2.6.2. Products
- 16.2.6.3. SWOT Analysis
- 16.2.6.4. Recent Developments
- 16.2.6.5. Financials (Based on Availability)
- 16.2.7 Fraunhofer FEP
- 16.2.7.1. Overview
- 16.2.7.2. Products
- 16.2.7.3. SWOT Analysis
- 16.2.7.4. Recent Developments
- 16.2.7.5. Financials (Based on Availability)
- 16.2.8 Winstar Display Co Ltd
- 16.2.8.1. Overview
- 16.2.8.2. Products
- 16.2.8.3. SWOT Analysis
- 16.2.8.4. Recent Developments
- 16.2.8.5. Financials (Based on Availability)
- 16.2.9 Yunnan Olightek Opto-electronic Technology Co Ltd
- 16.2.9.1. Overview
- 16.2.9.2. Products
- 16.2.9.3. SWOT Analysis
- 16.2.9.4. Recent Developments
- 16.2.9.5. Financials (Based on Availability)
- 16.2.10 Kopin Corporation
- 16.2.10.1. Overview
- 16.2.10.2. Products
- 16.2.10.3. SWOT Analysis
- 16.2.10.4. Recent Developments
- 16.2.10.5. Financials (Based on Availability)
- 16.2.1 Sunlike Display Technology Corporatio
List of Figures
- Figure 1: Global OLED Microdisplay Market Revenue Breakdown (Million, %) by Region 2024 & 2032
- Figure 2: North America OLED Microdisplay Market Revenue (Million), by Country 2024 & 2032
- Figure 3: North America OLED Microdisplay Market Revenue Share (%), by Country 2024 & 2032
- Figure 4: Europe OLED Microdisplay Market Revenue (Million), by Country 2024 & 2032
- Figure 5: Europe OLED Microdisplay Market Revenue Share (%), by Country 2024 & 2032
- Figure 6: Asia Pacific OLED Microdisplay Market Revenue (Million), by Country 2024 & 2032
- Figure 7: Asia Pacific OLED Microdisplay Market Revenue Share (%), by Country 2024 & 2032
- Figure 8: Rest of the World OLED Microdisplay Market Revenue (Million), by Country 2024 & 2032
- Figure 9: Rest of the World OLED Microdisplay Market Revenue Share (%), by Country 2024 & 2032
- Figure 10: North America OLED Microdisplay Market Revenue (Million), by Type 2024 & 2032
- Figure 11: North America OLED Microdisplay Market Revenue Share (%), by Type 2024 & 2032
- Figure 12: North America OLED Microdisplay Market Revenue (Million), by End-user Industry 2024 & 2032
- Figure 13: North America OLED Microdisplay Market Revenue Share (%), by End-user Industry 2024 & 2032
- Figure 14: North America OLED Microdisplay Market Revenue (Million), by Country 2024 & 2032
- Figure 15: North America OLED Microdisplay Market Revenue Share (%), by Country 2024 & 2032
- Figure 16: Europe OLED Microdisplay Market Revenue (Million), by Type 2024 & 2032
- Figure 17: Europe OLED Microdisplay Market Revenue Share (%), by Type 2024 & 2032
- Figure 18: Europe OLED Microdisplay Market Revenue (Million), by End-user Industry 2024 & 2032
- Figure 19: Europe OLED Microdisplay Market Revenue Share (%), by End-user Industry 2024 & 2032
- Figure 20: Europe OLED Microdisplay Market Revenue (Million), by Country 2024 & 2032
- Figure 21: Europe OLED Microdisplay Market Revenue Share (%), by Country 2024 & 2032
- Figure 22: Asia OLED Microdisplay Market Revenue (Million), by Type 2024 & 2032
- Figure 23: Asia OLED Microdisplay Market Revenue Share (%), by Type 2024 & 2032
- Figure 24: Asia OLED Microdisplay Market Revenue (Million), by End-user Industry 2024 & 2032
- Figure 25: Asia OLED Microdisplay Market Revenue Share (%), by End-user Industry 2024 & 2032
- Figure 26: Asia OLED Microdisplay Market Revenue (Million), by Country 2024 & 2032
- Figure 27: Asia OLED Microdisplay Market Revenue Share (%), by Country 2024 & 2032
- Figure 28: Australia and New Zealand OLED Microdisplay Market Revenue (Million), by Type 2024 & 2032
- Figure 29: Australia and New Zealand OLED Microdisplay Market Revenue Share (%), by Type 2024 & 2032
- Figure 30: Australia and New Zealand OLED Microdisplay Market Revenue (Million), by End-user Industry 2024 & 2032
- Figure 31: Australia and New Zealand OLED Microdisplay Market Revenue Share (%), by End-user Industry 2024 & 2032
- Figure 32: Australia and New Zealand OLED Microdisplay Market Revenue (Million), by Country 2024 & 2032
- Figure 33: Australia and New Zealand OLED Microdisplay Market Revenue Share (%), by Country 2024 & 2032
- Figure 34: Latin America OLED Microdisplay Market Revenue (Million), by Type 2024 & 2032
- Figure 35: Latin America OLED Microdisplay Market Revenue Share (%), by Type 2024 & 2032
- Figure 36: Latin America OLED Microdisplay Market Revenue (Million), by End-user Industry 2024 & 2032
- Figure 37: Latin America OLED Microdisplay Market Revenue Share (%), by End-user Industry 2024 & 2032
- Figure 38: Latin America OLED Microdisplay Market Revenue (Million), by Country 2024 & 2032
- Figure 39: Latin America OLED Microdisplay Market Revenue Share (%), by Country 2024 & 2032
- Figure 40: Middle East and Africa OLED Microdisplay Market Revenue (Million), by Type 2024 & 2032
- Figure 41: Middle East and Africa OLED Microdisplay Market Revenue Share (%), by Type 2024 & 2032
- Figure 42: Middle East and Africa OLED Microdisplay Market Revenue (Million), by End-user Industry 2024 & 2032
- Figure 43: Middle East and Africa OLED Microdisplay Market Revenue Share (%), by End-user Industry 2024 & 2032
- Figure 44: Middle East and Africa OLED Microdisplay Market Revenue (Million), by Country 2024 & 2032
- Figure 45: Middle East and Africa OLED Microdisplay Market Revenue Share (%), by Country 2024 & 2032
List of Tables
- Table 1: Global OLED Microdisplay Market Revenue Million Forecast, by Region 2019 & 2032
- Table 2: Global OLED Microdisplay Market Revenue Million Forecast, by Type 2019 & 2032
- Table 3: Global OLED Microdisplay Market Revenue Million Forecast, by End-user Industry 2019 & 2032
- Table 4: Global OLED Microdisplay Market Revenue Million Forecast, by Region 2019 & 2032
- Table 5: Global OLED Microdisplay Market Revenue Million Forecast, by Country 2019 & 2032
- Table 6: OLED Microdisplay Market Revenue (Million) Forecast, by Application 2019 & 2032
- Table 7: Global OLED Microdisplay Market Revenue Million Forecast, by Country 2019 & 2032
- Table 8: OLED Microdisplay Market Revenue (Million) Forecast, by Application 2019 & 2032
- Table 9: Global OLED Microdisplay Market Revenue Million Forecast, by Country 2019 & 2032
- Table 10: OLED Microdisplay Market Revenue (Million) Forecast, by Application 2019 & 2032
- Table 11: Global OLED Microdisplay Market Revenue Million Forecast, by Country 2019 & 2032
- Table 12: OLED Microdisplay Market Revenue (Million) Forecast, by Application 2019 & 2032
- Table 13: Global OLED Microdisplay Market Revenue Million Forecast, by Type 2019 & 2032
- Table 14: Global OLED Microdisplay Market Revenue Million Forecast, by End-user Industry 2019 & 2032
- Table 15: Global OLED Microdisplay Market Revenue Million Forecast, by Country 2019 & 2032
- Table 16: Global OLED Microdisplay Market Revenue Million Forecast, by Type 2019 & 2032
- Table 17: Global OLED Microdisplay Market Revenue Million Forecast, by End-user Industry 2019 & 2032
- Table 18: Global OLED Microdisplay Market Revenue Million Forecast, by Country 2019 & 2032
- Table 19: Global OLED Microdisplay Market Revenue Million Forecast, by Type 2019 & 2032
- Table 20: Global OLED Microdisplay Market Revenue Million Forecast, by End-user Industry 2019 & 2032
- Table 21: Global OLED Microdisplay Market Revenue Million Forecast, by Country 2019 & 2032
- Table 22: Global OLED Microdisplay Market Revenue Million Forecast, by Type 2019 & 2032
- Table 23: Global OLED Microdisplay Market Revenue Million Forecast, by End-user Industry 2019 & 2032
- Table 24: Global OLED Microdisplay Market Revenue Million Forecast, by Country 2019 & 2032
- Table 25: Global OLED Microdisplay Market Revenue Million Forecast, by Type 2019 & 2032
- Table 26: Global OLED Microdisplay Market Revenue Million Forecast, by End-user Industry 2019 & 2032
- Table 27: Global OLED Microdisplay Market Revenue Million Forecast, by Country 2019 & 2032
- Table 28: Global OLED Microdisplay Market Revenue Million Forecast, by Type 2019 & 2032
- Table 29: Global OLED Microdisplay Market Revenue Million Forecast, by End-user Industry 2019 & 2032
- Table 30: Global OLED Microdisplay Market Revenue Million Forecast, by Country 2019 & 2032
Frequently Asked Questions
1. What is the projected Compound Annual Growth Rate (CAGR) of the OLED Microdisplay Market?
The projected CAGR is approximately 60.20%.
2. Which companies are prominent players in the OLED Microdisplay Market?
Key companies in the market include Sunlike Display Technology Corporatio, Wisechip Semiconductor Inc, eMagin Corporation, Microoled SA (Photonis Technologies SAS), Seiko Epson Corporation, Sony Semiconductor Solutions Corp (Sony Corporation), Fraunhofer FEP, Winstar Display Co Ltd, Yunnan Olightek Opto-electronic Technology Co Ltd, Kopin Corporation.
3. What are the main segments of the OLED Microdisplay Market?
The market segments include Type, End-user Industry.
4. Can you provide details about the market size?
The market size is estimated to be USD 0.73 Million as of 2022.
5. What are some drivers contributing to market growth?
Increasing Number of Near-to-eye (NTE) Applications; High Resolution. Excellent Picture Quality. and Low Power Consumption.
6. What are the notable trends driving market growth?
Consumer Electronics Segment to Hold Major Market Share.
7. Are there any restraints impacting market growth?
Diminishing Profit Margins and Ongoing Changes in Macro-environment.
8. Can you provide examples of recent developments in the market?
February 2024: Kopin Corporation announced it received several new orders from multiple customers for its simulated thermal sights used in armored vehicle training systems, totaling more than USD 3 million. These simulated thermal sights support the training of armored vehicle crews in integrated multi-platform mission trainers. The company believes the recent deployment of armored vehicles in multiple theaters is driving the need for increased training capabilities and leading to the procurement of significant quantities of additional trainers.
9. What pricing options are available for accessing the report?
Pricing options include single-user, multi-user, and enterprise licenses priced at USD 4750, USD 5250, and USD 8750 respectively.
10. Is the market size provided in terms of value or volume?
The market size is provided in terms of value, measured in Million.
11. Are there any specific market keywords associated with the report?
Yes, the market keyword associated with the report is "OLED Microdisplay Market," which aids in identifying and referencing the specific market segment covered.
12. How do I determine which pricing option suits my needs best?
The pricing options vary based on user requirements and access needs. Individual users may opt for single-user licenses, while businesses requiring broader access may choose multi-user or enterprise licenses for cost-effective access to the report.
13. Are there any additional resources or data provided in the OLED Microdisplay Market report?
While the report offers comprehensive insights, it's advisable to review the specific contents or supplementary materials provided to ascertain if additional resources or data are available.
14. How can I stay updated on further developments or reports in the OLED Microdisplay Market?
To stay informed about further developments, trends, and reports in the OLED Microdisplay Market, consider subscribing to industry newsletters, following relevant companies and organizations, or regularly checking reputable industry news sources and publications.
Methodology
Step 1 - Identification of Relevant Samples Size from Population Database


Step 2 - Approaches for Defining Global Market Size (Value, Volume* & Price*)

Note*: In applicable scenarios
Step 3 - Data Sources
Primary Research
- Web Analytics
- Survey Reports
- Research Institute
- Latest Research Reports
- Opinion Leaders
Secondary Research
- Annual Reports
- White Paper
- Latest Press Release
- Industry Association
- Paid Database
- Investor Presentations

Step 4 - Data Triangulation
Involves using different sources of information in order to increase the validity of a study
These sources are likely to be stakeholders in a program - participants, other researchers, program staff, other community members, and so on.
Then we put all data in single framework & apply various statistical tools to find out the dynamic on the market.
During the analysis stage, feedback from the stakeholder groups would be compared to determine areas of agreement as well as areas of divergence


