
Key Insights
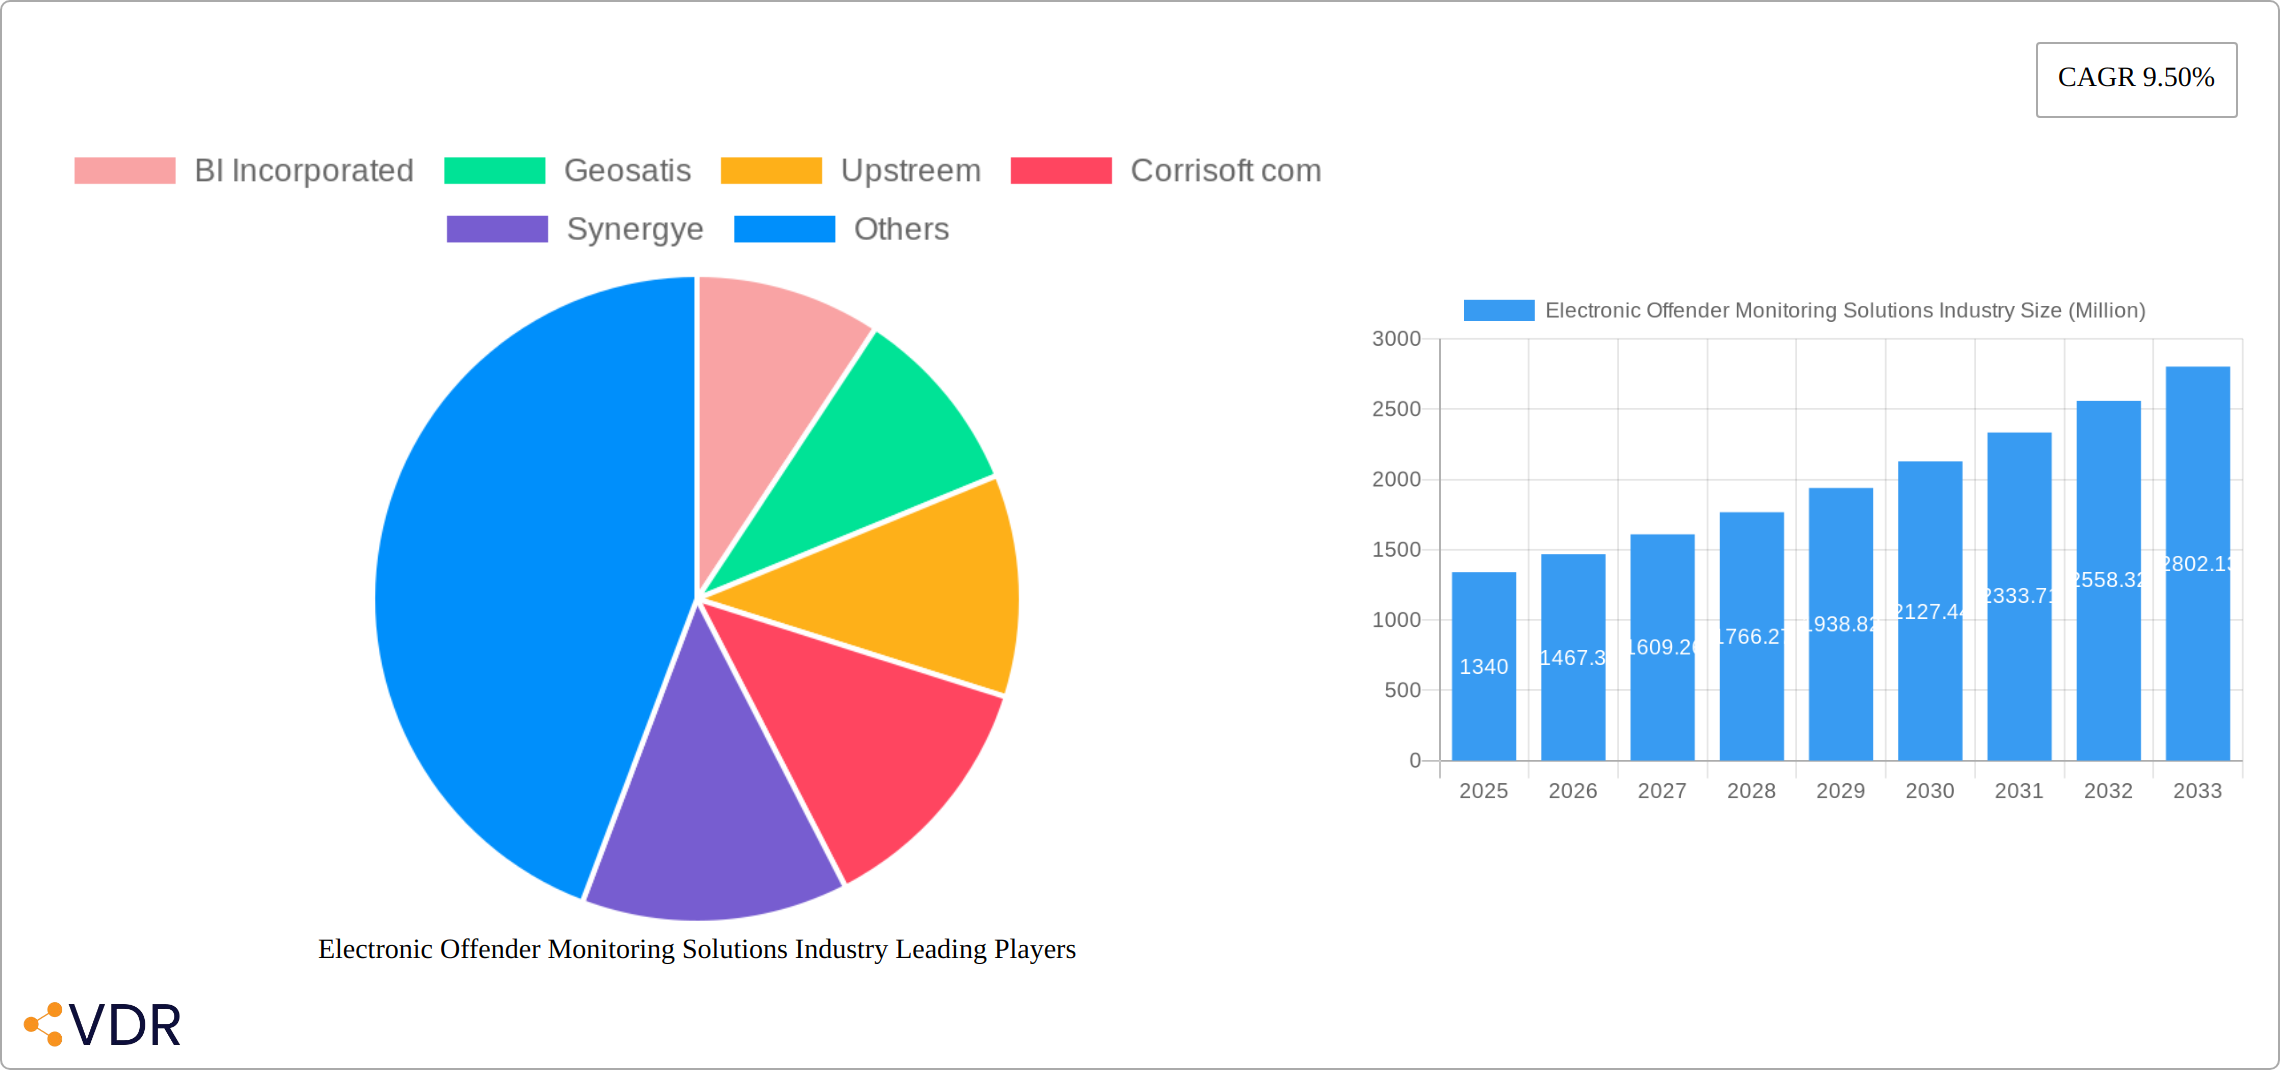
The Electronic Offender Monitoring (EOM) solutions market is experiencing robust growth, projected to reach a value of $1.34 billion in 2025 and maintain a Compound Annual Growth Rate (CAGR) of 9.50% from 2025 to 2033. This expansion is driven by several key factors. Increasing crime rates globally necessitate more efficient and cost-effective methods of offender supervision, leading to greater adoption of EOM technologies. Furthermore, advancements in GPS tracking, radio frequency (RF) identification, and data analytics are improving the accuracy and reliability of monitoring, enhancing public safety and reducing recidivism. The rising preference for community-based corrections over incarceration, coupled with the increasing demand for cost-effective alternatives to traditional methods of supervision, is further fueling market growth. The market is segmented by technology (RF and GPS) and offering (solutions and services), with GPS-based solutions currently holding a significant market share due to their precise location tracking capabilities. The increasing integration of AI and machine learning in EOM systems is expected to further enhance their effectiveness and efficiency in the coming years. The market is geographically diverse, with North America and Europe currently representing the largest market segments, although rapid growth is anticipated in Asia-Pacific regions due to rising populations and technological advancements. Competition is intense, with established players alongside innovative technology providers vying for market share.
The continued growth of the EOM market is likely to be influenced by factors such as governmental investments in public safety infrastructure, the evolution of data privacy regulations, and the integration of EOM technologies with other justice system components. The adoption of cloud-based solutions and the development of more sophisticated analytics capabilities will shape future market trends. Potential restraints include challenges related to data security and privacy concerns, along with the potential for technological failures or malfunctions. However, continuous technological innovations and improved regulatory frameworks are likely to mitigate these challenges. The market’s growth trajectory suggests a significant future for EOM solutions, transforming the landscape of offender monitoring and enhancing public safety.
Electronic Offender Monitoring Solutions Industry Market Report: 2019-2033
This comprehensive report provides a detailed analysis of the Electronic Offender Monitoring Solutions industry, encompassing market dynamics, growth trends, regional insights, product landscape, challenges, opportunities, and key players. The study period covers 2019-2033, with 2025 as the base year and forecast period extending to 2033. The report offers invaluable insights for industry professionals, investors, and policymakers seeking to understand and navigate this evolving market. The total market size is projected to reach xx Million by 2033.
Electronic Offender Monitoring Solutions Industry Market Dynamics & Structure
The Electronic Offender Monitoring (EOM) Solutions market presents a dynamic landscape shaped by a moderately concentrated group of key players actively competing for market share. Technological innovation, particularly in GPS and Radio Frequency (RF) technologies, serves as a primary growth driver, alongside evolving regulatory frameworks and a rising demand for efficient and cost-effective offender supervision. The market faces competitive pressures from alternative technologies and shifts in end-user demographics. Mergers and acquisitions (M&A) activity is moderate, with strategic acquisitions significantly influencing the competitive landscape. The increasing adoption of AI and IoT functionalities further complicates the competitive dynamics.
- Market Concentration: While precise figures fluctuate, a handful of dominant players currently command a significant portion of the market share.
- Technological Innovation: Continuous advancements in GPS accuracy, RF range, and sophisticated data analytics are pivotal drivers. The integration of Artificial Intelligence (AI) and the Internet of Things (IoT) is rapidly transforming the industry, leading to more precise tracking, predictive analytics, and remote management capabilities.
- Regulatory Landscape: Diverse regulations across different geographical regions significantly impact market growth and adoption rates. Stringent data privacy and security standards are paramount and present both challenges and opportunities for innovation.
- Competitive Substitutes: Traditional methods of offender supervision continue to exist, presenting ongoing competition for electronic solutions. However, the cost-effectiveness and improved accuracy of EOM are increasingly favored.
- End-User Demographics: Fluctuations in crime rates and the growing emphasis on community corrections programs consistently fuel market growth. The demand for cost-effective and efficient alternatives to incarceration drives adoption.
- M&A Trends: A moderate level of M&A activity is observed, with larger players strategically acquiring smaller technology firms to bolster their capabilities and expand their market reach. This consolidation trend is likely to continue.
Electronic Offender Monitoring Solutions Industry Growth Trends & Insights
The Electronic Offender Monitoring Solutions market has witnessed significant growth during the historical period (2019-2024), driven by increasing adoption rates in both developed and developing nations. This growth is fueled by rising crime rates, increasing budgetary constraints on traditional correctional facilities, and the proven efficacy of electronic monitoring in reducing recidivism. Technological advancements, particularly the integration of GPS and RF technologies, have expanded the capabilities of electronic monitoring systems, further enhancing adoption rates. The market is projected to experience a Compound Annual Growth Rate (CAGR) of xx% during the forecast period (2025-2033), reaching a market size of xx Million by 2033. This growth is fueled by the increasing preference for cost-effective and technologically advanced supervision solutions. Consumer behavior is shifting toward increased acceptance of electronic monitoring as a viable alternative to incarceration. The market penetration rate is expected to reach xx% by 2033.

Dominant Regions, Countries, or Segments in Electronic Offender Monitoring Solutions Industry
North America currently dominates the Electronic Offender Monitoring Solutions market, driven by high adoption rates in the US, followed by Europe. Within these regions, the GPS technology segment holds a significant market share due to its higher accuracy and broader capabilities compared to RF systems. The “Solutions” offering segment also dominates over “Services” indicating a preference for comprehensive, integrated solutions.
- Key Drivers in North America: Stringent government regulations, robust technological infrastructure, and increased funding for community corrections programs.
- Growth Potential in Europe: Growing adoption of electronic monitoring across various jurisdictions and increasing investment in technology.
- Market Share: North America holds approximately xx% of the market share, followed by Europe at xx%.
- Growth Potential: The Asia-Pacific region is expected to experience the highest growth rate during the forecast period, driven by increasing investments in public safety and infrastructure development.
Electronic Offender Monitoring Solutions Industry Product Landscape
The Electronic Offender Monitoring solutions market encompasses a diverse range of products, from basic ankle bracelets equipped with GPS/RF capabilities to sophisticated software platforms designed for comprehensive data management and advanced analytics. These solutions offer varying levels of accuracy, range, and feature sets, catering to diverse needs and budgets. Technological advancements are continuously improving accuracy, extending battery life, enhancing tamper resistance, and refining data analytics capabilities. Key differentiators include robust remote monitoring capabilities, seamless integration with existing correctional systems, and data-driven insights for more effective risk assessment and recidivism reduction. The market is also seeing the emergence of bio-metric monitoring solutions.
Key Drivers, Barriers & Challenges in Electronic Offender Monitoring Solutions Industry
Key Drivers:
- Increasing crime rates and demand for cost-effective alternatives to incarceration.
- Technological advancements, such as improved GPS accuracy and AI-powered analytics.
- Growing acceptance of electronic monitoring by law enforcement agencies and judicial systems.
- Government initiatives to promote community corrections and reduce prison populations.
Key Barriers and Challenges:
- High initial investment costs and ongoing maintenance expenses.
- Concerns regarding data privacy and security breaches.
- Potential for technological malfunctions and disruptions.
- Resistance from certain segments of the population and criminal justice professionals.
- Supply chain disruptions impacting the availability of components and impacting production timelines.
- Regulatory hurdles and compliance requirements in different jurisdictions could hinder market penetration and adoption.
- Intense competition amongst established and emerging players can affect profitability and revenue streams.
Emerging Opportunities in Electronic Offender Monitoring Solutions Industry
- Expansion into Untapped Markets: Significant growth potential exists in developing countries with increasing adoption of modern correctional technologies.
- Advanced Analytics for Predictive Policing: The development and implementation of AI-powered predictive analytics to anticipate recidivism and improve public safety is a major opportunity.
- Seamless Technology Integration: Integrating electronic monitoring with other correctional technologies (e.g., video conferencing, inmate management systems) will create a more holistic and effective system.
- Enhanced User Experience: Focusing on improving the comfort and usability of monitoring devices is crucial for enhancing compliance and reducing potential for device tampering.
- Expanding Applications: Exploring new applications beyond traditional offender monitoring, such as monitoring individuals with mental health conditions or those under house arrest, presents significant potential.
Growth Accelerators in the Electronic Offender Monitoring Solutions Industry
Technological advancements, including AI-driven analytics, enhanced GPS accuracy, and seamless integration with IoT devices, are pivotal for accelerating market growth. Strategic partnerships between technology providers and correctional agencies are equally critical for wider adoption and market penetration. Expansion into underserved markets, particularly in developing countries, offers substantial growth potential. Government funding and policy initiatives supporting the use of EOM solutions will also play a major role.
Key Players Shaping the Electronic Offender Monitoring Solutions Market
- BI Incorporated
- Geosatis
- Upstreem
- Corrisoft com
- Synergye
- Supercom
- AMOS Spacecom
- Buddi AI
- G4S Limited
- Attenti
- Securus Technologies LLC
- Alcohol Monitoring Systems Inc (SCRAM Systems)
- TRACK GROUP
Notable Milestones in Electronic Offender Monitoring Solutions Industry Sector
- October 2022: B.I. Incorporated secured an exclusive agreement with OMNIA Partners Public Sector, streamlining contracting processes for government agencies.
- January 2022: Denver City Council approved a USD 1.5 million contract with B.I. Incorporated for electronic monitoring equipment.
In-Depth Electronic Offender Monitoring Solutions Industry Market Outlook
The Electronic Offender Monitoring Solutions market exhibits considerable growth potential, propelled by technological progress, the increasing demand for cost-effective correctional solutions, and the expansion of applications. Strategic collaborations, penetration into emerging markets, and innovative product development are key factors in realizing this potential. The market's future trajectory hinges on successfully navigating challenges related to data security, regulatory compliance, and ensuring ethical and responsible implementation of the technology. The industry's emphasis will shift towards optimizing user experience and developing sophisticated analytics capabilities to enable enhanced risk assessment and impactful recidivism reduction programs. Sustainability concerns related to the devices themselves and their end-of-life disposal will also play an increasingly significant role.
Electronic Offender Monitoring Solutions Industry Segmentation
-
1. Technology
- 1.1. Radio Frequency (RF)
- 1.2. Global Positioning System (GPS)
-
2. Offering
- 2.1. Solutions
- 2.2. Services
Electronic Offender Monitoring Solutions Industry Segmentation By Geography
- 1. North America
- 2. Europe
- 3. Asia
- 4. Australia and New Zealand
- 5. Latin America
- 6. Middle East and Africa

Electronic Offender Monitoring Solutions Industry REPORT HIGHLIGHTS
| Aspects | Details |
|---|---|
| Study Period | 2019-2033 |
| Base Year | 2024 |
| Estimated Year | 2025 |
| Forecast Period | 2025-2033 |
| Historical Period | 2019-2024 |
| Growth Rate | CAGR of 9.50% from 2019-2033 |
| Segmentation |
|
Table of Contents
- 1. Introduction
- 1.1. Research Scope
- 1.2. Market Segmentation
- 1.3. Research Methodology
- 1.4. Definitions and Assumptions
- 2. Executive Summary
- 2.1. Introduction
- 3. Market Dynamics
- 3.1. Introduction
- 3.2. Market Drivers
- 3.2.1. The Prison Overcrowding Worsened by the COVID-19 Pandemic; Growing Adoption of Victim Protection Solutions
- 3.3. Market Restrains
- 3.3.1. Electronic Offender Monitoring Devices Can Be Tampered by Offenders
- 3.4. Market Trends
- 3.4.1. Global Positioning System Driving the Market Growth
- 4. Market Factor Analysis
- 4.1. Porters Five Forces
- 4.2. Supply/Value Chain
- 4.3. PESTEL analysis
- 4.4. Market Entropy
- 4.5. Patent/Trademark Analysis
- 5. Global Electronic Offender Monitoring Solutions Industry Analysis, Insights and Forecast, 2019-2031
- 5.1. Market Analysis, Insights and Forecast - by Technology
- 5.1.1. Radio Frequency (RF)
- 5.1.2. Global Positioning System (GPS)
- 5.2. Market Analysis, Insights and Forecast - by Offering
- 5.2.1. Solutions
- 5.2.2. Services
- 5.3. Market Analysis, Insights and Forecast - by Region
- 5.3.1. North America
- 5.3.2. Europe
- 5.3.3. Asia
- 5.3.4. Australia and New Zealand
- 5.3.5. Latin America
- 5.3.6. Middle East and Africa
- 5.1. Market Analysis, Insights and Forecast - by Technology
- 6. North America Electronic Offender Monitoring Solutions Industry Analysis, Insights and Forecast, 2019-2031
- 6.1. Market Analysis, Insights and Forecast - by Technology
- 6.1.1. Radio Frequency (RF)
- 6.1.2. Global Positioning System (GPS)
- 6.2. Market Analysis, Insights and Forecast - by Offering
- 6.2.1. Solutions
- 6.2.2. Services
- 6.1. Market Analysis, Insights and Forecast - by Technology
- 7. Europe Electronic Offender Monitoring Solutions Industry Analysis, Insights and Forecast, 2019-2031
- 7.1. Market Analysis, Insights and Forecast - by Technology
- 7.1.1. Radio Frequency (RF)
- 7.1.2. Global Positioning System (GPS)
- 7.2. Market Analysis, Insights and Forecast - by Offering
- 7.2.1. Solutions
- 7.2.2. Services
- 7.1. Market Analysis, Insights and Forecast - by Technology
- 8. Asia Electronic Offender Monitoring Solutions Industry Analysis, Insights and Forecast, 2019-2031
- 8.1. Market Analysis, Insights and Forecast - by Technology
- 8.1.1. Radio Frequency (RF)
- 8.1.2. Global Positioning System (GPS)
- 8.2. Market Analysis, Insights and Forecast - by Offering
- 8.2.1. Solutions
- 8.2.2. Services
- 8.1. Market Analysis, Insights and Forecast - by Technology
- 9. Australia and New Zealand Electronic Offender Monitoring Solutions Industry Analysis, Insights and Forecast, 2019-2031
- 9.1. Market Analysis, Insights and Forecast - by Technology
- 9.1.1. Radio Frequency (RF)
- 9.1.2. Global Positioning System (GPS)
- 9.2. Market Analysis, Insights and Forecast - by Offering
- 9.2.1. Solutions
- 9.2.2. Services
- 9.1. Market Analysis, Insights and Forecast - by Technology
- 10. Latin America Electronic Offender Monitoring Solutions Industry Analysis, Insights and Forecast, 2019-2031
- 10.1. Market Analysis, Insights and Forecast - by Technology
- 10.1.1. Radio Frequency (RF)
- 10.1.2. Global Positioning System (GPS)
- 10.2. Market Analysis, Insights and Forecast - by Offering
- 10.2.1. Solutions
- 10.2.2. Services
- 10.1. Market Analysis, Insights and Forecast - by Technology
- 11. Middle East and Africa Electronic Offender Monitoring Solutions Industry Analysis, Insights and Forecast, 2019-2031
- 11.1. Market Analysis, Insights and Forecast - by Technology
- 11.1.1. Radio Frequency (RF)
- 11.1.2. Global Positioning System (GPS)
- 11.2. Market Analysis, Insights and Forecast - by Offering
- 11.2.1. Solutions
- 11.2.2. Services
- 11.1. Market Analysis, Insights and Forecast - by Technology
- 12. North America Electronic Offender Monitoring Solutions Industry Analysis, Insights and Forecast, 2019-2031
- 12.1. Market Analysis, Insights and Forecast - By Country/Sub-region
- 12.1.1 United States
- 12.1.2 Canada
- 12.1.3 Mexico
- 13. Europe Electronic Offender Monitoring Solutions Industry Analysis, Insights and Forecast, 2019-2031
- 13.1. Market Analysis, Insights and Forecast - By Country/Sub-region
- 13.1.1 Germany
- 13.1.2 United Kingdom
- 13.1.3 France
- 13.1.4 Spain
- 13.1.5 Italy
- 13.1.6 Spain
- 13.1.7 Belgium
- 13.1.8 Netherland
- 13.1.9 Nordics
- 13.1.10 Rest of Europe
- 14. Asia Pacific Electronic Offender Monitoring Solutions Industry Analysis, Insights and Forecast, 2019-2031
- 14.1. Market Analysis, Insights and Forecast - By Country/Sub-region
- 14.1.1 China
- 14.1.2 Japan
- 14.1.3 India
- 14.1.4 South Korea
- 14.1.5 Southeast Asia
- 14.1.6 Australia
- 14.1.7 Indonesia
- 14.1.8 Phillipes
- 14.1.9 Singapore
- 14.1.10 Thailandc
- 14.1.11 Rest of Asia Pacific
- 15. South America Electronic Offender Monitoring Solutions Industry Analysis, Insights and Forecast, 2019-2031
- 15.1. Market Analysis, Insights and Forecast - By Country/Sub-region
- 15.1.1 Brazil
- 15.1.2 Argentina
- 15.1.3 Peru
- 15.1.4 Chile
- 15.1.5 Colombia
- 15.1.6 Ecuador
- 15.1.7 Venezuela
- 15.1.8 Rest of South America
- 16. North America Electronic Offender Monitoring Solutions Industry Analysis, Insights and Forecast, 2019-2031
- 16.1. Market Analysis, Insights and Forecast - By Country/Sub-region
- 16.1.1 United States
- 16.1.2 Canada
- 16.1.3 Mexico
- 17. MEA Electronic Offender Monitoring Solutions Industry Analysis, Insights and Forecast, 2019-2031
- 17.1. Market Analysis, Insights and Forecast - By Country/Sub-region
- 17.1.1 United Arab Emirates
- 17.1.2 Saudi Arabia
- 17.1.3 South Africa
- 17.1.4 Rest of Middle East and Africa
- 18. Competitive Analysis
- 18.1. Global Market Share Analysis 2024
- 18.2. Company Profiles
- 18.2.1 BI Incorporated
- 18.2.1.1. Overview
- 18.2.1.2. Products
- 18.2.1.3. SWOT Analysis
- 18.2.1.4. Recent Developments
- 18.2.1.5. Financials (Based on Availability)
- 18.2.2 Geosatis
- 18.2.2.1. Overview
- 18.2.2.2. Products
- 18.2.2.3. SWOT Analysis
- 18.2.2.4. Recent Developments
- 18.2.2.5. Financials (Based on Availability)
- 18.2.3 Upstreem
- 18.2.3.1. Overview
- 18.2.3.2. Products
- 18.2.3.3. SWOT Analysis
- 18.2.3.4. Recent Developments
- 18.2.3.5. Financials (Based on Availability)
- 18.2.4 Corrisoft com
- 18.2.4.1. Overview
- 18.2.4.2. Products
- 18.2.4.3. SWOT Analysis
- 18.2.4.4. Recent Developments
- 18.2.4.5. Financials (Based on Availability)
- 18.2.5 Synergye
- 18.2.5.1. Overview
- 18.2.5.2. Products
- 18.2.5.3. SWOT Analysis
- 18.2.5.4. Recent Developments
- 18.2.5.5. Financials (Based on Availability)
- 18.2.6 Supercom
- 18.2.6.1. Overview
- 18.2.6.2. Products
- 18.2.6.3. SWOT Analysis
- 18.2.6.4. Recent Developments
- 18.2.6.5. Financials (Based on Availability)
- 18.2.7 AMOS Spacecom
- 18.2.7.1. Overview
- 18.2.7.2. Products
- 18.2.7.3. SWOT Analysis
- 18.2.7.4. Recent Developments
- 18.2.7.5. Financials (Based on Availability)
- 18.2.8 Buddi AI
- 18.2.8.1. Overview
- 18.2.8.2. Products
- 18.2.8.3. SWOT Analysis
- 18.2.8.4. Recent Developments
- 18.2.8.5. Financials (Based on Availability)
- 18.2.9 G4S Limited
- 18.2.9.1. Overview
- 18.2.9.2. Products
- 18.2.9.3. SWOT Analysis
- 18.2.9.4. Recent Developments
- 18.2.9.5. Financials (Based on Availability)
- 18.2.10 Attenti
- 18.2.10.1. Overview
- 18.2.10.2. Products
- 18.2.10.3. SWOT Analysis
- 18.2.10.4. Recent Developments
- 18.2.10.5. Financials (Based on Availability)
- 18.2.11 Securus Technologies LLC
- 18.2.11.1. Overview
- 18.2.11.2. Products
- 18.2.11.3. SWOT Analysis
- 18.2.11.4. Recent Developments
- 18.2.11.5. Financials (Based on Availability)
- 18.2.12 Alcohol Monitoring Systems Inc (SCRAM Systems)
- 18.2.12.1. Overview
- 18.2.12.2. Products
- 18.2.12.3. SWOT Analysis
- 18.2.12.4. Recent Developments
- 18.2.12.5. Financials (Based on Availability)
- 18.2.13 TRACK GROUP
- 18.2.13.1. Overview
- 18.2.13.2. Products
- 18.2.13.3. SWOT Analysis
- 18.2.13.4. Recent Developments
- 18.2.13.5. Financials (Based on Availability)
- 18.2.1 BI Incorporated
List of Figures
- Figure 1: Global Electronic Offender Monitoring Solutions Industry Revenue Breakdown (Million, %) by Region 2024 & 2032
- Figure 2: Global Electronic Offender Monitoring Solutions Industry Volume Breakdown (K Unit, %) by Region 2024 & 2032
- Figure 3: North America Electronic Offender Monitoring Solutions Industry Revenue (Million), by Country 2024 & 2032
- Figure 4: North America Electronic Offender Monitoring Solutions Industry Volume (K Unit), by Country 2024 & 2032
- Figure 5: North America Electronic Offender Monitoring Solutions Industry Revenue Share (%), by Country 2024 & 2032
- Figure 6: North America Electronic Offender Monitoring Solutions Industry Volume Share (%), by Country 2024 & 2032
- Figure 7: Europe Electronic Offender Monitoring Solutions Industry Revenue (Million), by Country 2024 & 2032
- Figure 8: Europe Electronic Offender Monitoring Solutions Industry Volume (K Unit), by Country 2024 & 2032
- Figure 9: Europe Electronic Offender Monitoring Solutions Industry Revenue Share (%), by Country 2024 & 2032
- Figure 10: Europe Electronic Offender Monitoring Solutions Industry Volume Share (%), by Country 2024 & 2032
- Figure 11: Asia Pacific Electronic Offender Monitoring Solutions Industry Revenue (Million), by Country 2024 & 2032
- Figure 12: Asia Pacific Electronic Offender Monitoring Solutions Industry Volume (K Unit), by Country 2024 & 2032
- Figure 13: Asia Pacific Electronic Offender Monitoring Solutions Industry Revenue Share (%), by Country 2024 & 2032
- Figure 14: Asia Pacific Electronic Offender Monitoring Solutions Industry Volume Share (%), by Country 2024 & 2032
- Figure 15: South America Electronic Offender Monitoring Solutions Industry Revenue (Million), by Country 2024 & 2032
- Figure 16: South America Electronic Offender Monitoring Solutions Industry Volume (K Unit), by Country 2024 & 2032
- Figure 17: South America Electronic Offender Monitoring Solutions Industry Revenue Share (%), by Country 2024 & 2032
- Figure 18: South America Electronic Offender Monitoring Solutions Industry Volume Share (%), by Country 2024 & 2032
- Figure 19: North America Electronic Offender Monitoring Solutions Industry Revenue (Million), by Country 2024 & 2032
- Figure 20: North America Electronic Offender Monitoring Solutions Industry Volume (K Unit), by Country 2024 & 2032
- Figure 21: North America Electronic Offender Monitoring Solutions Industry Revenue Share (%), by Country 2024 & 2032
- Figure 22: North America Electronic Offender Monitoring Solutions Industry Volume Share (%), by Country 2024 & 2032
- Figure 23: MEA Electronic Offender Monitoring Solutions Industry Revenue (Million), by Country 2024 & 2032
- Figure 24: MEA Electronic Offender Monitoring Solutions Industry Volume (K Unit), by Country 2024 & 2032
- Figure 25: MEA Electronic Offender Monitoring Solutions Industry Revenue Share (%), by Country 2024 & 2032
- Figure 26: MEA Electronic Offender Monitoring Solutions Industry Volume Share (%), by Country 2024 & 2032
- Figure 27: North America Electronic Offender Monitoring Solutions Industry Revenue (Million), by Technology 2024 & 2032
- Figure 28: North America Electronic Offender Monitoring Solutions Industry Volume (K Unit), by Technology 2024 & 2032
- Figure 29: North America Electronic Offender Monitoring Solutions Industry Revenue Share (%), by Technology 2024 & 2032
- Figure 30: North America Electronic Offender Monitoring Solutions Industry Volume Share (%), by Technology 2024 & 2032
- Figure 31: North America Electronic Offender Monitoring Solutions Industry Revenue (Million), by Offering 2024 & 2032
- Figure 32: North America Electronic Offender Monitoring Solutions Industry Volume (K Unit), by Offering 2024 & 2032
- Figure 33: North America Electronic Offender Monitoring Solutions Industry Revenue Share (%), by Offering 2024 & 2032
- Figure 34: North America Electronic Offender Monitoring Solutions Industry Volume Share (%), by Offering 2024 & 2032
- Figure 35: North America Electronic Offender Monitoring Solutions Industry Revenue (Million), by Country 2024 & 2032
- Figure 36: North America Electronic Offender Monitoring Solutions Industry Volume (K Unit), by Country 2024 & 2032
- Figure 37: North America Electronic Offender Monitoring Solutions Industry Revenue Share (%), by Country 2024 & 2032
- Figure 38: North America Electronic Offender Monitoring Solutions Industry Volume Share (%), by Country 2024 & 2032
- Figure 39: Europe Electronic Offender Monitoring Solutions Industry Revenue (Million), by Technology 2024 & 2032
- Figure 40: Europe Electronic Offender Monitoring Solutions Industry Volume (K Unit), by Technology 2024 & 2032
- Figure 41: Europe Electronic Offender Monitoring Solutions Industry Revenue Share (%), by Technology 2024 & 2032
- Figure 42: Europe Electronic Offender Monitoring Solutions Industry Volume Share (%), by Technology 2024 & 2032
- Figure 43: Europe Electronic Offender Monitoring Solutions Industry Revenue (Million), by Offering 2024 & 2032
- Figure 44: Europe Electronic Offender Monitoring Solutions Industry Volume (K Unit), by Offering 2024 & 2032
- Figure 45: Europe Electronic Offender Monitoring Solutions Industry Revenue Share (%), by Offering 2024 & 2032
- Figure 46: Europe Electronic Offender Monitoring Solutions Industry Volume Share (%), by Offering 2024 & 2032
- Figure 47: Europe Electronic Offender Monitoring Solutions Industry Revenue (Million), by Country 2024 & 2032
- Figure 48: Europe Electronic Offender Monitoring Solutions Industry Volume (K Unit), by Country 2024 & 2032
- Figure 49: Europe Electronic Offender Monitoring Solutions Industry Revenue Share (%), by Country 2024 & 2032
- Figure 50: Europe Electronic Offender Monitoring Solutions Industry Volume Share (%), by Country 2024 & 2032
- Figure 51: Asia Electronic Offender Monitoring Solutions Industry Revenue (Million), by Technology 2024 & 2032
- Figure 52: Asia Electronic Offender Monitoring Solutions Industry Volume (K Unit), by Technology 2024 & 2032
- Figure 53: Asia Electronic Offender Monitoring Solutions Industry Revenue Share (%), by Technology 2024 & 2032
- Figure 54: Asia Electronic Offender Monitoring Solutions Industry Volume Share (%), by Technology 2024 & 2032
- Figure 55: Asia Electronic Offender Monitoring Solutions Industry Revenue (Million), by Offering 2024 & 2032
- Figure 56: Asia Electronic Offender Monitoring Solutions Industry Volume (K Unit), by Offering 2024 & 2032
- Figure 57: Asia Electronic Offender Monitoring Solutions Industry Revenue Share (%), by Offering 2024 & 2032
- Figure 58: Asia Electronic Offender Monitoring Solutions Industry Volume Share (%), by Offering 2024 & 2032
- Figure 59: Asia Electronic Offender Monitoring Solutions Industry Revenue (Million), by Country 2024 & 2032
- Figure 60: Asia Electronic Offender Monitoring Solutions Industry Volume (K Unit), by Country 2024 & 2032
- Figure 61: Asia Electronic Offender Monitoring Solutions Industry Revenue Share (%), by Country 2024 & 2032
- Figure 62: Asia Electronic Offender Monitoring Solutions Industry Volume Share (%), by Country 2024 & 2032
- Figure 63: Australia and New Zealand Electronic Offender Monitoring Solutions Industry Revenue (Million), by Technology 2024 & 2032
- Figure 64: Australia and New Zealand Electronic Offender Monitoring Solutions Industry Volume (K Unit), by Technology 2024 & 2032
- Figure 65: Australia and New Zealand Electronic Offender Monitoring Solutions Industry Revenue Share (%), by Technology 2024 & 2032
- Figure 66: Australia and New Zealand Electronic Offender Monitoring Solutions Industry Volume Share (%), by Technology 2024 & 2032
- Figure 67: Australia and New Zealand Electronic Offender Monitoring Solutions Industry Revenue (Million), by Offering 2024 & 2032
- Figure 68: Australia and New Zealand Electronic Offender Monitoring Solutions Industry Volume (K Unit), by Offering 2024 & 2032
- Figure 69: Australia and New Zealand Electronic Offender Monitoring Solutions Industry Revenue Share (%), by Offering 2024 & 2032
- Figure 70: Australia and New Zealand Electronic Offender Monitoring Solutions Industry Volume Share (%), by Offering 2024 & 2032
- Figure 71: Australia and New Zealand Electronic Offender Monitoring Solutions Industry Revenue (Million), by Country 2024 & 2032
- Figure 72: Australia and New Zealand Electronic Offender Monitoring Solutions Industry Volume (K Unit), by Country 2024 & 2032
- Figure 73: Australia and New Zealand Electronic Offender Monitoring Solutions Industry Revenue Share (%), by Country 2024 & 2032
- Figure 74: Australia and New Zealand Electronic Offender Monitoring Solutions Industry Volume Share (%), by Country 2024 & 2032
- Figure 75: Latin America Electronic Offender Monitoring Solutions Industry Revenue (Million), by Technology 2024 & 2032
- Figure 76: Latin America Electronic Offender Monitoring Solutions Industry Volume (K Unit), by Technology 2024 & 2032
- Figure 77: Latin America Electronic Offender Monitoring Solutions Industry Revenue Share (%), by Technology 2024 & 2032
- Figure 78: Latin America Electronic Offender Monitoring Solutions Industry Volume Share (%), by Technology 2024 & 2032
- Figure 79: Latin America Electronic Offender Monitoring Solutions Industry Revenue (Million), by Offering 2024 & 2032
- Figure 80: Latin America Electronic Offender Monitoring Solutions Industry Volume (K Unit), by Offering 2024 & 2032
- Figure 81: Latin America Electronic Offender Monitoring Solutions Industry Revenue Share (%), by Offering 2024 & 2032
- Figure 82: Latin America Electronic Offender Monitoring Solutions Industry Volume Share (%), by Offering 2024 & 2032
- Figure 83: Latin America Electronic Offender Monitoring Solutions Industry Revenue (Million), by Country 2024 & 2032
- Figure 84: Latin America Electronic Offender Monitoring Solutions Industry Volume (K Unit), by Country 2024 & 2032
- Figure 85: Latin America Electronic Offender Monitoring Solutions Industry Revenue Share (%), by Country 2024 & 2032
- Figure 86: Latin America Electronic Offender Monitoring Solutions Industry Volume Share (%), by Country 2024 & 2032
- Figure 87: Middle East and Africa Electronic Offender Monitoring Solutions Industry Revenue (Million), by Technology 2024 & 2032
- Figure 88: Middle East and Africa Electronic Offender Monitoring Solutions Industry Volume (K Unit), by Technology 2024 & 2032
- Figure 89: Middle East and Africa Electronic Offender Monitoring Solutions Industry Revenue Share (%), by Technology 2024 & 2032
- Figure 90: Middle East and Africa Electronic Offender Monitoring Solutions Industry Volume Share (%), by Technology 2024 & 2032
- Figure 91: Middle East and Africa Electronic Offender Monitoring Solutions Industry Revenue (Million), by Offering 2024 & 2032
- Figure 92: Middle East and Africa Electronic Offender Monitoring Solutions Industry Volume (K Unit), by Offering 2024 & 2032
- Figure 93: Middle East and Africa Electronic Offender Monitoring Solutions Industry Revenue Share (%), by Offering 2024 & 2032
- Figure 94: Middle East and Africa Electronic Offender Monitoring Solutions Industry Volume Share (%), by Offering 2024 & 2032
- Figure 95: Middle East and Africa Electronic Offender Monitoring Solutions Industry Revenue (Million), by Country 2024 & 2032
- Figure 96: Middle East and Africa Electronic Offender Monitoring Solutions Industry Volume (K Unit), by Country 2024 & 2032
- Figure 97: Middle East and Africa Electronic Offender Monitoring Solutions Industry Revenue Share (%), by Country 2024 & 2032
- Figure 98: Middle East and Africa Electronic Offender Monitoring Solutions Industry Volume Share (%), by Country 2024 & 2032
List of Tables
- Table 1: Global Electronic Offender Monitoring Solutions Industry Revenue Million Forecast, by Region 2019 & 2032
- Table 2: Global Electronic Offender Monitoring Solutions Industry Volume K Unit Forecast, by Region 2019 & 2032
- Table 3: Global Electronic Offender Monitoring Solutions Industry Revenue Million Forecast, by Technology 2019 & 2032
- Table 4: Global Electronic Offender Monitoring Solutions Industry Volume K Unit Forecast, by Technology 2019 & 2032
- Table 5: Global Electronic Offender Monitoring Solutions Industry Revenue Million Forecast, by Offering 2019 & 2032
- Table 6: Global Electronic Offender Monitoring Solutions Industry Volume K Unit Forecast, by Offering 2019 & 2032
- Table 7: Global Electronic Offender Monitoring Solutions Industry Revenue Million Forecast, by Region 2019 & 2032
- Table 8: Global Electronic Offender Monitoring Solutions Industry Volume K Unit Forecast, by Region 2019 & 2032
- Table 9: Global Electronic Offender Monitoring Solutions Industry Revenue Million Forecast, by Country 2019 & 2032
- Table 10: Global Electronic Offender Monitoring Solutions Industry Volume K Unit Forecast, by Country 2019 & 2032
- Table 11: United States Electronic Offender Monitoring Solutions Industry Revenue (Million) Forecast, by Application 2019 & 2032
- Table 12: United States Electronic Offender Monitoring Solutions Industry Volume (K Unit) Forecast, by Application 2019 & 2032
- Table 13: Canada Electronic Offender Monitoring Solutions Industry Revenue (Million) Forecast, by Application 2019 & 2032
- Table 14: Canada Electronic Offender Monitoring Solutions Industry Volume (K Unit) Forecast, by Application 2019 & 2032
- Table 15: Mexico Electronic Offender Monitoring Solutions Industry Revenue (Million) Forecast, by Application 2019 & 2032
- Table 16: Mexico Electronic Offender Monitoring Solutions Industry Volume (K Unit) Forecast, by Application 2019 & 2032
- Table 17: Global Electronic Offender Monitoring Solutions Industry Revenue Million Forecast, by Country 2019 & 2032
- Table 18: Global Electronic Offender Monitoring Solutions Industry Volume K Unit Forecast, by Country 2019 & 2032
- Table 19: Germany Electronic Offender Monitoring Solutions Industry Revenue (Million) Forecast, by Application 2019 & 2032
- Table 20: Germany Electronic Offender Monitoring Solutions Industry Volume (K Unit) Forecast, by Application 2019 & 2032
- Table 21: United Kingdom Electronic Offender Monitoring Solutions Industry Revenue (Million) Forecast, by Application 2019 & 2032
- Table 22: United Kingdom Electronic Offender Monitoring Solutions Industry Volume (K Unit) Forecast, by Application 2019 & 2032
- Table 23: France Electronic Offender Monitoring Solutions Industry Revenue (Million) Forecast, by Application 2019 & 2032
- Table 24: France Electronic Offender Monitoring Solutions Industry Volume (K Unit) Forecast, by Application 2019 & 2032
- Table 25: Spain Electronic Offender Monitoring Solutions Industry Revenue (Million) Forecast, by Application 2019 & 2032
- Table 26: Spain Electronic Offender Monitoring Solutions Industry Volume (K Unit) Forecast, by Application 2019 & 2032
- Table 27: Italy Electronic Offender Monitoring Solutions Industry Revenue (Million) Forecast, by Application 2019 & 2032
- Table 28: Italy Electronic Offender Monitoring Solutions Industry Volume (K Unit) Forecast, by Application 2019 & 2032
- Table 29: Spain Electronic Offender Monitoring Solutions Industry Revenue (Million) Forecast, by Application 2019 & 2032
- Table 30: Spain Electronic Offender Monitoring Solutions Industry Volume (K Unit) Forecast, by Application 2019 & 2032
- Table 31: Belgium Electronic Offender Monitoring Solutions Industry Revenue (Million) Forecast, by Application 2019 & 2032
- Table 32: Belgium Electronic Offender Monitoring Solutions Industry Volume (K Unit) Forecast, by Application 2019 & 2032
- Table 33: Netherland Electronic Offender Monitoring Solutions Industry Revenue (Million) Forecast, by Application 2019 & 2032
- Table 34: Netherland Electronic Offender Monitoring Solutions Industry Volume (K Unit) Forecast, by Application 2019 & 2032
- Table 35: Nordics Electronic Offender Monitoring Solutions Industry Revenue (Million) Forecast, by Application 2019 & 2032
- Table 36: Nordics Electronic Offender Monitoring Solutions Industry Volume (K Unit) Forecast, by Application 2019 & 2032
- Table 37: Rest of Europe Electronic Offender Monitoring Solutions Industry Revenue (Million) Forecast, by Application 2019 & 2032
- Table 38: Rest of Europe Electronic Offender Monitoring Solutions Industry Volume (K Unit) Forecast, by Application 2019 & 2032
- Table 39: Global Electronic Offender Monitoring Solutions Industry Revenue Million Forecast, by Country 2019 & 2032
- Table 40: Global Electronic Offender Monitoring Solutions Industry Volume K Unit Forecast, by Country 2019 & 2032
- Table 41: China Electronic Offender Monitoring Solutions Industry Revenue (Million) Forecast, by Application 2019 & 2032
- Table 42: China Electronic Offender Monitoring Solutions Industry Volume (K Unit) Forecast, by Application 2019 & 2032
- Table 43: Japan Electronic Offender Monitoring Solutions Industry Revenue (Million) Forecast, by Application 2019 & 2032
- Table 44: Japan Electronic Offender Monitoring Solutions Industry Volume (K Unit) Forecast, by Application 2019 & 2032
- Table 45: India Electronic Offender Monitoring Solutions Industry Revenue (Million) Forecast, by Application 2019 & 2032
- Table 46: India Electronic Offender Monitoring Solutions Industry Volume (K Unit) Forecast, by Application 2019 & 2032
- Table 47: South Korea Electronic Offender Monitoring Solutions Industry Revenue (Million) Forecast, by Application 2019 & 2032
- Table 48: South Korea Electronic Offender Monitoring Solutions Industry Volume (K Unit) Forecast, by Application 2019 & 2032
- Table 49: Southeast Asia Electronic Offender Monitoring Solutions Industry Revenue (Million) Forecast, by Application 2019 & 2032
- Table 50: Southeast Asia Electronic Offender Monitoring Solutions Industry Volume (K Unit) Forecast, by Application 2019 & 2032
- Table 51: Australia Electronic Offender Monitoring Solutions Industry Revenue (Million) Forecast, by Application 2019 & 2032
- Table 52: Australia Electronic Offender Monitoring Solutions Industry Volume (K Unit) Forecast, by Application 2019 & 2032
- Table 53: Indonesia Electronic Offender Monitoring Solutions Industry Revenue (Million) Forecast, by Application 2019 & 2032
- Table 54: Indonesia Electronic Offender Monitoring Solutions Industry Volume (K Unit) Forecast, by Application 2019 & 2032
- Table 55: Phillipes Electronic Offender Monitoring Solutions Industry Revenue (Million) Forecast, by Application 2019 & 2032
- Table 56: Phillipes Electronic Offender Monitoring Solutions Industry Volume (K Unit) Forecast, by Application 2019 & 2032
- Table 57: Singapore Electronic Offender Monitoring Solutions Industry Revenue (Million) Forecast, by Application 2019 & 2032
- Table 58: Singapore Electronic Offender Monitoring Solutions Industry Volume (K Unit) Forecast, by Application 2019 & 2032
- Table 59: Thailandc Electronic Offender Monitoring Solutions Industry Revenue (Million) Forecast, by Application 2019 & 2032
- Table 60: Thailandc Electronic Offender Monitoring Solutions Industry Volume (K Unit) Forecast, by Application 2019 & 2032
- Table 61: Rest of Asia Pacific Electronic Offender Monitoring Solutions Industry Revenue (Million) Forecast, by Application 2019 & 2032
- Table 62: Rest of Asia Pacific Electronic Offender Monitoring Solutions Industry Volume (K Unit) Forecast, by Application 2019 & 2032
- Table 63: Global Electronic Offender Monitoring Solutions Industry Revenue Million Forecast, by Country 2019 & 2032
- Table 64: Global Electronic Offender Monitoring Solutions Industry Volume K Unit Forecast, by Country 2019 & 2032
- Table 65: Brazil Electronic Offender Monitoring Solutions Industry Revenue (Million) Forecast, by Application 2019 & 2032
- Table 66: Brazil Electronic Offender Monitoring Solutions Industry Volume (K Unit) Forecast, by Application 2019 & 2032
- Table 67: Argentina Electronic Offender Monitoring Solutions Industry Revenue (Million) Forecast, by Application 2019 & 2032
- Table 68: Argentina Electronic Offender Monitoring Solutions Industry Volume (K Unit) Forecast, by Application 2019 & 2032
- Table 69: Peru Electronic Offender Monitoring Solutions Industry Revenue (Million) Forecast, by Application 2019 & 2032
- Table 70: Peru Electronic Offender Monitoring Solutions Industry Volume (K Unit) Forecast, by Application 2019 & 2032
- Table 71: Chile Electronic Offender Monitoring Solutions Industry Revenue (Million) Forecast, by Application 2019 & 2032
- Table 72: Chile Electronic Offender Monitoring Solutions Industry Volume (K Unit) Forecast, by Application 2019 & 2032
- Table 73: Colombia Electronic Offender Monitoring Solutions Industry Revenue (Million) Forecast, by Application 2019 & 2032
- Table 74: Colombia Electronic Offender Monitoring Solutions Industry Volume (K Unit) Forecast, by Application 2019 & 2032
- Table 75: Ecuador Electronic Offender Monitoring Solutions Industry Revenue (Million) Forecast, by Application 2019 & 2032
- Table 76: Ecuador Electronic Offender Monitoring Solutions Industry Volume (K Unit) Forecast, by Application 2019 & 2032
- Table 77: Venezuela Electronic Offender Monitoring Solutions Industry Revenue (Million) Forecast, by Application 2019 & 2032
- Table 78: Venezuela Electronic Offender Monitoring Solutions Industry Volume (K Unit) Forecast, by Application 2019 & 2032
- Table 79: Rest of South America Electronic Offender Monitoring Solutions Industry Revenue (Million) Forecast, by Application 2019 & 2032
- Table 80: Rest of South America Electronic Offender Monitoring Solutions Industry Volume (K Unit) Forecast, by Application 2019 & 2032
- Table 81: Global Electronic Offender Monitoring Solutions Industry Revenue Million Forecast, by Country 2019 & 2032
- Table 82: Global Electronic Offender Monitoring Solutions Industry Volume K Unit Forecast, by Country 2019 & 2032
- Table 83: United States Electronic Offender Monitoring Solutions Industry Revenue (Million) Forecast, by Application 2019 & 2032
- Table 84: United States Electronic Offender Monitoring Solutions Industry Volume (K Unit) Forecast, by Application 2019 & 2032
- Table 85: Canada Electronic Offender Monitoring Solutions Industry Revenue (Million) Forecast, by Application 2019 & 2032
- Table 86: Canada Electronic Offender Monitoring Solutions Industry Volume (K Unit) Forecast, by Application 2019 & 2032
- Table 87: Mexico Electronic Offender Monitoring Solutions Industry Revenue (Million) Forecast, by Application 2019 & 2032
- Table 88: Mexico Electronic Offender Monitoring Solutions Industry Volume (K Unit) Forecast, by Application 2019 & 2032
- Table 89: Global Electronic Offender Monitoring Solutions Industry Revenue Million Forecast, by Country 2019 & 2032
- Table 90: Global Electronic Offender Monitoring Solutions Industry Volume K Unit Forecast, by Country 2019 & 2032
- Table 91: United Arab Emirates Electronic Offender Monitoring Solutions Industry Revenue (Million) Forecast, by Application 2019 & 2032
- Table 92: United Arab Emirates Electronic Offender Monitoring Solutions Industry Volume (K Unit) Forecast, by Application 2019 & 2032
- Table 93: Saudi Arabia Electronic Offender Monitoring Solutions Industry Revenue (Million) Forecast, by Application 2019 & 2032
- Table 94: Saudi Arabia Electronic Offender Monitoring Solutions Industry Volume (K Unit) Forecast, by Application 2019 & 2032
- Table 95: South Africa Electronic Offender Monitoring Solutions Industry Revenue (Million) Forecast, by Application 2019 & 2032
- Table 96: South Africa Electronic Offender Monitoring Solutions Industry Volume (K Unit) Forecast, by Application 2019 & 2032
- Table 97: Rest of Middle East and Africa Electronic Offender Monitoring Solutions Industry Revenue (Million) Forecast, by Application 2019 & 2032
- Table 98: Rest of Middle East and Africa Electronic Offender Monitoring Solutions Industry Volume (K Unit) Forecast, by Application 2019 & 2032
- Table 99: Global Electronic Offender Monitoring Solutions Industry Revenue Million Forecast, by Technology 2019 & 2032
- Table 100: Global Electronic Offender Monitoring Solutions Industry Volume K Unit Forecast, by Technology 2019 & 2032
- Table 101: Global Electronic Offender Monitoring Solutions Industry Revenue Million Forecast, by Offering 2019 & 2032
- Table 102: Global Electronic Offender Monitoring Solutions Industry Volume K Unit Forecast, by Offering 2019 & 2032
- Table 103: Global Electronic Offender Monitoring Solutions Industry Revenue Million Forecast, by Country 2019 & 2032
- Table 104: Global Electronic Offender Monitoring Solutions Industry Volume K Unit Forecast, by Country 2019 & 2032
- Table 105: Global Electronic Offender Monitoring Solutions Industry Revenue Million Forecast, by Technology 2019 & 2032
- Table 106: Global Electronic Offender Monitoring Solutions Industry Volume K Unit Forecast, by Technology 2019 & 2032
- Table 107: Global Electronic Offender Monitoring Solutions Industry Revenue Million Forecast, by Offering 2019 & 2032
- Table 108: Global Electronic Offender Monitoring Solutions Industry Volume K Unit Forecast, by Offering 2019 & 2032
- Table 109: Global Electronic Offender Monitoring Solutions Industry Revenue Million Forecast, by Country 2019 & 2032
- Table 110: Global Electronic Offender Monitoring Solutions Industry Volume K Unit Forecast, by Country 2019 & 2032
- Table 111: Global Electronic Offender Monitoring Solutions Industry Revenue Million Forecast, by Technology 2019 & 2032
- Table 112: Global Electronic Offender Monitoring Solutions Industry Volume K Unit Forecast, by Technology 2019 & 2032
- Table 113: Global Electronic Offender Monitoring Solutions Industry Revenue Million Forecast, by Offering 2019 & 2032
- Table 114: Global Electronic Offender Monitoring Solutions Industry Volume K Unit Forecast, by Offering 2019 & 2032
- Table 115: Global Electronic Offender Monitoring Solutions Industry Revenue Million Forecast, by Country 2019 & 2032
- Table 116: Global Electronic Offender Monitoring Solutions Industry Volume K Unit Forecast, by Country 2019 & 2032
- Table 117: Global Electronic Offender Monitoring Solutions Industry Revenue Million Forecast, by Technology 2019 & 2032
- Table 118: Global Electronic Offender Monitoring Solutions Industry Volume K Unit Forecast, by Technology 2019 & 2032
- Table 119: Global Electronic Offender Monitoring Solutions Industry Revenue Million Forecast, by Offering 2019 & 2032
- Table 120: Global Electronic Offender Monitoring Solutions Industry Volume K Unit Forecast, by Offering 2019 & 2032
- Table 121: Global Electronic Offender Monitoring Solutions Industry Revenue Million Forecast, by Country 2019 & 2032
- Table 122: Global Electronic Offender Monitoring Solutions Industry Volume K Unit Forecast, by Country 2019 & 2032
- Table 123: Global Electronic Offender Monitoring Solutions Industry Revenue Million Forecast, by Technology 2019 & 2032
- Table 124: Global Electronic Offender Monitoring Solutions Industry Volume K Unit Forecast, by Technology 2019 & 2032
- Table 125: Global Electronic Offender Monitoring Solutions Industry Revenue Million Forecast, by Offering 2019 & 2032
- Table 126: Global Electronic Offender Monitoring Solutions Industry Volume K Unit Forecast, by Offering 2019 & 2032
- Table 127: Global Electronic Offender Monitoring Solutions Industry Revenue Million Forecast, by Country 2019 & 2032
- Table 128: Global Electronic Offender Monitoring Solutions Industry Volume K Unit Forecast, by Country 2019 & 2032
- Table 129: Global Electronic Offender Monitoring Solutions Industry Revenue Million Forecast, by Technology 2019 & 2032
- Table 130: Global Electronic Offender Monitoring Solutions Industry Volume K Unit Forecast, by Technology 2019 & 2032
- Table 131: Global Electronic Offender Monitoring Solutions Industry Revenue Million Forecast, by Offering 2019 & 2032
- Table 132: Global Electronic Offender Monitoring Solutions Industry Volume K Unit Forecast, by Offering 2019 & 2032
- Table 133: Global Electronic Offender Monitoring Solutions Industry Revenue Million Forecast, by Country 2019 & 2032
- Table 134: Global Electronic Offender Monitoring Solutions Industry Volume K Unit Forecast, by Country 2019 & 2032
Frequently Asked Questions
1. What is the projected Compound Annual Growth Rate (CAGR) of the Electronic Offender Monitoring Solutions Industry?
The projected CAGR is approximately 9.50%.
2. Which companies are prominent players in the Electronic Offender Monitoring Solutions Industry?
Key companies in the market include BI Incorporated, Geosatis, Upstreem, Corrisoft com, Synergye, Supercom, AMOS Spacecom, Buddi AI, G4S Limited, Attenti, Securus Technologies LLC, Alcohol Monitoring Systems Inc (SCRAM Systems), TRACK GROUP.
3. What are the main segments of the Electronic Offender Monitoring Solutions Industry?
The market segments include Technology, Offering.
4. Can you provide details about the market size?
The market size is estimated to be USD 1.34 Million as of 2022.
5. What are some drivers contributing to market growth?
The Prison Overcrowding Worsened by the COVID-19 Pandemic; Growing Adoption of Victim Protection Solutions.
6. What are the notable trends driving market growth?
Global Positioning System Driving the Market Growth.
7. Are there any restraints impacting market growth?
Electronic Offender Monitoring Devices Can Be Tampered by Offenders.
8. Can you provide examples of recent developments in the market?
October 2022: B.I. Incorporated, the U.S. player for electronic monitoring products and services, entered an exclusive agreement with OMNIA Partners Public Sector that allowed national city, county, and state government agencies to contract with B.I. for its community corrections supervision technologies at competitive costs. Participating agencies save time and effort by skipping the lengthy Request for Proposal process.
9. What pricing options are available for accessing the report?
Pricing options include single-user, multi-user, and enterprise licenses priced at USD 4750, USD 5250, and USD 8750 respectively.
10. Is the market size provided in terms of value or volume?
The market size is provided in terms of value, measured in Million and volume, measured in K Unit.
11. Are there any specific market keywords associated with the report?
Yes, the market keyword associated with the report is "Electronic Offender Monitoring Solutions Industry," which aids in identifying and referencing the specific market segment covered.
12. How do I determine which pricing option suits my needs best?
The pricing options vary based on user requirements and access needs. Individual users may opt for single-user licenses, while businesses requiring broader access may choose multi-user or enterprise licenses for cost-effective access to the report.
13. Are there any additional resources or data provided in the Electronic Offender Monitoring Solutions Industry report?
While the report offers comprehensive insights, it's advisable to review the specific contents or supplementary materials provided to ascertain if additional resources or data are available.
14. How can I stay updated on further developments or reports in the Electronic Offender Monitoring Solutions Industry?
To stay informed about further developments, trends, and reports in the Electronic Offender Monitoring Solutions Industry, consider subscribing to industry newsletters, following relevant companies and organizations, or regularly checking reputable industry news sources and publications.
Methodology
Step 1 - Identification of Relevant Samples Size from Population Database


Step 2 - Approaches for Defining Global Market Size (Value, Volume* & Price*)

Note*: In applicable scenarios
Step 3 - Data Sources
Primary Research
- Web Analytics
- Survey Reports
- Research Institute
- Latest Research Reports
- Opinion Leaders
Secondary Research
- Annual Reports
- White Paper
- Latest Press Release
- Industry Association
- Paid Database
- Investor Presentations

Step 4 - Data Triangulation
Involves using different sources of information in order to increase the validity of a study
These sources are likely to be stakeholders in a program - participants, other researchers, program staff, other community members, and so on.
Then we put all data in single framework & apply various statistical tools to find out the dynamic on the market.
During the analysis stage, feedback from the stakeholder groups would be compared to determine areas of agreement as well as areas of divergence


