
Key Insights
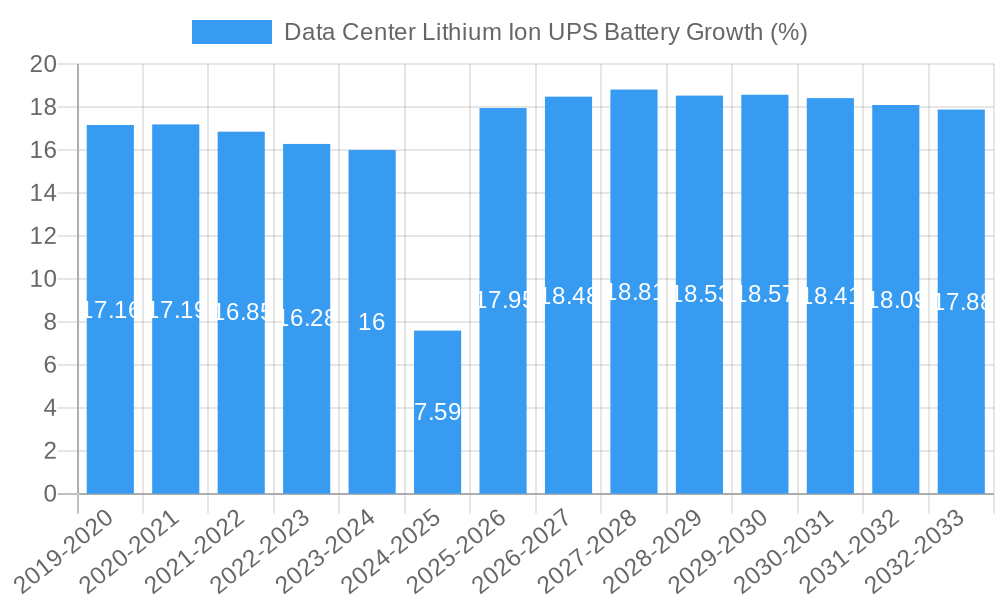
The global Data Center Lithium Ion UPS Battery market is poised for robust expansion, projected to reach an estimated $15,600 million by 2025, driven by an impressive Compound Annual Growth Rate (CAGR) of 18.5% during the 2019-2033 study period. This significant growth is primarily fueled by the escalating demand for highly reliable and efficient power backup solutions in data centers, a direct consequence of the exponential increase in data generation and consumption worldwide. Key drivers include the proliferation of cloud computing, the burgeoning Internet of Things (IoT) ecosystem, and the growing adoption of Artificial Intelligence (AI) and machine learning, all of which necessitate uninterrupted power supply to maintain optimal data center operations. The superior energy density, longer lifespan, faster charging capabilities, and improved safety features of lithium-ion batteries, particularly LiFePO4 and Ternary Lithium chemistries, make them an increasingly attractive alternative to traditional lead-acid batteries, further accelerating market adoption.
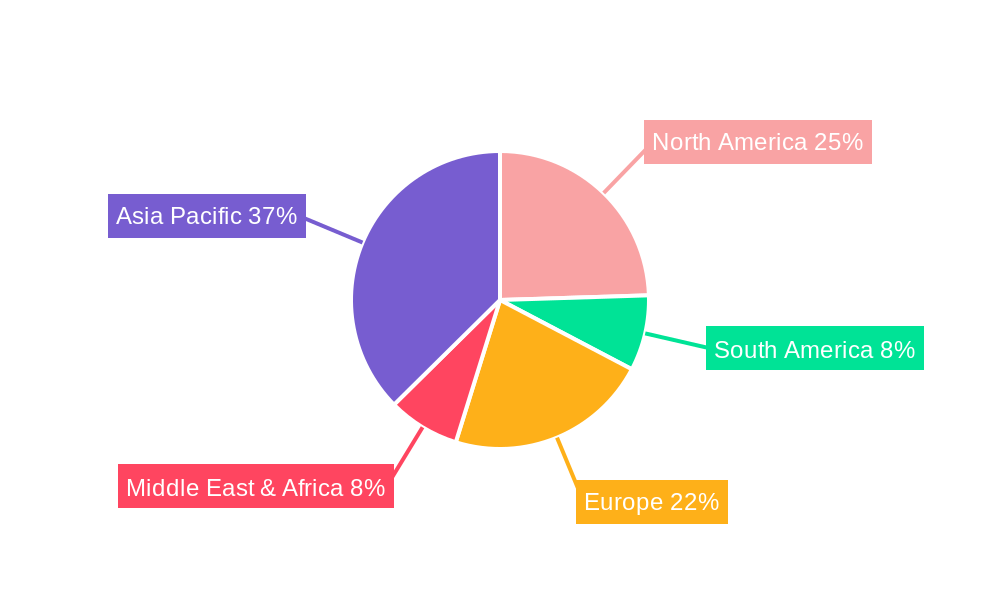
The market's trajectory is further shaped by critical trends such as the increasing adoption of high-density data centers and the growing focus on energy efficiency and sustainability within the IT infrastructure. These trends are pushing data center operators to invest in advanced UPS battery technologies that offer better performance and reduced environmental impact. While the market enjoys strong growth, certain restraints, such as the initial higher capital expenditure compared to lead-acid batteries and evolving battery recycling regulations, may temper the pace of adoption in some segments. However, the long-term operational cost savings and performance advantages are expected to outweigh these initial challenges. The market is segmented by application into Large Data Centers and Small and Medium Data Centers, with Large Data Centers currently dominating due to their scale and critical uptime requirements. Geographically, Asia Pacific, led by China and India, is emerging as a dominant region, driven by rapid digital transformation and substantial investments in data center infrastructure.
Data Center Lithium Ion UPS Battery Market Dynamics & Structure
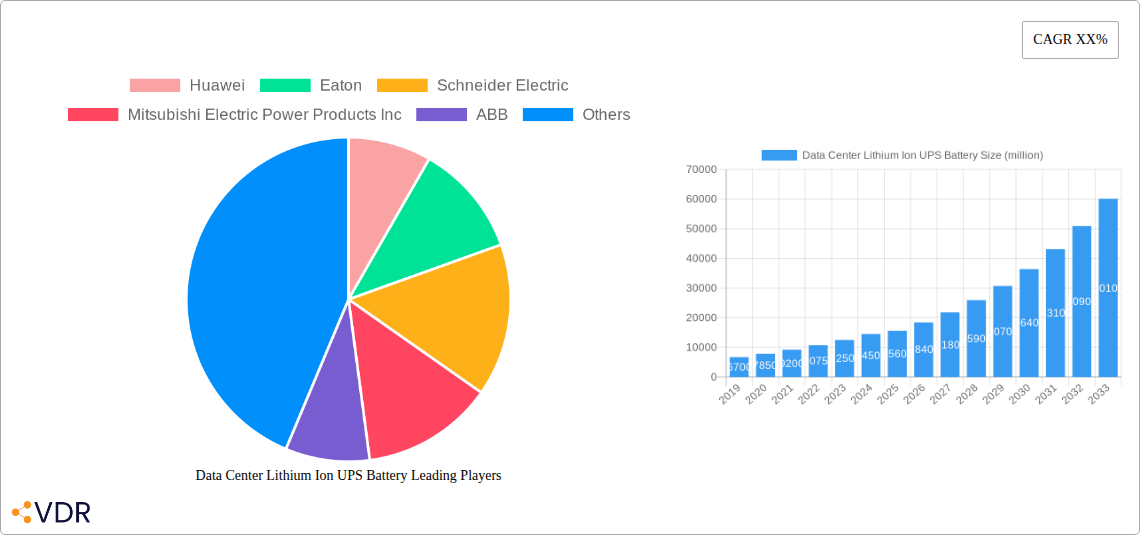
The global Data Center Lithium Ion UPS Battery market is characterized by a moderately concentrated structure, with key players like Huawei, Eaton, Schneider Electric, Mitsubishi Electric Power Products Inc, ABB, and Narada holding significant market shares. Technological innovation is a primary driver, fueled by the increasing demand for higher energy density, faster charging capabilities, and improved safety features in UPS systems. The escalating adoption of lithium-ion technology over traditional lead-acid batteries is driven by their longer lifespan, higher efficiency, and reduced environmental impact. Regulatory frameworks, particularly those focused on energy efficiency and sustainability, are indirectly influencing market growth by promoting the adoption of advanced UPS solutions. Competitive product substitutes, primarily advanced lead-acid technologies, are gradually losing ground to the superior performance metrics of lithium-ion. End-user demographics are increasingly dominated by hyperscale cloud providers, colocation facilities, and enterprises with critical IT infrastructure, all seeking reliable and scalable power protection. Mergers and acquisition (M&A) trends are observed as established power management companies acquire specialized lithium-ion battery manufacturers to integrate solutions and expand their offerings. The market is witnessing a CAGR of approximately 12.5% during the forecast period.
- Market Concentration: Moderately concentrated with dominance by a few multinational corporations.
- Technological Innovation Drivers: Demand for higher energy density, faster charging, enhanced safety, and longer cycle life.
- Regulatory Frameworks: Indirect influence through energy efficiency standards and environmental regulations.
- Competitive Product Substitutes: Advanced lead-acid batteries, but facing increasing obsolescence.
- End-User Demographics: Hyperscale data centers, colocation facilities, enterprises, and edge computing deployments.
- M&A Trends: Consolidation for integrated solutions and market expansion.
Data Center Lithium Ion UPS Battery Growth Trends & Insights
The global Data Center Lithium Ion UPS Battery market is experiencing robust growth, driven by the insatiable demand for reliable and efficient power solutions for the ever-expanding digital infrastructure. The market size, which was valued at approximately $2.8 billion in 2024, is projected to surge to an impressive $7.2 billion by 2033, exhibiting a Compound Annual Growth Rate (CAGR) of 11.8% from 2025 to 2033. This significant expansion is underpinned by a fundamental shift in data center design and operational priorities. The inherent advantages of lithium-ion batteries, such as their superior energy density, extended lifespan (often exceeding 10-15 years compared to 3-5 years for lead-acid), and faster charging capabilities, are making them the preferred choice for modern data centers.
The adoption rates of lithium-ion UPS batteries have accelerated dramatically, moving from niche applications to mainstream deployment in both large-scale hyperscale facilities and smaller, medium-sized operations. This surge is attributed to a confluence of factors, including decreasing battery costs driven by advancements in manufacturing and economies of scale, and the increasing awareness of the total cost of ownership (TCO) benefits offered by lithium-ion, which often outweigh the initial higher capital expenditure. Technological disruptions are at the forefront of this growth. Specifically, the evolution of lithium-ion chemistries, such as Lithium Iron Phosphate (LiFePO4), is addressing previous concerns regarding thermal runaway and safety, making them ideal for the stringent operational environments of data centers. Ternary lithium batteries, while offering higher energy density, are also finding their place in applications where space is at a premium.
Consumer behavior shifts are also playing a crucial role. Data center operators are increasingly prioritizing sustainability and operational efficiency. Lithium-ion batteries contribute to this by offering higher energy efficiency, reducing energy waste, and their longer lifespan minimizes the frequency of replacements, thereby reducing the environmental footprint associated with battery disposal. Furthermore, the trend towards edge computing and the decentralization of data processing is creating a demand for more compact and efficient UPS solutions, a niche that lithium-ion batteries are ideally positioned to fill. The increasing complexity and criticality of data center operations necessitate uninterruptible power supplies that can offer greater reliability and faster response times, features that lithium-ion UPS batteries consistently deliver. The projected market penetration of lithium-ion UPS batteries in the overall UPS market is expected to surpass 60% by 2033.
Dominant Regions, Countries, or Segments in Data Center Lithium Ion UPS Battery
The Large Data Center segment is the undisputed leader in driving the growth of the Data Center Lithium Ion UPS Battery market, both in terms of market share and growth potential. These massive facilities, operated by hyperscale cloud providers and major enterprises, require the highest levels of power reliability, scalability, and efficiency. The sheer power demands of large data centers necessitate advanced UPS solutions that can handle significant loads and provide extended backup times without compromising performance. Lithium-ion batteries, with their superior energy density and longer operational lifespans, are perfectly suited to meet these demanding requirements.
North America, particularly the United States, currently holds the dominant position in the global market. This dominance is attributed to the presence of a vast number of hyperscale data centers, significant investments in cloud infrastructure, and a strong focus on technological innovation and energy efficiency. Favorable economic policies, robust IT infrastructure, and a high adoption rate of advanced technologies contribute to North America's leading status. The region is expected to maintain its supremacy throughout the forecast period, driven by ongoing data center construction and upgrades.
The LiFePO4 battery type is emerging as a highly influential segment within the Data Center Lithium Ion UPS Battery market. Its inherent safety features, including excellent thermal stability and resistance to thermal runaway, make it the preferred chemistry for critical data center applications where safety is paramount. While Ternary Lithium batteries offer higher energy density, the enhanced safety profile of LiFePO4 is a significant advantage in the high-stakes environment of data centers. This preference for safety, coupled with the continuously improving energy density and cost-effectiveness of LiFePO4, positions it for sustained growth and market dominance. The total market size for Data Center Lithium Ion UPS Battery is estimated to be $2.8 billion in 2025, with Large Data Centers accounting for approximately 70% of this value. LiFePO4 batteries are projected to capture over 75% of the lithium-ion UPS battery market by 2033.
- Dominant Application Segment: Large Data Center
- Market Share: Expected to constitute over 70% of the total market value by 2025.
- Growth Potential: High, driven by hyperscale expansion and AI infrastructure build-out.
- Key Drivers: Need for high power capacity, reliability, and energy efficiency.
- Dominant Region: North America
- Market Share: Anticipated to hold over 40% of the global market by 2025.
- Growth Potential: Continued strong growth due to ongoing cloud infrastructure investments.
- Key Drivers: Presence of major cloud providers, supportive government initiatives, and technological advancements.
- Dominant Battery Type: LiFePO4
- Market Share: Projected to exceed 75% of the lithium-ion UPS battery market by 2033.
- Growth Potential: Significant, driven by safety concerns and improving performance metrics.
- Key Drivers: Superior safety profile, long cycle life, and competitive cost of ownership.
Data Center Lithium Ion UPS Battery Product Landscape
The product landscape for Data Center Lithium Ion UPS Batteries is rapidly evolving, with a strong emphasis on enhancing performance, safety, and integration capabilities. Manufacturers are focusing on developing advanced battery management systems (BMS) that offer intelligent monitoring, predictive maintenance, and optimized charging/discharging cycles. Innovations include higher energy density modules to reduce footprint, faster charging technologies to minimize downtime, and improved thermal management systems to ensure operational stability in demanding environments. Unique selling propositions often revolve around extended warranty periods, modular designs for scalability, and seamless integration with existing data center infrastructure and software platforms. The performance metrics of these batteries are characterized by high cycle life, exceeding 10,000 cycles for some LiFePO4 variants, low self-discharge rates, and wide operating temperature ranges, crucial for data center reliability.
Key Drivers, Barriers & Challenges in Data Center Lithium Ion UPS Battery
Key Drivers: The primary forces propelling the Data Center Lithium Ion UPS Battery market are the relentless growth of data generation, the expansion of cloud computing and AI workloads, and the increasing demand for high-performance, energy-efficient, and reliable power solutions. Technological advancements in battery chemistry and management systems are making lithium-ion UPS more attractive. Furthermore, stringent regulations and corporate sustainability goals are pushing data center operators towards greener and more efficient power backup solutions.
Barriers & Challenges: Despite the strong growth trajectory, several challenges and barriers exist. The initial capital cost of lithium-ion UPS systems, although decreasing, can still be a barrier for some organizations compared to traditional lead-acid batteries. Supply chain volatility for critical raw materials like lithium and cobalt can impact pricing and availability. Furthermore, the evolving regulatory landscape regarding battery disposal and recycling requires careful consideration. Competitive pressures from established lead-acid technologies, albeit declining, and concerns around the long-term safety and thermal management of certain lithium-ion chemistries, although largely addressed by LiFePO4, continue to be factors.
Emerging Opportunities in Data Center Lithium Ion UPS Battery
Emerging opportunities lie in the rapidly growing edge computing sector, which requires compact, efficient, and reliable UPS solutions for distributed infrastructure. The increasing adoption of renewable energy sources in data centers presents an opportunity for integrated energy storage solutions that combine UPS functionality with grid stabilization and energy arbitrage. Furthermore, advancements in battery recycling technologies and the development of circular economy models for lithium-ion batteries offer a sustainable growth avenue. The development of smart grid integration capabilities within UPS systems for enhanced grid resilience is also a significant emerging trend.
Growth Accelerators in the Data Center Lithium Ion UPS Battery Industry
Key catalysts driving long-term growth in the Data Center Lithium Ion UPS Battery industry include continuous advancements in battery materials science, leading to even higher energy densities and improved safety profiles. Strategic partnerships between battery manufacturers, UPS providers, and data center operators are accelerating the development and deployment of integrated solutions. Market expansion into emerging economies with rapidly developing digital infrastructure presents significant growth opportunities. The ongoing digital transformation across all industries fuels the demand for more robust and efficient data center power protection.
Key Players Shaping the Data Center Lithium Ion UPS Battery Market
- Huawei
- Eaton
- Schneider Electric
- Mitsubishi Electric Power Products Inc
- ABB
- Narada
Notable Milestones in Data Center Lithium Ion UPS Battery Sector
- 2019: Increased adoption of LiFePO4 chemistry for enhanced safety in enterprise-level UPS systems.
- 2020: Major UPS manufacturers begin offering integrated lithium-ion solutions for large data centers.
- 2021: Significant price reductions in lithium-ion battery cells due to manufacturing advancements.
- 2022: Growing focus on modular and scalable lithium-ion UPS designs for flexible data center expansions.
- 2023: Emergence of advanced Battery Management Systems (BMS) with AI-driven predictive maintenance capabilities.
- 2024: Increased regulatory emphasis on battery recycling and sustainability within the data center industry.
- 2025 (Estimated): Further integration of lithium-ion UPS with renewable energy sources for hybrid power solutions.
In-Depth Data Center Lithium Ion UPS Battery Market Outlook
The outlook for the Data Center Lithium Ion UPS Battery market remains exceptionally strong, driven by an ongoing surge in digitalization and the insatiable demand for reliable power for critical IT infrastructure. Growth accelerators such as relentless technological innovation in battery chemistries and management systems, coupled with strategic alliances between key industry players, are poised to further propel market expansion. The increasing adoption of lithium-ion technology in emerging economies, alongside the continuous evolution of edge computing and AI workloads, presents substantial untapped market potential. The future of data center power protection is undeniably intertwined with the advanced capabilities and long-term sustainability offered by lithium-ion UPS batteries.
Data Center Lithium Ion UPS Battery Segmentation
-
1. Application
- 1.1. Large Data Center
- 1.2. Small and Medium Data Center
-
2. Types
- 2.1. LiFePO4
- 2.2. Ternary Lithium
Data Center Lithium Ion UPS Battery Segmentation By Geography
-
1. North America
- 1.1. United States
- 1.2. Canada
- 1.3. Mexico
-
2. South America
- 2.1. Brazil
- 2.2. Argentina
- 2.3. Rest of South America
-
3. Europe
- 3.1. United Kingdom
- 3.2. Germany
- 3.3. France
- 3.4. Italy
- 3.5. Spain
- 3.6. Russia
- 3.7. Benelux
- 3.8. Nordics
- 3.9. Rest of Europe
-
4. Middle East & Africa
- 4.1. Turkey
- 4.2. Israel
- 4.3. GCC
- 4.4. North Africa
- 4.5. South Africa
- 4.6. Rest of Middle East & Africa
-
5. Asia Pacific
- 5.1. China
- 5.2. India
- 5.3. Japan
- 5.4. South Korea
- 5.5. ASEAN
- 5.6. Oceania
- 5.7. Rest of Asia Pacific
Data Center Lithium Ion UPS Battery REPORT HIGHLIGHTS
| Aspects | Details |
|---|---|
| Study Period | 2019-2033 |
| Base Year | 2024 |
| Estimated Year | 2025 |
| Forecast Period | 2025-2033 |
| Historical Period | 2019-2024 |
| Growth Rate | CAGR of XX% from 2019-2033 |
| Segmentation |
|
Table of Contents
- 1. Introduction
- 1.1. Research Scope
- 1.2. Market Segmentation
- 1.3. Research Methodology
- 1.4. Definitions and Assumptions
- 2. Executive Summary
- 2.1. Introduction
- 3. Market Dynamics
- 3.1. Introduction
- 3.2. Market Drivers
- 3.3. Market Restrains
- 3.4. Market Trends
- 4. Market Factor Analysis
- 4.1. Porters Five Forces
- 4.2. Supply/Value Chain
- 4.3. PESTEL analysis
- 4.4. Market Entropy
- 4.5. Patent/Trademark Analysis
- 5. Global Data Center Lithium Ion UPS Battery Analysis, Insights and Forecast, 2019-2031
- 5.1. Market Analysis, Insights and Forecast - by Application
- 5.1.1. Large Data Center
- 5.1.2. Small and Medium Data Center
- 5.2. Market Analysis, Insights and Forecast - by Types
- 5.2.1. LiFePO4
- 5.2.2. Ternary Lithium
- 5.3. Market Analysis, Insights and Forecast - by Region
- 5.3.1. North America
- 5.3.2. South America
- 5.3.3. Europe
- 5.3.4. Middle East & Africa
- 5.3.5. Asia Pacific
- 5.1. Market Analysis, Insights and Forecast - by Application
- 6. North America Data Center Lithium Ion UPS Battery Analysis, Insights and Forecast, 2019-2031
- 6.1. Market Analysis, Insights and Forecast - by Application
- 6.1.1. Large Data Center
- 6.1.2. Small and Medium Data Center
- 6.2. Market Analysis, Insights and Forecast - by Types
- 6.2.1. LiFePO4
- 6.2.2. Ternary Lithium
- 6.1. Market Analysis, Insights and Forecast - by Application
- 7. South America Data Center Lithium Ion UPS Battery Analysis, Insights and Forecast, 2019-2031
- 7.1. Market Analysis, Insights and Forecast - by Application
- 7.1.1. Large Data Center
- 7.1.2. Small and Medium Data Center
- 7.2. Market Analysis, Insights and Forecast - by Types
- 7.2.1. LiFePO4
- 7.2.2. Ternary Lithium
- 7.1. Market Analysis, Insights and Forecast - by Application
- 8. Europe Data Center Lithium Ion UPS Battery Analysis, Insights and Forecast, 2019-2031
- 8.1. Market Analysis, Insights and Forecast - by Application
- 8.1.1. Large Data Center
- 8.1.2. Small and Medium Data Center
- 8.2. Market Analysis, Insights and Forecast - by Types
- 8.2.1. LiFePO4
- 8.2.2. Ternary Lithium
- 8.1. Market Analysis, Insights and Forecast - by Application
- 9. Middle East & Africa Data Center Lithium Ion UPS Battery Analysis, Insights and Forecast, 2019-2031
- 9.1. Market Analysis, Insights and Forecast - by Application
- 9.1.1. Large Data Center
- 9.1.2. Small and Medium Data Center
- 9.2. Market Analysis, Insights and Forecast - by Types
- 9.2.1. LiFePO4
- 9.2.2. Ternary Lithium
- 9.1. Market Analysis, Insights and Forecast - by Application
- 10. Asia Pacific Data Center Lithium Ion UPS Battery Analysis, Insights and Forecast, 2019-2031
- 10.1. Market Analysis, Insights and Forecast - by Application
- 10.1.1. Large Data Center
- 10.1.2. Small and Medium Data Center
- 10.2. Market Analysis, Insights and Forecast - by Types
- 10.2.1. LiFePO4
- 10.2.2. Ternary Lithium
- 10.1. Market Analysis, Insights and Forecast - by Application
- 11. Competitive Analysis
- 11.1. Global Market Share Analysis 2024
- 11.2. Company Profiles
- 11.2.1 Huawei
- 11.2.1.1. Overview
- 11.2.1.2. Products
- 11.2.1.3. SWOT Analysis
- 11.2.1.4. Recent Developments
- 11.2.1.5. Financials (Based on Availability)
- 11.2.2 Eaton
- 11.2.2.1. Overview
- 11.2.2.2. Products
- 11.2.2.3. SWOT Analysis
- 11.2.2.4. Recent Developments
- 11.2.2.5. Financials (Based on Availability)
- 11.2.3 Schneider Electric
- 11.2.3.1. Overview
- 11.2.3.2. Products
- 11.2.3.3. SWOT Analysis
- 11.2.3.4. Recent Developments
- 11.2.3.5. Financials (Based on Availability)
- 11.2.4 Mitsubishi Electric Power Products Inc
- 11.2.4.1. Overview
- 11.2.4.2. Products
- 11.2.4.3. SWOT Analysis
- 11.2.4.4. Recent Developments
- 11.2.4.5. Financials (Based on Availability)
- 11.2.5 ABB
- 11.2.5.1. Overview
- 11.2.5.2. Products
- 11.2.5.3. SWOT Analysis
- 11.2.5.4. Recent Developments
- 11.2.5.5. Financials (Based on Availability)
- 11.2.6 Narada
- 11.2.6.1. Overview
- 11.2.6.2. Products
- 11.2.6.3. SWOT Analysis
- 11.2.6.4. Recent Developments
- 11.2.6.5. Financials (Based on Availability)
- 11.2.1 Huawei
List of Figures
- Figure 1: Global Data Center Lithium Ion UPS Battery Revenue Breakdown (million, %) by Region 2024 & 2032
- Figure 2: Global Data Center Lithium Ion UPS Battery Volume Breakdown (K, %) by Region 2024 & 2032
- Figure 3: North America Data Center Lithium Ion UPS Battery Revenue (million), by Application 2024 & 2032
- Figure 4: North America Data Center Lithium Ion UPS Battery Volume (K), by Application 2024 & 2032
- Figure 5: North America Data Center Lithium Ion UPS Battery Revenue Share (%), by Application 2024 & 2032
- Figure 6: North America Data Center Lithium Ion UPS Battery Volume Share (%), by Application 2024 & 2032
- Figure 7: North America Data Center Lithium Ion UPS Battery Revenue (million), by Types 2024 & 2032
- Figure 8: North America Data Center Lithium Ion UPS Battery Volume (K), by Types 2024 & 2032
- Figure 9: North America Data Center Lithium Ion UPS Battery Revenue Share (%), by Types 2024 & 2032
- Figure 10: North America Data Center Lithium Ion UPS Battery Volume Share (%), by Types 2024 & 2032
- Figure 11: North America Data Center Lithium Ion UPS Battery Revenue (million), by Country 2024 & 2032
- Figure 12: North America Data Center Lithium Ion UPS Battery Volume (K), by Country 2024 & 2032
- Figure 13: North America Data Center Lithium Ion UPS Battery Revenue Share (%), by Country 2024 & 2032
- Figure 14: North America Data Center Lithium Ion UPS Battery Volume Share (%), by Country 2024 & 2032
- Figure 15: South America Data Center Lithium Ion UPS Battery Revenue (million), by Application 2024 & 2032
- Figure 16: South America Data Center Lithium Ion UPS Battery Volume (K), by Application 2024 & 2032
- Figure 17: South America Data Center Lithium Ion UPS Battery Revenue Share (%), by Application 2024 & 2032
- Figure 18: South America Data Center Lithium Ion UPS Battery Volume Share (%), by Application 2024 & 2032
- Figure 19: South America Data Center Lithium Ion UPS Battery Revenue (million), by Types 2024 & 2032
- Figure 20: South America Data Center Lithium Ion UPS Battery Volume (K), by Types 2024 & 2032
- Figure 21: South America Data Center Lithium Ion UPS Battery Revenue Share (%), by Types 2024 & 2032
- Figure 22: South America Data Center Lithium Ion UPS Battery Volume Share (%), by Types 2024 & 2032
- Figure 23: South America Data Center Lithium Ion UPS Battery Revenue (million), by Country 2024 & 2032
- Figure 24: South America Data Center Lithium Ion UPS Battery Volume (K), by Country 2024 & 2032
- Figure 25: South America Data Center Lithium Ion UPS Battery Revenue Share (%), by Country 2024 & 2032
- Figure 26: South America Data Center Lithium Ion UPS Battery Volume Share (%), by Country 2024 & 2032
- Figure 27: Europe Data Center Lithium Ion UPS Battery Revenue (million), by Application 2024 & 2032
- Figure 28: Europe Data Center Lithium Ion UPS Battery Volume (K), by Application 2024 & 2032
- Figure 29: Europe Data Center Lithium Ion UPS Battery Revenue Share (%), by Application 2024 & 2032
- Figure 30: Europe Data Center Lithium Ion UPS Battery Volume Share (%), by Application 2024 & 2032
- Figure 31: Europe Data Center Lithium Ion UPS Battery Revenue (million), by Types 2024 & 2032
- Figure 32: Europe Data Center Lithium Ion UPS Battery Volume (K), by Types 2024 & 2032
- Figure 33: Europe Data Center Lithium Ion UPS Battery Revenue Share (%), by Types 2024 & 2032
- Figure 34: Europe Data Center Lithium Ion UPS Battery Volume Share (%), by Types 2024 & 2032
- Figure 35: Europe Data Center Lithium Ion UPS Battery Revenue (million), by Country 2024 & 2032
- Figure 36: Europe Data Center Lithium Ion UPS Battery Volume (K), by Country 2024 & 2032
- Figure 37: Europe Data Center Lithium Ion UPS Battery Revenue Share (%), by Country 2024 & 2032
- Figure 38: Europe Data Center Lithium Ion UPS Battery Volume Share (%), by Country 2024 & 2032
- Figure 39: Middle East & Africa Data Center Lithium Ion UPS Battery Revenue (million), by Application 2024 & 2032
- Figure 40: Middle East & Africa Data Center Lithium Ion UPS Battery Volume (K), by Application 2024 & 2032
- Figure 41: Middle East & Africa Data Center Lithium Ion UPS Battery Revenue Share (%), by Application 2024 & 2032
- Figure 42: Middle East & Africa Data Center Lithium Ion UPS Battery Volume Share (%), by Application 2024 & 2032
- Figure 43: Middle East & Africa Data Center Lithium Ion UPS Battery Revenue (million), by Types 2024 & 2032
- Figure 44: Middle East & Africa Data Center Lithium Ion UPS Battery Volume (K), by Types 2024 & 2032
- Figure 45: Middle East & Africa Data Center Lithium Ion UPS Battery Revenue Share (%), by Types 2024 & 2032
- Figure 46: Middle East & Africa Data Center Lithium Ion UPS Battery Volume Share (%), by Types 2024 & 2032
- Figure 47: Middle East & Africa Data Center Lithium Ion UPS Battery Revenue (million), by Country 2024 & 2032
- Figure 48: Middle East & Africa Data Center Lithium Ion UPS Battery Volume (K), by Country 2024 & 2032
- Figure 49: Middle East & Africa Data Center Lithium Ion UPS Battery Revenue Share (%), by Country 2024 & 2032
- Figure 50: Middle East & Africa Data Center Lithium Ion UPS Battery Volume Share (%), by Country 2024 & 2032
- Figure 51: Asia Pacific Data Center Lithium Ion UPS Battery Revenue (million), by Application 2024 & 2032
- Figure 52: Asia Pacific Data Center Lithium Ion UPS Battery Volume (K), by Application 2024 & 2032
- Figure 53: Asia Pacific Data Center Lithium Ion UPS Battery Revenue Share (%), by Application 2024 & 2032
- Figure 54: Asia Pacific Data Center Lithium Ion UPS Battery Volume Share (%), by Application 2024 & 2032
- Figure 55: Asia Pacific Data Center Lithium Ion UPS Battery Revenue (million), by Types 2024 & 2032
- Figure 56: Asia Pacific Data Center Lithium Ion UPS Battery Volume (K), by Types 2024 & 2032
- Figure 57: Asia Pacific Data Center Lithium Ion UPS Battery Revenue Share (%), by Types 2024 & 2032
- Figure 58: Asia Pacific Data Center Lithium Ion UPS Battery Volume Share (%), by Types 2024 & 2032
- Figure 59: Asia Pacific Data Center Lithium Ion UPS Battery Revenue (million), by Country 2024 & 2032
- Figure 60: Asia Pacific Data Center Lithium Ion UPS Battery Volume (K), by Country 2024 & 2032
- Figure 61: Asia Pacific Data Center Lithium Ion UPS Battery Revenue Share (%), by Country 2024 & 2032
- Figure 62: Asia Pacific Data Center Lithium Ion UPS Battery Volume Share (%), by Country 2024 & 2032
List of Tables
- Table 1: Global Data Center Lithium Ion UPS Battery Revenue million Forecast, by Region 2019 & 2032
- Table 2: Global Data Center Lithium Ion UPS Battery Volume K Forecast, by Region 2019 & 2032
- Table 3: Global Data Center Lithium Ion UPS Battery Revenue million Forecast, by Application 2019 & 2032
- Table 4: Global Data Center Lithium Ion UPS Battery Volume K Forecast, by Application 2019 & 2032
- Table 5: Global Data Center Lithium Ion UPS Battery Revenue million Forecast, by Types 2019 & 2032
- Table 6: Global Data Center Lithium Ion UPS Battery Volume K Forecast, by Types 2019 & 2032
- Table 7: Global Data Center Lithium Ion UPS Battery Revenue million Forecast, by Region 2019 & 2032
- Table 8: Global Data Center Lithium Ion UPS Battery Volume K Forecast, by Region 2019 & 2032
- Table 9: Global Data Center Lithium Ion UPS Battery Revenue million Forecast, by Application 2019 & 2032
- Table 10: Global Data Center Lithium Ion UPS Battery Volume K Forecast, by Application 2019 & 2032
- Table 11: Global Data Center Lithium Ion UPS Battery Revenue million Forecast, by Types 2019 & 2032
- Table 12: Global Data Center Lithium Ion UPS Battery Volume K Forecast, by Types 2019 & 2032
- Table 13: Global Data Center Lithium Ion UPS Battery Revenue million Forecast, by Country 2019 & 2032
- Table 14: Global Data Center Lithium Ion UPS Battery Volume K Forecast, by Country 2019 & 2032
- Table 15: United States Data Center Lithium Ion UPS Battery Revenue (million) Forecast, by Application 2019 & 2032
- Table 16: United States Data Center Lithium Ion UPS Battery Volume (K) Forecast, by Application 2019 & 2032
- Table 17: Canada Data Center Lithium Ion UPS Battery Revenue (million) Forecast, by Application 2019 & 2032
- Table 18: Canada Data Center Lithium Ion UPS Battery Volume (K) Forecast, by Application 2019 & 2032
- Table 19: Mexico Data Center Lithium Ion UPS Battery Revenue (million) Forecast, by Application 2019 & 2032
- Table 20: Mexico Data Center Lithium Ion UPS Battery Volume (K) Forecast, by Application 2019 & 2032
- Table 21: Global Data Center Lithium Ion UPS Battery Revenue million Forecast, by Application 2019 & 2032
- Table 22: Global Data Center Lithium Ion UPS Battery Volume K Forecast, by Application 2019 & 2032
- Table 23: Global Data Center Lithium Ion UPS Battery Revenue million Forecast, by Types 2019 & 2032
- Table 24: Global Data Center Lithium Ion UPS Battery Volume K Forecast, by Types 2019 & 2032
- Table 25: Global Data Center Lithium Ion UPS Battery Revenue million Forecast, by Country 2019 & 2032
- Table 26: Global Data Center Lithium Ion UPS Battery Volume K Forecast, by Country 2019 & 2032
- Table 27: Brazil Data Center Lithium Ion UPS Battery Revenue (million) Forecast, by Application 2019 & 2032
- Table 28: Brazil Data Center Lithium Ion UPS Battery Volume (K) Forecast, by Application 2019 & 2032
- Table 29: Argentina Data Center Lithium Ion UPS Battery Revenue (million) Forecast, by Application 2019 & 2032
- Table 30: Argentina Data Center Lithium Ion UPS Battery Volume (K) Forecast, by Application 2019 & 2032
- Table 31: Rest of South America Data Center Lithium Ion UPS Battery Revenue (million) Forecast, by Application 2019 & 2032
- Table 32: Rest of South America Data Center Lithium Ion UPS Battery Volume (K) Forecast, by Application 2019 & 2032
- Table 33: Global Data Center Lithium Ion UPS Battery Revenue million Forecast, by Application 2019 & 2032
- Table 34: Global Data Center Lithium Ion UPS Battery Volume K Forecast, by Application 2019 & 2032
- Table 35: Global Data Center Lithium Ion UPS Battery Revenue million Forecast, by Types 2019 & 2032
- Table 36: Global Data Center Lithium Ion UPS Battery Volume K Forecast, by Types 2019 & 2032
- Table 37: Global Data Center Lithium Ion UPS Battery Revenue million Forecast, by Country 2019 & 2032
- Table 38: Global Data Center Lithium Ion UPS Battery Volume K Forecast, by Country 2019 & 2032
- Table 39: United Kingdom Data Center Lithium Ion UPS Battery Revenue (million) Forecast, by Application 2019 & 2032
- Table 40: United Kingdom Data Center Lithium Ion UPS Battery Volume (K) Forecast, by Application 2019 & 2032
- Table 41: Germany Data Center Lithium Ion UPS Battery Revenue (million) Forecast, by Application 2019 & 2032
- Table 42: Germany Data Center Lithium Ion UPS Battery Volume (K) Forecast, by Application 2019 & 2032
- Table 43: France Data Center Lithium Ion UPS Battery Revenue (million) Forecast, by Application 2019 & 2032
- Table 44: France Data Center Lithium Ion UPS Battery Volume (K) Forecast, by Application 2019 & 2032
- Table 45: Italy Data Center Lithium Ion UPS Battery Revenue (million) Forecast, by Application 2019 & 2032
- Table 46: Italy Data Center Lithium Ion UPS Battery Volume (K) Forecast, by Application 2019 & 2032
- Table 47: Spain Data Center Lithium Ion UPS Battery Revenue (million) Forecast, by Application 2019 & 2032
- Table 48: Spain Data Center Lithium Ion UPS Battery Volume (K) Forecast, by Application 2019 & 2032
- Table 49: Russia Data Center Lithium Ion UPS Battery Revenue (million) Forecast, by Application 2019 & 2032
- Table 50: Russia Data Center Lithium Ion UPS Battery Volume (K) Forecast, by Application 2019 & 2032
- Table 51: Benelux Data Center Lithium Ion UPS Battery Revenue (million) Forecast, by Application 2019 & 2032
- Table 52: Benelux Data Center Lithium Ion UPS Battery Volume (K) Forecast, by Application 2019 & 2032
- Table 53: Nordics Data Center Lithium Ion UPS Battery Revenue (million) Forecast, by Application 2019 & 2032
- Table 54: Nordics Data Center Lithium Ion UPS Battery Volume (K) Forecast, by Application 2019 & 2032
- Table 55: Rest of Europe Data Center Lithium Ion UPS Battery Revenue (million) Forecast, by Application 2019 & 2032
- Table 56: Rest of Europe Data Center Lithium Ion UPS Battery Volume (K) Forecast, by Application 2019 & 2032
- Table 57: Global Data Center Lithium Ion UPS Battery Revenue million Forecast, by Application 2019 & 2032
- Table 58: Global Data Center Lithium Ion UPS Battery Volume K Forecast, by Application 2019 & 2032
- Table 59: Global Data Center Lithium Ion UPS Battery Revenue million Forecast, by Types 2019 & 2032
- Table 60: Global Data Center Lithium Ion UPS Battery Volume K Forecast, by Types 2019 & 2032
- Table 61: Global Data Center Lithium Ion UPS Battery Revenue million Forecast, by Country 2019 & 2032
- Table 62: Global Data Center Lithium Ion UPS Battery Volume K Forecast, by Country 2019 & 2032
- Table 63: Turkey Data Center Lithium Ion UPS Battery Revenue (million) Forecast, by Application 2019 & 2032
- Table 64: Turkey Data Center Lithium Ion UPS Battery Volume (K) Forecast, by Application 2019 & 2032
- Table 65: Israel Data Center Lithium Ion UPS Battery Revenue (million) Forecast, by Application 2019 & 2032
- Table 66: Israel Data Center Lithium Ion UPS Battery Volume (K) Forecast, by Application 2019 & 2032
- Table 67: GCC Data Center Lithium Ion UPS Battery Revenue (million) Forecast, by Application 2019 & 2032
- Table 68: GCC Data Center Lithium Ion UPS Battery Volume (K) Forecast, by Application 2019 & 2032
- Table 69: North Africa Data Center Lithium Ion UPS Battery Revenue (million) Forecast, by Application 2019 & 2032
- Table 70: North Africa Data Center Lithium Ion UPS Battery Volume (K) Forecast, by Application 2019 & 2032
- Table 71: South Africa Data Center Lithium Ion UPS Battery Revenue (million) Forecast, by Application 2019 & 2032
- Table 72: South Africa Data Center Lithium Ion UPS Battery Volume (K) Forecast, by Application 2019 & 2032
- Table 73: Rest of Middle East & Africa Data Center Lithium Ion UPS Battery Revenue (million) Forecast, by Application 2019 & 2032
- Table 74: Rest of Middle East & Africa Data Center Lithium Ion UPS Battery Volume (K) Forecast, by Application 2019 & 2032
- Table 75: Global Data Center Lithium Ion UPS Battery Revenue million Forecast, by Application 2019 & 2032
- Table 76: Global Data Center Lithium Ion UPS Battery Volume K Forecast, by Application 2019 & 2032
- Table 77: Global Data Center Lithium Ion UPS Battery Revenue million Forecast, by Types 2019 & 2032
- Table 78: Global Data Center Lithium Ion UPS Battery Volume K Forecast, by Types 2019 & 2032
- Table 79: Global Data Center Lithium Ion UPS Battery Revenue million Forecast, by Country 2019 & 2032
- Table 80: Global Data Center Lithium Ion UPS Battery Volume K Forecast, by Country 2019 & 2032
- Table 81: China Data Center Lithium Ion UPS Battery Revenue (million) Forecast, by Application 2019 & 2032
- Table 82: China Data Center Lithium Ion UPS Battery Volume (K) Forecast, by Application 2019 & 2032
- Table 83: India Data Center Lithium Ion UPS Battery Revenue (million) Forecast, by Application 2019 & 2032
- Table 84: India Data Center Lithium Ion UPS Battery Volume (K) Forecast, by Application 2019 & 2032
- Table 85: Japan Data Center Lithium Ion UPS Battery Revenue (million) Forecast, by Application 2019 & 2032
- Table 86: Japan Data Center Lithium Ion UPS Battery Volume (K) Forecast, by Application 2019 & 2032
- Table 87: South Korea Data Center Lithium Ion UPS Battery Revenue (million) Forecast, by Application 2019 & 2032
- Table 88: South Korea Data Center Lithium Ion UPS Battery Volume (K) Forecast, by Application 2019 & 2032
- Table 89: ASEAN Data Center Lithium Ion UPS Battery Revenue (million) Forecast, by Application 2019 & 2032
- Table 90: ASEAN Data Center Lithium Ion UPS Battery Volume (K) Forecast, by Application 2019 & 2032
- Table 91: Oceania Data Center Lithium Ion UPS Battery Revenue (million) Forecast, by Application 2019 & 2032
- Table 92: Oceania Data Center Lithium Ion UPS Battery Volume (K) Forecast, by Application 2019 & 2032
- Table 93: Rest of Asia Pacific Data Center Lithium Ion UPS Battery Revenue (million) Forecast, by Application 2019 & 2032
- Table 94: Rest of Asia Pacific Data Center Lithium Ion UPS Battery Volume (K) Forecast, by Application 2019 & 2032
Frequently Asked Questions
1. What is the projected Compound Annual Growth Rate (CAGR) of the Data Center Lithium Ion UPS Battery?
The projected CAGR is approximately XX%.
2. Which companies are prominent players in the Data Center Lithium Ion UPS Battery?
Key companies in the market include Huawei, Eaton, Schneider Electric, Mitsubishi Electric Power Products Inc, ABB, Narada.
3. What are the main segments of the Data Center Lithium Ion UPS Battery?
The market segments include Application, Types.
4. Can you provide details about the market size?
The market size is estimated to be USD XXX million as of 2022.
5. What are some drivers contributing to market growth?
N/A
6. What are the notable trends driving market growth?
N/A
7. Are there any restraints impacting market growth?
N/A
8. Can you provide examples of recent developments in the market?
N/A
9. What pricing options are available for accessing the report?
Pricing options include single-user, multi-user, and enterprise licenses priced at USD 3350.00, USD 5025.00, and USD 6700.00 respectively.
10. Is the market size provided in terms of value or volume?
The market size is provided in terms of value, measured in million and volume, measured in K.
11. Are there any specific market keywords associated with the report?
Yes, the market keyword associated with the report is "Data Center Lithium Ion UPS Battery," which aids in identifying and referencing the specific market segment covered.
12. How do I determine which pricing option suits my needs best?
The pricing options vary based on user requirements and access needs. Individual users may opt for single-user licenses, while businesses requiring broader access may choose multi-user or enterprise licenses for cost-effective access to the report.
13. Are there any additional resources or data provided in the Data Center Lithium Ion UPS Battery report?
While the report offers comprehensive insights, it's advisable to review the specific contents or supplementary materials provided to ascertain if additional resources or data are available.
14. How can I stay updated on further developments or reports in the Data Center Lithium Ion UPS Battery?
To stay informed about further developments, trends, and reports in the Data Center Lithium Ion UPS Battery, consider subscribing to industry newsletters, following relevant companies and organizations, or regularly checking reputable industry news sources and publications.
Methodology
Step 1 - Identification of Relevant Samples Size from Population Database


Step 2 - Approaches for Defining Global Market Size (Value, Volume* & Price*)

Note*: In applicable scenarios
Step 3 - Data Sources
Primary Research
- Web Analytics
- Survey Reports
- Research Institute
- Latest Research Reports
- Opinion Leaders
Secondary Research
- Annual Reports
- White Paper
- Latest Press Release
- Industry Association
- Paid Database
- Investor Presentations

Step 4 - Data Triangulation
Involves using different sources of information in order to increase the validity of a study
These sources are likely to be stakeholders in a program - participants, other researchers, program staff, other community members, and so on.
Then we put all data in single framework & apply various statistical tools to find out the dynamic on the market.
During the analysis stage, feedback from the stakeholder groups would be compared to determine areas of agreement as well as areas of divergence


