

Key Insights
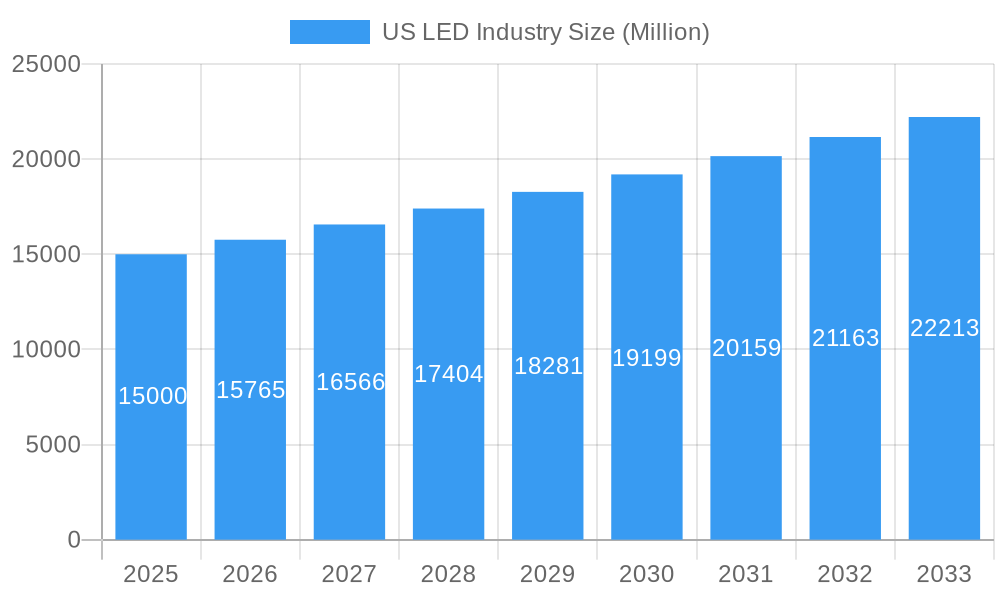
The US LED lighting market, projected at $19.22 billion in 2025, is set for significant expansion with a compound annual growth rate (CAGR) of 5.06% between 2025 and 2033. This growth is propelled by escalating government mandates for energy efficiency and heightened awareness of energy savings and environmental sustainability among consumers and businesses. Continuous technological innovation, delivering enhanced efficacy, extended product lifespans, and superior light quality, further stimulates market development. The market's broad appeal is reinforced by diverse application segments, including residential, commercial, industrial, automotive, and outdoor lighting. The automotive sector, particularly with advancements in advanced driver-assistance systems (ADAS) and electric vehicles, presents a dynamic growth frontier, increasing demand for specialized LED solutions. Despite challenges from rising raw material costs and robust competition, the US LED lighting market demonstrates a positive long-term outlook, driven by ongoing innovation and expanding applications.
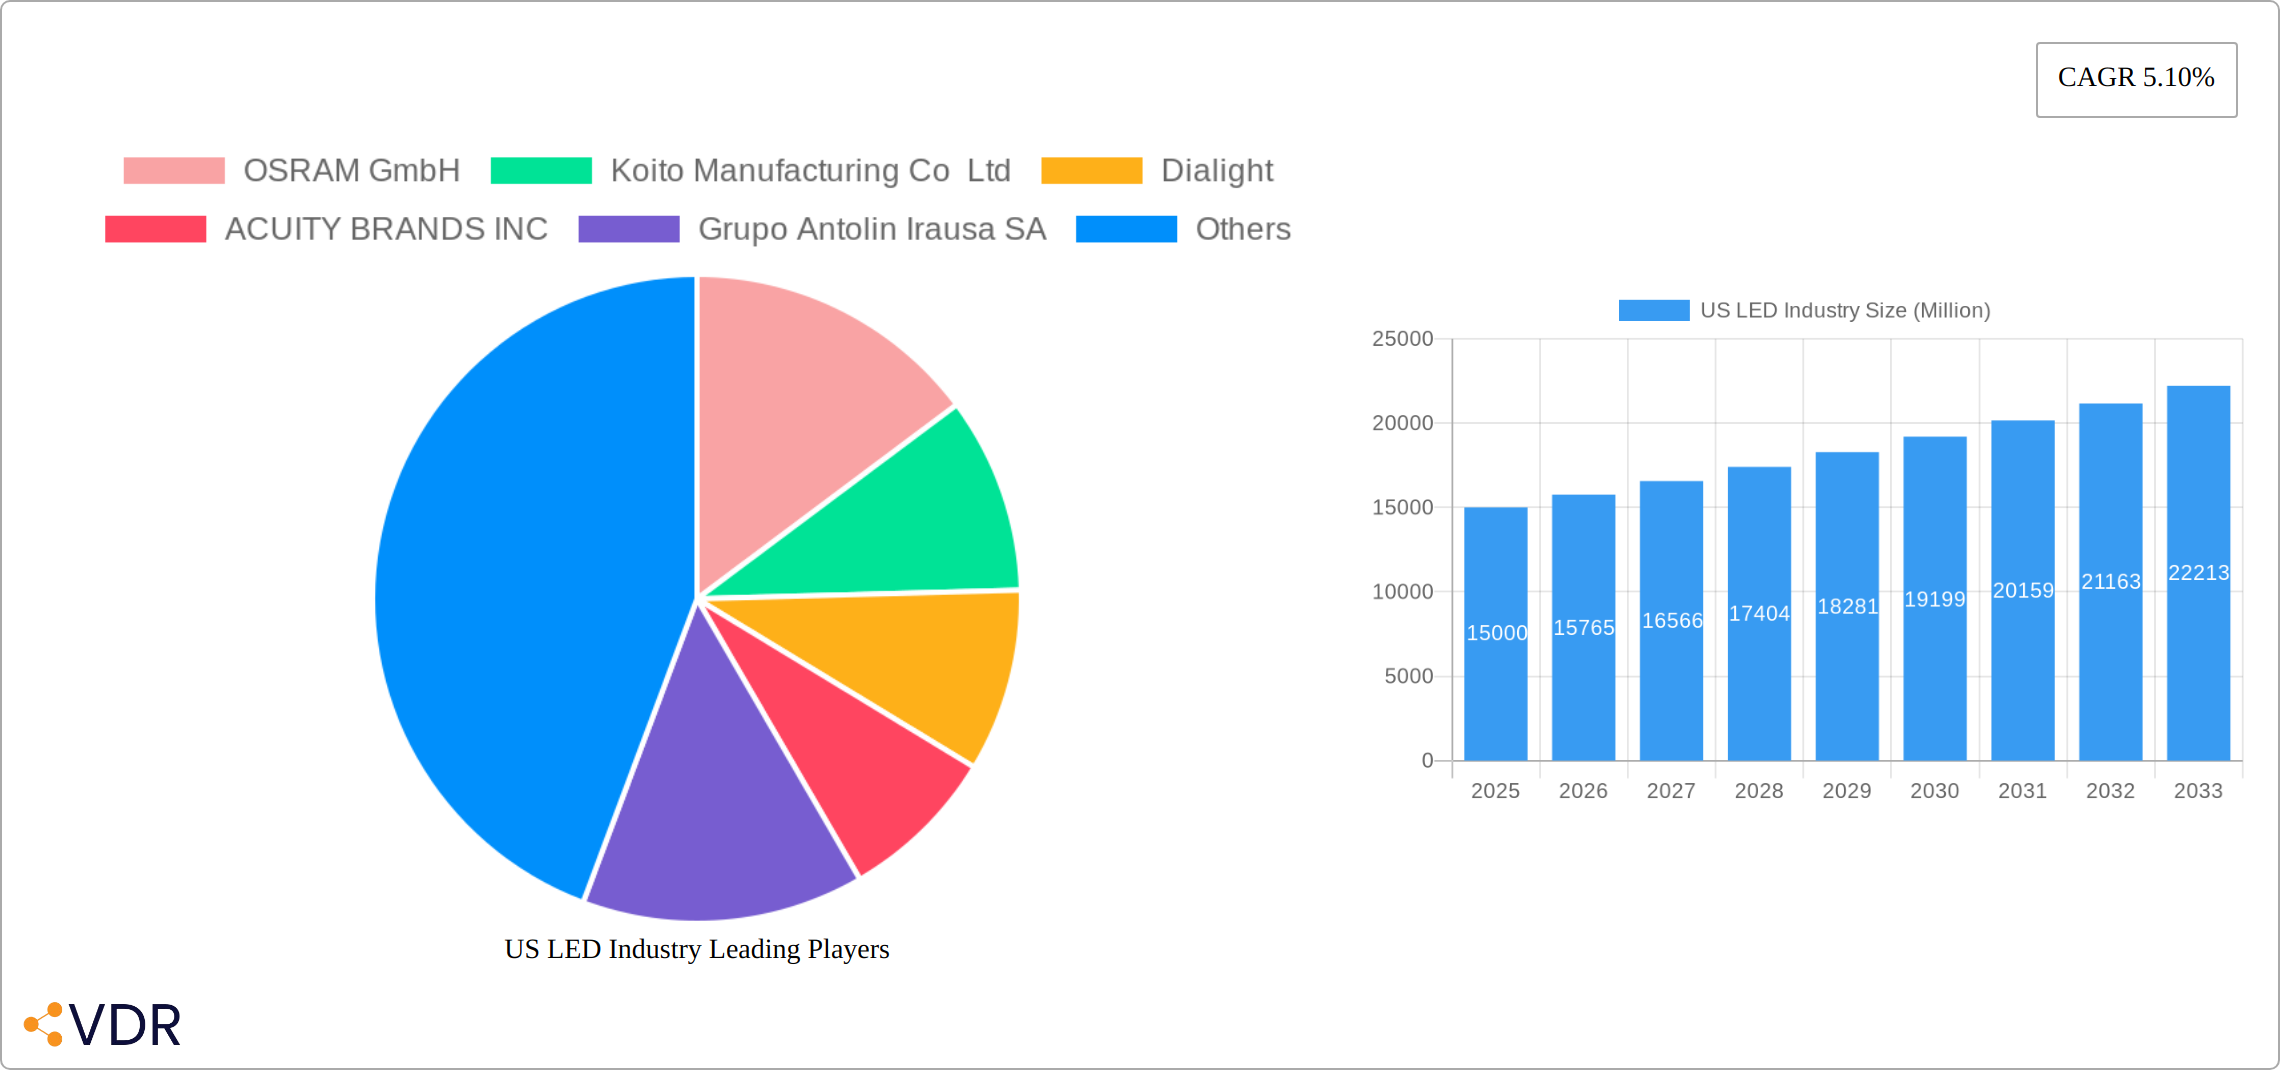
US LED Industry Market Size (In Billion)
Market segmentation highlights robust performance across key sectors. Industrial and warehouse lighting benefits from the demand for energy-efficient and durable solutions in large-scale operations. Residential adoption is consistent, supported by renovation and new construction projects. The outdoor lighting segment is expanding, fueled by smart city initiatives and public infrastructure upgrades. Within automotive lighting, demand for advanced features such as daytime running lights, adaptive headlights, and sophisticated signaling systems is a primary growth driver. Leading companies including Signify (Philips), Osram, and Koito Manufacturing are pioneering innovation, consistently introducing new products to meet evolving market needs. The increasing integration of smart lighting technologies and the Internet of Things (IoT) will further shape the industry's future, creating growth opportunities in connected lighting systems and data analytics.
US LED Industry Company Market Share
US LED Industry Market Report: 2019-2033
This comprehensive report provides an in-depth analysis of the US LED industry, covering market dynamics, growth trends, key players, and future outlook. The study period spans from 2019 to 2033, with 2025 as the base year and forecast period extending to 2033. The report leverages extensive data analysis to provide valuable insights for industry professionals, investors, and stakeholders. The market is segmented by product type (Industrial & Warehouse, Residential, Outdoor, Automotive Utility, Automotive Vehicle, Indoor) and further analyzed across key application areas. Expected market value in Million Units.
US LED Industry Market Dynamics & Structure
The US LED market is characterized by a moderately concentrated landscape with several major players and numerous smaller niche players. Technological innovation, particularly in energy efficiency and smart lighting solutions, is a key driver. Stringent government regulations promoting energy conservation and the increasing adoption of sustainable technologies further fuel market growth. The market faces competition from traditional lighting technologies, but the superior energy efficiency and longer lifespan of LEDs are significant advantages. End-user demographics show a strong demand from commercial and industrial sectors, with residential adoption rates steadily increasing. Recent years have witnessed several mergers and acquisitions (M&A) activities, with larger companies acquiring smaller firms to enhance their product portfolios and market share.
- Market Concentration: Moderately concentrated, with top 10 players holding approximately xx% market share in 2024.
- Technological Innovation: Focus on high-lumen output, improved color rendering index (CRI), smart lighting integration, and miniaturization.
- Regulatory Framework: Energy efficiency standards (e.g., California Title 24) and incentives for LED adoption.
- Competitive Product Substitutes: Traditional lighting technologies (incandescent, fluorescent) and other energy-efficient alternatives.
- End-User Demographics: Strong demand from commercial, industrial, and public sectors; growing residential adoption.
- M&A Trends: xx M&A deals recorded between 2019 and 2024, primarily driven by consolidation and expansion strategies. xx% increase in M&A activity compared to the previous five years.
US LED Industry Growth Trends & Insights
The US LED industry has experienced significant growth over the past years, driven by factors such as increasing energy efficiency mandates, the rising preference for energy-saving lighting solutions, and technological advancements. The market size, which was valued at xx million units in 2019, is projected to reach xx million units by 2033, registering a CAGR of xx% during the forecast period. Adoption rates have been particularly high in commercial and industrial sectors, where energy cost savings are most pronounced. Technological disruptions, such as the introduction of smart lighting systems and Internet of Things (IoT) enabled LEDs, are further accelerating market expansion. Shifts in consumer behavior, with growing environmental awareness and preferences for sustainable products, also contribute to market growth.
Dominant Regions, Countries, or Segments in US LED Industry
The U.S. LED market is experiencing robust growth, with California and the East Coast emerging as key contributors. California's high concentration of commercial and industrial facilities, coupled with stringent energy efficiency regulations, fuels significant demand. Simultaneously, the East Coast's focus on infrastructure development and technological adoption further bolsters market expansion. Within the product segments, Industrial & Warehouse lighting demonstrates the highest growth trajectory, driven by widespread adoption in large-scale facilities. The Automotive Utility Lighting segment also exhibits substantial expansion, fueled by the increasing need for enhanced safety and performance features in vehicles. Beyond these leading segments, significant untapped potential exists in residential, outdoor, and agricultural lighting applications, particularly in rural and suburban areas.
- Key Drivers:
- Stringent energy efficiency standards and substantial government incentives.
- Large-scale infrastructure development projects, particularly in urban centers and smart city initiatives.
- Heightened consumer awareness of energy-saving benefits and the importance of environmental sustainability.
- Rapidly increasing adoption of smart lighting solutions and integration with IoT platforms.
- Falling manufacturing costs leading to increased price competitiveness.
- Dominance Factors: High concentration of commercial & industrial facilities, particularly in California and the East Coast; stringent environmental regulations; and robust infrastructure development initiatives.
- Growth Potential: Substantial growth potential exists in Residential, Outdoor, Agricultural, and Automotive sectors, with significant untapped markets in rural and suburban areas, and emerging opportunities in smart city applications.
US LED Industry Product Landscape
The US LED product landscape is marked by continuous innovation, with new products featuring enhanced brightness, improved energy efficiency, and extended lifespans. The integration of smart technologies and IoT capabilities is increasingly prevalent, offering features such as remote control, automated dimming, and data analytics for energy management. Products are tailored for specific applications, with specialized designs for indoor, outdoor, automotive, and industrial settings. Unique selling propositions (USPs) often center on improved light quality (CRI), energy savings, smart features, and extended warranty periods.
Key Drivers, Barriers & Challenges in US LED Industry
Key Drivers: The U.S. LED industry is propelled by several key factors: increasingly stringent energy efficiency mandates at both the federal and state levels, a growing national environmental consciousness, continuous technological advancements leading to improved efficiency and longer lifespans, and supportive government incentives. Furthermore, significant cost reductions in LED manufacturing have made this technology increasingly price-competitive with traditional lighting solutions.
Challenges and Restraints: Despite its strong growth potential, the industry faces several challenges. Competition from established lighting technologies remains a significant factor, as does the potential for supply chain disruptions impacting the availability of raw materials and components. Meeting stringent regulatory compliance requirements can also add to manufacturing costs. The high initial capital investment required for LED implementation can act as a barrier for certain consumers, while fluctuating raw material prices and the complexities of managing LED waste disposal present ongoing concerns. Furthermore, skilled labor shortages in installation and maintenance can hinder widespread adoption.
Emerging Opportunities in US LED Industry
The U.S. LED industry presents numerous exciting emerging opportunities. The expansion of smart lighting applications in both residential and commercial spaces is a key driver of growth, further amplified by the integration of the Internet of Things (IoT) in lighting control and management systems. There is also a significant and rapidly growing demand for energy-efficient LED solutions in emerging markets such as agricultural lighting (e.g., vertical farming and greenhouses), horticulture, and smart city initiatives. The integration of LED lighting into sustainable infrastructure projects offers another substantial avenue for expansion.
Growth Accelerators in the US LED Industry Industry
Technological breakthroughs in LED technology, particularly in improving efficiency and extending lifespans, are accelerating market growth. Strategic partnerships between LED manufacturers and smart home technology providers are expanding product offerings and applications. Government initiatives promoting energy efficiency and the adoption of sustainable technologies are also creating favorable market conditions. Market expansion into new sectors, such as agricultural lighting and smart city initiatives, creates significant growth opportunities.
Key Players Shaping the US LED Industry Market
- OSRAM GmbH
- Koito Manufacturing Co Ltd
- Dialight
- ACUITY BRANDS INC
- Grupo Antolin Irausa SA
- NVC INTERNATIONAL HOLDINGS LIMITED
- Current Lighting Solutions LLC
- Marelli Holdings Co Ltd
- Signify (Philips)
- Stanley Electric Co Ltd
Notable Milestones in US LED Industry Sector
- May 2023: Cyclone Lighting launches the Elencia luminaire, a high-performance outdoor post-top light.
- May 2023: Dialight introduces the ProSite High Mast, a high-lumen outdoor industrial LED floodlight.
- April 2023: Hydrel adds the M9700 RGBW fixture to its M9000 ingrade luminaire family.
In-Depth US LED Industry Market Outlook
The US LED industry is poised for continued strong growth over the next decade, driven by technological advancements, supportive government policies, and expanding applications across diverse sectors. Strategic investments in R&D, focusing on energy efficiency, smart lighting capabilities, and cost reductions, will be crucial for sustained competitiveness. Companies leveraging smart partnerships and expanding their product portfolios to cater to emerging markets and applications will be well-positioned to capture significant market share. The increasing demand for sustainable and energy-efficient solutions will continue to propel this market's growth.
US LED Industry Segmentation
-
1. Indoor Lighting
- 1.1. Agricultural Lighting
-
1.2. Commercial
- 1.2.1. Office
- 1.2.2. Retail
- 1.2.3. Others
- 1.3. Industrial and Warehouse
- 1.4. Residential
-
2. Outdoor Lighting
- 2.1. Public Places
- 2.2. Streets and Roadways
- 2.3. Others
-
3. Automotive Utility Lighting
- 3.1. Daytime Running Lights (DRL)
- 3.2. Directional Signal Lights
- 3.3. Headlights
- 3.4. Reverse Light
- 3.5. Stop Light
- 3.6. Tail Light
- 3.7. Others
-
4. Automotive Vehicle Lighting
- 4.1. 2 Wheelers
- 4.2. Commercial Vehicles
- 4.3. Passenger Cars
US LED Industry Segmentation By Geography
-
1. North America
- 1.1. United States
- 1.2. Canada
- 1.3. Mexico
-
2. South America
- 2.1. Brazil
- 2.2. Argentina
- 2.3. Rest of South America
-
3. Europe
- 3.1. United Kingdom
- 3.2. Germany
- 3.3. France
- 3.4. Italy
- 3.5. Spain
- 3.6. Russia
- 3.7. Benelux
- 3.8. Nordics
- 3.9. Rest of Europe
-
4. Middle East & Africa
- 4.1. Turkey
- 4.2. Israel
- 4.3. GCC
- 4.4. North Africa
- 4.5. South Africa
- 4.6. Rest of Middle East & Africa
-
5. Asia Pacific
- 5.1. China
- 5.2. India
- 5.3. Japan
- 5.4. South Korea
- 5.5. ASEAN
- 5.6. Oceania
- 5.7. Rest of Asia Pacific
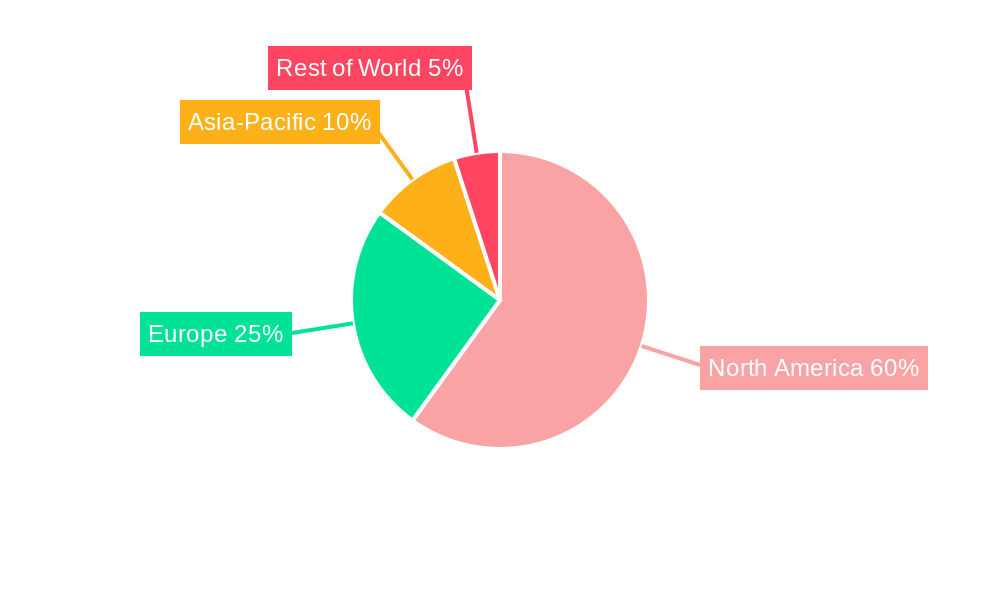
US LED Industry Regional Market Share
Geographic Coverage of US LED Industry
US LED Industry REPORT HIGHLIGHTS
| Aspects | Details |
|---|---|
| Study Period | 2020-2034 |
| Base Year | 2025 |
| Estimated Year | 2026 |
| Forecast Period | 2026-2034 |
| Historical Period | 2020-2025 |
| Growth Rate | CAGR of 5.06% from 2020-2034 |
| Segmentation |
|
Table of Contents
- 1. Introduction
- 1.1. Research Scope
- 1.2. Market Segmentation
- 1.3. Research Methodology
- 1.4. Definitions and Assumptions
- 2. Executive Summary
- 2.1. Introduction
- 3. Market Dynamics
- 3.1. Introduction
- 3.2. Market Drivers
- 3.2.1. Enhanced Precision and Accuracy over Conventional Alternatives; Miniaturization of Component Parts
- 3.3. Market Restrains
- 3.3.1. Regulation Compliance Associated with Laser Usage
- 3.4. Market Trends
- 3.4.1. OTHER KEY INDUSTRY TRENDS COVERED IN THE REPORT
- 4. Market Factor Analysis
- 4.1. Porters Five Forces
- 4.2. Supply/Value Chain
- 4.3. PESTEL analysis
- 4.4. Market Entropy
- 4.5. Patent/Trademark Analysis
- 5. Global US LED Industry Analysis, Insights and Forecast, 2020-2032
- 5.1. Market Analysis, Insights and Forecast - by Indoor Lighting
- 5.1.1. Agricultural Lighting
- 5.1.2. Commercial
- 5.1.2.1. Office
- 5.1.2.2. Retail
- 5.1.2.3. Others
- 5.1.3. Industrial and Warehouse
- 5.1.4. Residential
- 5.2. Market Analysis, Insights and Forecast - by Outdoor Lighting
- 5.2.1. Public Places
- 5.2.2. Streets and Roadways
- 5.2.3. Others
- 5.3. Market Analysis, Insights and Forecast - by Automotive Utility Lighting
- 5.3.1. Daytime Running Lights (DRL)
- 5.3.2. Directional Signal Lights
- 5.3.3. Headlights
- 5.3.4. Reverse Light
- 5.3.5. Stop Light
- 5.3.6. Tail Light
- 5.3.7. Others
- 5.4. Market Analysis, Insights and Forecast - by Automotive Vehicle Lighting
- 5.4.1. 2 Wheelers
- 5.4.2. Commercial Vehicles
- 5.4.3. Passenger Cars
- 5.5. Market Analysis, Insights and Forecast - by Region
- 5.5.1. North America
- 5.5.2. South America
- 5.5.3. Europe
- 5.5.4. Middle East & Africa
- 5.5.5. Asia Pacific
- 5.1. Market Analysis, Insights and Forecast - by Indoor Lighting
- 6. North America US LED Industry Analysis, Insights and Forecast, 2020-2032
- 6.1. Market Analysis, Insights and Forecast - by Indoor Lighting
- 6.1.1. Agricultural Lighting
- 6.1.2. Commercial
- 6.1.2.1. Office
- 6.1.2.2. Retail
- 6.1.2.3. Others
- 6.1.3. Industrial and Warehouse
- 6.1.4. Residential
- 6.2. Market Analysis, Insights and Forecast - by Outdoor Lighting
- 6.2.1. Public Places
- 6.2.2. Streets and Roadways
- 6.2.3. Others
- 6.3. Market Analysis, Insights and Forecast - by Automotive Utility Lighting
- 6.3.1. Daytime Running Lights (DRL)
- 6.3.2. Directional Signal Lights
- 6.3.3. Headlights
- 6.3.4. Reverse Light
- 6.3.5. Stop Light
- 6.3.6. Tail Light
- 6.3.7. Others
- 6.4. Market Analysis, Insights and Forecast - by Automotive Vehicle Lighting
- 6.4.1. 2 Wheelers
- 6.4.2. Commercial Vehicles
- 6.4.3. Passenger Cars
- 6.1. Market Analysis, Insights and Forecast - by Indoor Lighting
- 7. South America US LED Industry Analysis, Insights and Forecast, 2020-2032
- 7.1. Market Analysis, Insights and Forecast - by Indoor Lighting
- 7.1.1. Agricultural Lighting
- 7.1.2. Commercial
- 7.1.2.1. Office
- 7.1.2.2. Retail
- 7.1.2.3. Others
- 7.1.3. Industrial and Warehouse
- 7.1.4. Residential
- 7.2. Market Analysis, Insights and Forecast - by Outdoor Lighting
- 7.2.1. Public Places
- 7.2.2. Streets and Roadways
- 7.2.3. Others
- 7.3. Market Analysis, Insights and Forecast - by Automotive Utility Lighting
- 7.3.1. Daytime Running Lights (DRL)
- 7.3.2. Directional Signal Lights
- 7.3.3. Headlights
- 7.3.4. Reverse Light
- 7.3.5. Stop Light
- 7.3.6. Tail Light
- 7.3.7. Others
- 7.4. Market Analysis, Insights and Forecast - by Automotive Vehicle Lighting
- 7.4.1. 2 Wheelers
- 7.4.2. Commercial Vehicles
- 7.4.3. Passenger Cars
- 7.1. Market Analysis, Insights and Forecast - by Indoor Lighting
- 8. Europe US LED Industry Analysis, Insights and Forecast, 2020-2032
- 8.1. Market Analysis, Insights and Forecast - by Indoor Lighting
- 8.1.1. Agricultural Lighting
- 8.1.2. Commercial
- 8.1.2.1. Office
- 8.1.2.2. Retail
- 8.1.2.3. Others
- 8.1.3. Industrial and Warehouse
- 8.1.4. Residential
- 8.2. Market Analysis, Insights and Forecast - by Outdoor Lighting
- 8.2.1. Public Places
- 8.2.2. Streets and Roadways
- 8.2.3. Others
- 8.3. Market Analysis, Insights and Forecast - by Automotive Utility Lighting
- 8.3.1. Daytime Running Lights (DRL)
- 8.3.2. Directional Signal Lights
- 8.3.3. Headlights
- 8.3.4. Reverse Light
- 8.3.5. Stop Light
- 8.3.6. Tail Light
- 8.3.7. Others
- 8.4. Market Analysis, Insights and Forecast - by Automotive Vehicle Lighting
- 8.4.1. 2 Wheelers
- 8.4.2. Commercial Vehicles
- 8.4.3. Passenger Cars
- 8.1. Market Analysis, Insights and Forecast - by Indoor Lighting
- 9. Middle East & Africa US LED Industry Analysis, Insights and Forecast, 2020-2032
- 9.1. Market Analysis, Insights and Forecast - by Indoor Lighting
- 9.1.1. Agricultural Lighting
- 9.1.2. Commercial
- 9.1.2.1. Office
- 9.1.2.2. Retail
- 9.1.2.3. Others
- 9.1.3. Industrial and Warehouse
- 9.1.4. Residential
- 9.2. Market Analysis, Insights and Forecast - by Outdoor Lighting
- 9.2.1. Public Places
- 9.2.2. Streets and Roadways
- 9.2.3. Others
- 9.3. Market Analysis, Insights and Forecast - by Automotive Utility Lighting
- 9.3.1. Daytime Running Lights (DRL)
- 9.3.2. Directional Signal Lights
- 9.3.3. Headlights
- 9.3.4. Reverse Light
- 9.3.5. Stop Light
- 9.3.6. Tail Light
- 9.3.7. Others
- 9.4. Market Analysis, Insights and Forecast - by Automotive Vehicle Lighting
- 9.4.1. 2 Wheelers
- 9.4.2. Commercial Vehicles
- 9.4.3. Passenger Cars
- 9.1. Market Analysis, Insights and Forecast - by Indoor Lighting
- 10. Asia Pacific US LED Industry Analysis, Insights and Forecast, 2020-2032
- 10.1. Market Analysis, Insights and Forecast - by Indoor Lighting
- 10.1.1. Agricultural Lighting
- 10.1.2. Commercial
- 10.1.2.1. Office
- 10.1.2.2. Retail
- 10.1.2.3. Others
- 10.1.3. Industrial and Warehouse
- 10.1.4. Residential
- 10.2. Market Analysis, Insights and Forecast - by Outdoor Lighting
- 10.2.1. Public Places
- 10.2.2. Streets and Roadways
- 10.2.3. Others
- 10.3. Market Analysis, Insights and Forecast - by Automotive Utility Lighting
- 10.3.1. Daytime Running Lights (DRL)
- 10.3.2. Directional Signal Lights
- 10.3.3. Headlights
- 10.3.4. Reverse Light
- 10.3.5. Stop Light
- 10.3.6. Tail Light
- 10.3.7. Others
- 10.4. Market Analysis, Insights and Forecast - by Automotive Vehicle Lighting
- 10.4.1. 2 Wheelers
- 10.4.2. Commercial Vehicles
- 10.4.3. Passenger Cars
- 10.1. Market Analysis, Insights and Forecast - by Indoor Lighting
- 11. Competitive Analysis
- 11.1. Global Market Share Analysis 2025
- 11.2. Company Profiles
- 11.2.1 OSRAM GmbH
- 11.2.1.1. Overview
- 11.2.1.2. Products
- 11.2.1.3. SWOT Analysis
- 11.2.1.4. Recent Developments
- 11.2.1.5. Financials (Based on Availability)
- 11.2.2 Koito Manufacturing Co Ltd
- 11.2.2.1. Overview
- 11.2.2.2. Products
- 11.2.2.3. SWOT Analysis
- 11.2.2.4. Recent Developments
- 11.2.2.5. Financials (Based on Availability)
- 11.2.3 Dialight
- 11.2.3.1. Overview
- 11.2.3.2. Products
- 11.2.3.3. SWOT Analysis
- 11.2.3.4. Recent Developments
- 11.2.3.5. Financials (Based on Availability)
- 11.2.4 ACUITY BRANDS INC
- 11.2.4.1. Overview
- 11.2.4.2. Products
- 11.2.4.3. SWOT Analysis
- 11.2.4.4. Recent Developments
- 11.2.4.5. Financials (Based on Availability)
- 11.2.5 Grupo Antolin Irausa SA
- 11.2.5.1. Overview
- 11.2.5.2. Products
- 11.2.5.3. SWOT Analysis
- 11.2.5.4. Recent Developments
- 11.2.5.5. Financials (Based on Availability)
- 11.2.6 NVC INTERNATIONAL HOLDINGS LIMITED
- 11.2.6.1. Overview
- 11.2.6.2. Products
- 11.2.6.3. SWOT Analysis
- 11.2.6.4. Recent Developments
- 11.2.6.5. Financials (Based on Availability)
- 11.2.7 Current Lighting Solutions LLC
- 11.2.7.1. Overview
- 11.2.7.2. Products
- 11.2.7.3. SWOT Analysis
- 11.2.7.4. Recent Developments
- 11.2.7.5. Financials (Based on Availability)
- 11.2.8 Marelli Holdings Co Ltd
- 11.2.8.1. Overview
- 11.2.8.2. Products
- 11.2.8.3. SWOT Analysis
- 11.2.8.4. Recent Developments
- 11.2.8.5. Financials (Based on Availability)
- 11.2.9 Signify (Philips)
- 11.2.9.1. Overview
- 11.2.9.2. Products
- 11.2.9.3. SWOT Analysis
- 11.2.9.4. Recent Developments
- 11.2.9.5. Financials (Based on Availability)
- 11.2.10 Stanley Electric Co Lt
- 11.2.10.1. Overview
- 11.2.10.2. Products
- 11.2.10.3. SWOT Analysis
- 11.2.10.4. Recent Developments
- 11.2.10.5. Financials (Based on Availability)
- 11.2.1 OSRAM GmbH
List of Figures
- Figure 1: Global US LED Industry Revenue Breakdown (billion, %) by Region 2025 & 2033
- Figure 2: Global US LED Industry Volume Breakdown (K Unit, %) by Region 2025 & 2033
- Figure 3: North America US LED Industry Revenue (billion), by Indoor Lighting 2025 & 2033
- Figure 4: North America US LED Industry Volume (K Unit), by Indoor Lighting 2025 & 2033
- Figure 5: North America US LED Industry Revenue Share (%), by Indoor Lighting 2025 & 2033
- Figure 6: North America US LED Industry Volume Share (%), by Indoor Lighting 2025 & 2033
- Figure 7: North America US LED Industry Revenue (billion), by Outdoor Lighting 2025 & 2033
- Figure 8: North America US LED Industry Volume (K Unit), by Outdoor Lighting 2025 & 2033
- Figure 9: North America US LED Industry Revenue Share (%), by Outdoor Lighting 2025 & 2033
- Figure 10: North America US LED Industry Volume Share (%), by Outdoor Lighting 2025 & 2033
- Figure 11: North America US LED Industry Revenue (billion), by Automotive Utility Lighting 2025 & 2033
- Figure 12: North America US LED Industry Volume (K Unit), by Automotive Utility Lighting 2025 & 2033
- Figure 13: North America US LED Industry Revenue Share (%), by Automotive Utility Lighting 2025 & 2033
- Figure 14: North America US LED Industry Volume Share (%), by Automotive Utility Lighting 2025 & 2033
- Figure 15: North America US LED Industry Revenue (billion), by Automotive Vehicle Lighting 2025 & 2033
- Figure 16: North America US LED Industry Volume (K Unit), by Automotive Vehicle Lighting 2025 & 2033
- Figure 17: North America US LED Industry Revenue Share (%), by Automotive Vehicle Lighting 2025 & 2033
- Figure 18: North America US LED Industry Volume Share (%), by Automotive Vehicle Lighting 2025 & 2033
- Figure 19: North America US LED Industry Revenue (billion), by Country 2025 & 2033
- Figure 20: North America US LED Industry Volume (K Unit), by Country 2025 & 2033
- Figure 21: North America US LED Industry Revenue Share (%), by Country 2025 & 2033
- Figure 22: North America US LED Industry Volume Share (%), by Country 2025 & 2033
- Figure 23: South America US LED Industry Revenue (billion), by Indoor Lighting 2025 & 2033
- Figure 24: South America US LED Industry Volume (K Unit), by Indoor Lighting 2025 & 2033
- Figure 25: South America US LED Industry Revenue Share (%), by Indoor Lighting 2025 & 2033
- Figure 26: South America US LED Industry Volume Share (%), by Indoor Lighting 2025 & 2033
- Figure 27: South America US LED Industry Revenue (billion), by Outdoor Lighting 2025 & 2033
- Figure 28: South America US LED Industry Volume (K Unit), by Outdoor Lighting 2025 & 2033
- Figure 29: South America US LED Industry Revenue Share (%), by Outdoor Lighting 2025 & 2033
- Figure 30: South America US LED Industry Volume Share (%), by Outdoor Lighting 2025 & 2033
- Figure 31: South America US LED Industry Revenue (billion), by Automotive Utility Lighting 2025 & 2033
- Figure 32: South America US LED Industry Volume (K Unit), by Automotive Utility Lighting 2025 & 2033
- Figure 33: South America US LED Industry Revenue Share (%), by Automotive Utility Lighting 2025 & 2033
- Figure 34: South America US LED Industry Volume Share (%), by Automotive Utility Lighting 2025 & 2033
- Figure 35: South America US LED Industry Revenue (billion), by Automotive Vehicle Lighting 2025 & 2033
- Figure 36: South America US LED Industry Volume (K Unit), by Automotive Vehicle Lighting 2025 & 2033
- Figure 37: South America US LED Industry Revenue Share (%), by Automotive Vehicle Lighting 2025 & 2033
- Figure 38: South America US LED Industry Volume Share (%), by Automotive Vehicle Lighting 2025 & 2033
- Figure 39: South America US LED Industry Revenue (billion), by Country 2025 & 2033
- Figure 40: South America US LED Industry Volume (K Unit), by Country 2025 & 2033
- Figure 41: South America US LED Industry Revenue Share (%), by Country 2025 & 2033
- Figure 42: South America US LED Industry Volume Share (%), by Country 2025 & 2033
- Figure 43: Europe US LED Industry Revenue (billion), by Indoor Lighting 2025 & 2033
- Figure 44: Europe US LED Industry Volume (K Unit), by Indoor Lighting 2025 & 2033
- Figure 45: Europe US LED Industry Revenue Share (%), by Indoor Lighting 2025 & 2033
- Figure 46: Europe US LED Industry Volume Share (%), by Indoor Lighting 2025 & 2033
- Figure 47: Europe US LED Industry Revenue (billion), by Outdoor Lighting 2025 & 2033
- Figure 48: Europe US LED Industry Volume (K Unit), by Outdoor Lighting 2025 & 2033
- Figure 49: Europe US LED Industry Revenue Share (%), by Outdoor Lighting 2025 & 2033
- Figure 50: Europe US LED Industry Volume Share (%), by Outdoor Lighting 2025 & 2033
- Figure 51: Europe US LED Industry Revenue (billion), by Automotive Utility Lighting 2025 & 2033
- Figure 52: Europe US LED Industry Volume (K Unit), by Automotive Utility Lighting 2025 & 2033
- Figure 53: Europe US LED Industry Revenue Share (%), by Automotive Utility Lighting 2025 & 2033
- Figure 54: Europe US LED Industry Volume Share (%), by Automotive Utility Lighting 2025 & 2033
- Figure 55: Europe US LED Industry Revenue (billion), by Automotive Vehicle Lighting 2025 & 2033
- Figure 56: Europe US LED Industry Volume (K Unit), by Automotive Vehicle Lighting 2025 & 2033
- Figure 57: Europe US LED Industry Revenue Share (%), by Automotive Vehicle Lighting 2025 & 2033
- Figure 58: Europe US LED Industry Volume Share (%), by Automotive Vehicle Lighting 2025 & 2033
- Figure 59: Europe US LED Industry Revenue (billion), by Country 2025 & 2033
- Figure 60: Europe US LED Industry Volume (K Unit), by Country 2025 & 2033
- Figure 61: Europe US LED Industry Revenue Share (%), by Country 2025 & 2033
- Figure 62: Europe US LED Industry Volume Share (%), by Country 2025 & 2033
- Figure 63: Middle East & Africa US LED Industry Revenue (billion), by Indoor Lighting 2025 & 2033
- Figure 64: Middle East & Africa US LED Industry Volume (K Unit), by Indoor Lighting 2025 & 2033
- Figure 65: Middle East & Africa US LED Industry Revenue Share (%), by Indoor Lighting 2025 & 2033
- Figure 66: Middle East & Africa US LED Industry Volume Share (%), by Indoor Lighting 2025 & 2033
- Figure 67: Middle East & Africa US LED Industry Revenue (billion), by Outdoor Lighting 2025 & 2033
- Figure 68: Middle East & Africa US LED Industry Volume (K Unit), by Outdoor Lighting 2025 & 2033
- Figure 69: Middle East & Africa US LED Industry Revenue Share (%), by Outdoor Lighting 2025 & 2033
- Figure 70: Middle East & Africa US LED Industry Volume Share (%), by Outdoor Lighting 2025 & 2033
- Figure 71: Middle East & Africa US LED Industry Revenue (billion), by Automotive Utility Lighting 2025 & 2033
- Figure 72: Middle East & Africa US LED Industry Volume (K Unit), by Automotive Utility Lighting 2025 & 2033
- Figure 73: Middle East & Africa US LED Industry Revenue Share (%), by Automotive Utility Lighting 2025 & 2033
- Figure 74: Middle East & Africa US LED Industry Volume Share (%), by Automotive Utility Lighting 2025 & 2033
- Figure 75: Middle East & Africa US LED Industry Revenue (billion), by Automotive Vehicle Lighting 2025 & 2033
- Figure 76: Middle East & Africa US LED Industry Volume (K Unit), by Automotive Vehicle Lighting 2025 & 2033
- Figure 77: Middle East & Africa US LED Industry Revenue Share (%), by Automotive Vehicle Lighting 2025 & 2033
- Figure 78: Middle East & Africa US LED Industry Volume Share (%), by Automotive Vehicle Lighting 2025 & 2033
- Figure 79: Middle East & Africa US LED Industry Revenue (billion), by Country 2025 & 2033
- Figure 80: Middle East & Africa US LED Industry Volume (K Unit), by Country 2025 & 2033
- Figure 81: Middle East & Africa US LED Industry Revenue Share (%), by Country 2025 & 2033
- Figure 82: Middle East & Africa US LED Industry Volume Share (%), by Country 2025 & 2033
- Figure 83: Asia Pacific US LED Industry Revenue (billion), by Indoor Lighting 2025 & 2033
- Figure 84: Asia Pacific US LED Industry Volume (K Unit), by Indoor Lighting 2025 & 2033
- Figure 85: Asia Pacific US LED Industry Revenue Share (%), by Indoor Lighting 2025 & 2033
- Figure 86: Asia Pacific US LED Industry Volume Share (%), by Indoor Lighting 2025 & 2033
- Figure 87: Asia Pacific US LED Industry Revenue (billion), by Outdoor Lighting 2025 & 2033
- Figure 88: Asia Pacific US LED Industry Volume (K Unit), by Outdoor Lighting 2025 & 2033
- Figure 89: Asia Pacific US LED Industry Revenue Share (%), by Outdoor Lighting 2025 & 2033
- Figure 90: Asia Pacific US LED Industry Volume Share (%), by Outdoor Lighting 2025 & 2033
- Figure 91: Asia Pacific US LED Industry Revenue (billion), by Automotive Utility Lighting 2025 & 2033
- Figure 92: Asia Pacific US LED Industry Volume (K Unit), by Automotive Utility Lighting 2025 & 2033
- Figure 93: Asia Pacific US LED Industry Revenue Share (%), by Automotive Utility Lighting 2025 & 2033
- Figure 94: Asia Pacific US LED Industry Volume Share (%), by Automotive Utility Lighting 2025 & 2033
- Figure 95: Asia Pacific US LED Industry Revenue (billion), by Automotive Vehicle Lighting 2025 & 2033
- Figure 96: Asia Pacific US LED Industry Volume (K Unit), by Automotive Vehicle Lighting 2025 & 2033
- Figure 97: Asia Pacific US LED Industry Revenue Share (%), by Automotive Vehicle Lighting 2025 & 2033
- Figure 98: Asia Pacific US LED Industry Volume Share (%), by Automotive Vehicle Lighting 2025 & 2033
- Figure 99: Asia Pacific US LED Industry Revenue (billion), by Country 2025 & 2033
- Figure 100: Asia Pacific US LED Industry Volume (K Unit), by Country 2025 & 2033
- Figure 101: Asia Pacific US LED Industry Revenue Share (%), by Country 2025 & 2033
- Figure 102: Asia Pacific US LED Industry Volume Share (%), by Country 2025 & 2033
List of Tables
- Table 1: Global US LED Industry Revenue billion Forecast, by Indoor Lighting 2020 & 2033
- Table 2: Global US LED Industry Volume K Unit Forecast, by Indoor Lighting 2020 & 2033
- Table 3: Global US LED Industry Revenue billion Forecast, by Outdoor Lighting 2020 & 2033
- Table 4: Global US LED Industry Volume K Unit Forecast, by Outdoor Lighting 2020 & 2033
- Table 5: Global US LED Industry Revenue billion Forecast, by Automotive Utility Lighting 2020 & 2033
- Table 6: Global US LED Industry Volume K Unit Forecast, by Automotive Utility Lighting 2020 & 2033
- Table 7: Global US LED Industry Revenue billion Forecast, by Automotive Vehicle Lighting 2020 & 2033
- Table 8: Global US LED Industry Volume K Unit Forecast, by Automotive Vehicle Lighting 2020 & 2033
- Table 9: Global US LED Industry Revenue billion Forecast, by Region 2020 & 2033
- Table 10: Global US LED Industry Volume K Unit Forecast, by Region 2020 & 2033
- Table 11: Global US LED Industry Revenue billion Forecast, by Indoor Lighting 2020 & 2033
- Table 12: Global US LED Industry Volume K Unit Forecast, by Indoor Lighting 2020 & 2033
- Table 13: Global US LED Industry Revenue billion Forecast, by Outdoor Lighting 2020 & 2033
- Table 14: Global US LED Industry Volume K Unit Forecast, by Outdoor Lighting 2020 & 2033
- Table 15: Global US LED Industry Revenue billion Forecast, by Automotive Utility Lighting 2020 & 2033
- Table 16: Global US LED Industry Volume K Unit Forecast, by Automotive Utility Lighting 2020 & 2033
- Table 17: Global US LED Industry Revenue billion Forecast, by Automotive Vehicle Lighting 2020 & 2033
- Table 18: Global US LED Industry Volume K Unit Forecast, by Automotive Vehicle Lighting 2020 & 2033
- Table 19: Global US LED Industry Revenue billion Forecast, by Country 2020 & 2033
- Table 20: Global US LED Industry Volume K Unit Forecast, by Country 2020 & 2033
- Table 21: United States US LED Industry Revenue (billion) Forecast, by Application 2020 & 2033
- Table 22: United States US LED Industry Volume (K Unit) Forecast, by Application 2020 & 2033
- Table 23: Canada US LED Industry Revenue (billion) Forecast, by Application 2020 & 2033
- Table 24: Canada US LED Industry Volume (K Unit) Forecast, by Application 2020 & 2033
- Table 25: Mexico US LED Industry Revenue (billion) Forecast, by Application 2020 & 2033
- Table 26: Mexico US LED Industry Volume (K Unit) Forecast, by Application 2020 & 2033
- Table 27: Global US LED Industry Revenue billion Forecast, by Indoor Lighting 2020 & 2033
- Table 28: Global US LED Industry Volume K Unit Forecast, by Indoor Lighting 2020 & 2033
- Table 29: Global US LED Industry Revenue billion Forecast, by Outdoor Lighting 2020 & 2033
- Table 30: Global US LED Industry Volume K Unit Forecast, by Outdoor Lighting 2020 & 2033
- Table 31: Global US LED Industry Revenue billion Forecast, by Automotive Utility Lighting 2020 & 2033
- Table 32: Global US LED Industry Volume K Unit Forecast, by Automotive Utility Lighting 2020 & 2033
- Table 33: Global US LED Industry Revenue billion Forecast, by Automotive Vehicle Lighting 2020 & 2033
- Table 34: Global US LED Industry Volume K Unit Forecast, by Automotive Vehicle Lighting 2020 & 2033
- Table 35: Global US LED Industry Revenue billion Forecast, by Country 2020 & 2033
- Table 36: Global US LED Industry Volume K Unit Forecast, by Country 2020 & 2033
- Table 37: Brazil US LED Industry Revenue (billion) Forecast, by Application 2020 & 2033
- Table 38: Brazil US LED Industry Volume (K Unit) Forecast, by Application 2020 & 2033
- Table 39: Argentina US LED Industry Revenue (billion) Forecast, by Application 2020 & 2033
- Table 40: Argentina US LED Industry Volume (K Unit) Forecast, by Application 2020 & 2033
- Table 41: Rest of South America US LED Industry Revenue (billion) Forecast, by Application 2020 & 2033
- Table 42: Rest of South America US LED Industry Volume (K Unit) Forecast, by Application 2020 & 2033
- Table 43: Global US LED Industry Revenue billion Forecast, by Indoor Lighting 2020 & 2033
- Table 44: Global US LED Industry Volume K Unit Forecast, by Indoor Lighting 2020 & 2033
- Table 45: Global US LED Industry Revenue billion Forecast, by Outdoor Lighting 2020 & 2033
- Table 46: Global US LED Industry Volume K Unit Forecast, by Outdoor Lighting 2020 & 2033
- Table 47: Global US LED Industry Revenue billion Forecast, by Automotive Utility Lighting 2020 & 2033
- Table 48: Global US LED Industry Volume K Unit Forecast, by Automotive Utility Lighting 2020 & 2033
- Table 49: Global US LED Industry Revenue billion Forecast, by Automotive Vehicle Lighting 2020 & 2033
- Table 50: Global US LED Industry Volume K Unit Forecast, by Automotive Vehicle Lighting 2020 & 2033
- Table 51: Global US LED Industry Revenue billion Forecast, by Country 2020 & 2033
- Table 52: Global US LED Industry Volume K Unit Forecast, by Country 2020 & 2033
- Table 53: United Kingdom US LED Industry Revenue (billion) Forecast, by Application 2020 & 2033
- Table 54: United Kingdom US LED Industry Volume (K Unit) Forecast, by Application 2020 & 2033
- Table 55: Germany US LED Industry Revenue (billion) Forecast, by Application 2020 & 2033
- Table 56: Germany US LED Industry Volume (K Unit) Forecast, by Application 2020 & 2033
- Table 57: France US LED Industry Revenue (billion) Forecast, by Application 2020 & 2033
- Table 58: France US LED Industry Volume (K Unit) Forecast, by Application 2020 & 2033
- Table 59: Italy US LED Industry Revenue (billion) Forecast, by Application 2020 & 2033
- Table 60: Italy US LED Industry Volume (K Unit) Forecast, by Application 2020 & 2033
- Table 61: Spain US LED Industry Revenue (billion) Forecast, by Application 2020 & 2033
- Table 62: Spain US LED Industry Volume (K Unit) Forecast, by Application 2020 & 2033
- Table 63: Russia US LED Industry Revenue (billion) Forecast, by Application 2020 & 2033
- Table 64: Russia US LED Industry Volume (K Unit) Forecast, by Application 2020 & 2033
- Table 65: Benelux US LED Industry Revenue (billion) Forecast, by Application 2020 & 2033
- Table 66: Benelux US LED Industry Volume (K Unit) Forecast, by Application 2020 & 2033
- Table 67: Nordics US LED Industry Revenue (billion) Forecast, by Application 2020 & 2033
- Table 68: Nordics US LED Industry Volume (K Unit) Forecast, by Application 2020 & 2033
- Table 69: Rest of Europe US LED Industry Revenue (billion) Forecast, by Application 2020 & 2033
- Table 70: Rest of Europe US LED Industry Volume (K Unit) Forecast, by Application 2020 & 2033
- Table 71: Global US LED Industry Revenue billion Forecast, by Indoor Lighting 2020 & 2033
- Table 72: Global US LED Industry Volume K Unit Forecast, by Indoor Lighting 2020 & 2033
- Table 73: Global US LED Industry Revenue billion Forecast, by Outdoor Lighting 2020 & 2033
- Table 74: Global US LED Industry Volume K Unit Forecast, by Outdoor Lighting 2020 & 2033
- Table 75: Global US LED Industry Revenue billion Forecast, by Automotive Utility Lighting 2020 & 2033
- Table 76: Global US LED Industry Volume K Unit Forecast, by Automotive Utility Lighting 2020 & 2033
- Table 77: Global US LED Industry Revenue billion Forecast, by Automotive Vehicle Lighting 2020 & 2033
- Table 78: Global US LED Industry Volume K Unit Forecast, by Automotive Vehicle Lighting 2020 & 2033
- Table 79: Global US LED Industry Revenue billion Forecast, by Country 2020 & 2033
- Table 80: Global US LED Industry Volume K Unit Forecast, by Country 2020 & 2033
- Table 81: Turkey US LED Industry Revenue (billion) Forecast, by Application 2020 & 2033
- Table 82: Turkey US LED Industry Volume (K Unit) Forecast, by Application 2020 & 2033
- Table 83: Israel US LED Industry Revenue (billion) Forecast, by Application 2020 & 2033
- Table 84: Israel US LED Industry Volume (K Unit) Forecast, by Application 2020 & 2033
- Table 85: GCC US LED Industry Revenue (billion) Forecast, by Application 2020 & 2033
- Table 86: GCC US LED Industry Volume (K Unit) Forecast, by Application 2020 & 2033
- Table 87: North Africa US LED Industry Revenue (billion) Forecast, by Application 2020 & 2033
- Table 88: North Africa US LED Industry Volume (K Unit) Forecast, by Application 2020 & 2033
- Table 89: South Africa US LED Industry Revenue (billion) Forecast, by Application 2020 & 2033
- Table 90: South Africa US LED Industry Volume (K Unit) Forecast, by Application 2020 & 2033
- Table 91: Rest of Middle East & Africa US LED Industry Revenue (billion) Forecast, by Application 2020 & 2033
- Table 92: Rest of Middle East & Africa US LED Industry Volume (K Unit) Forecast, by Application 2020 & 2033
- Table 93: Global US LED Industry Revenue billion Forecast, by Indoor Lighting 2020 & 2033
- Table 94: Global US LED Industry Volume K Unit Forecast, by Indoor Lighting 2020 & 2033
- Table 95: Global US LED Industry Revenue billion Forecast, by Outdoor Lighting 2020 & 2033
- Table 96: Global US LED Industry Volume K Unit Forecast, by Outdoor Lighting 2020 & 2033
- Table 97: Global US LED Industry Revenue billion Forecast, by Automotive Utility Lighting 2020 & 2033
- Table 98: Global US LED Industry Volume K Unit Forecast, by Automotive Utility Lighting 2020 & 2033
- Table 99: Global US LED Industry Revenue billion Forecast, by Automotive Vehicle Lighting 2020 & 2033
- Table 100: Global US LED Industry Volume K Unit Forecast, by Automotive Vehicle Lighting 2020 & 2033
- Table 101: Global US LED Industry Revenue billion Forecast, by Country 2020 & 2033
- Table 102: Global US LED Industry Volume K Unit Forecast, by Country 2020 & 2033
- Table 103: China US LED Industry Revenue (billion) Forecast, by Application 2020 & 2033
- Table 104: China US LED Industry Volume (K Unit) Forecast, by Application 2020 & 2033
- Table 105: India US LED Industry Revenue (billion) Forecast, by Application 2020 & 2033
- Table 106: India US LED Industry Volume (K Unit) Forecast, by Application 2020 & 2033
- Table 107: Japan US LED Industry Revenue (billion) Forecast, by Application 2020 & 2033
- Table 108: Japan US LED Industry Volume (K Unit) Forecast, by Application 2020 & 2033
- Table 109: South Korea US LED Industry Revenue (billion) Forecast, by Application 2020 & 2033
- Table 110: South Korea US LED Industry Volume (K Unit) Forecast, by Application 2020 & 2033
- Table 111: ASEAN US LED Industry Revenue (billion) Forecast, by Application 2020 & 2033
- Table 112: ASEAN US LED Industry Volume (K Unit) Forecast, by Application 2020 & 2033
- Table 113: Oceania US LED Industry Revenue (billion) Forecast, by Application 2020 & 2033
- Table 114: Oceania US LED Industry Volume (K Unit) Forecast, by Application 2020 & 2033
- Table 115: Rest of Asia Pacific US LED Industry Revenue (billion) Forecast, by Application 2020 & 2033
- Table 116: Rest of Asia Pacific US LED Industry Volume (K Unit) Forecast, by Application 2020 & 2033
Frequently Asked Questions
1. What is the projected Compound Annual Growth Rate (CAGR) of the US LED Industry?
The projected CAGR is approximately 5.06%.
2. Which companies are prominent players in the US LED Industry?
Key companies in the market include OSRAM GmbH, Koito Manufacturing Co Ltd, Dialight, ACUITY BRANDS INC, Grupo Antolin Irausa SA, NVC INTERNATIONAL HOLDINGS LIMITED, Current Lighting Solutions LLC, Marelli Holdings Co Ltd, Signify (Philips), Stanley Electric Co Lt.
3. What are the main segments of the US LED Industry?
The market segments include Indoor Lighting, Outdoor Lighting, Automotive Utility Lighting, Automotive Vehicle Lighting.
4. Can you provide details about the market size?
The market size is estimated to be USD 19.22 billion as of 2022.
5. What are some drivers contributing to market growth?
Enhanced Precision and Accuracy over Conventional Alternatives; Miniaturization of Component Parts.
6. What are the notable trends driving market growth?
OTHER KEY INDUSTRY TRENDS COVERED IN THE REPORT.
7. Are there any restraints impacting market growth?
Regulation Compliance Associated with Laser Usage.
8. Can you provide examples of recent developments in the market?
May 2023: Cyclone Lighting, a well-known manufacturer of outdoor luminaires, has announced the debut of its Elencia luminaire. Outdoor post-top lighting has an upscale look thanks to high-performance optics and revised, modern lantern style.May 2023: Dialight, a company in hazardous and industrial LED lighting innovation, has introduced the ProSite High Mast, an expansion of the company's extremely successful ProSite Floodlight range. This new model is carefully constructed to withstand mounting heights of up to 130 feet for a wide range of outdoor industrial applications such as airports, container yards, rail yards, product stockpiles, transportation, perimeter lighting, and parking applications. With a total lumen output of up to 65,000, the ProSite High Mast improves site security by providing uniform, crisp, and clear illumination.April 2023: Hydrel, an established innovator and producer of outdoor architectural and landscape lighting systems, announced the addition of the M9700 RGBW fixture to its M9000 ingrade luminaire family.
9. What pricing options are available for accessing the report?
Pricing options include single-user, multi-user, and enterprise licenses priced at USD 3800, USD 4500, and USD 5800 respectively.
10. Is the market size provided in terms of value or volume?
The market size is provided in terms of value, measured in billion and volume, measured in K Unit.
11. Are there any specific market keywords associated with the report?
Yes, the market keyword associated with the report is "US LED Industry," which aids in identifying and referencing the specific market segment covered.
12. How do I determine which pricing option suits my needs best?
The pricing options vary based on user requirements and access needs. Individual users may opt for single-user licenses, while businesses requiring broader access may choose multi-user or enterprise licenses for cost-effective access to the report.
13. Are there any additional resources or data provided in the US LED Industry report?
While the report offers comprehensive insights, it's advisable to review the specific contents or supplementary materials provided to ascertain if additional resources or data are available.
14. How can I stay updated on further developments or reports in the US LED Industry?
To stay informed about further developments, trends, and reports in the US LED Industry, consider subscribing to industry newsletters, following relevant companies and organizations, or regularly checking reputable industry news sources and publications.
Methodology
Step 1 - Identification of Relevant Samples Size from Population Database


Step 2 - Approaches for Defining Global Market Size (Value, Volume* & Price*)

Note*: In applicable scenarios
Step 3 - Data Sources
Primary Research
- Web Analytics
- Survey Reports
- Research Institute
- Latest Research Reports
- Opinion Leaders
Secondary Research
- Annual Reports
- White Paper
- Latest Press Release
- Industry Association
- Paid Database
- Investor Presentations

Step 4 - Data Triangulation
Involves using different sources of information in order to increase the validity of a study
These sources are likely to be stakeholders in a program - participants, other researchers, program staff, other community members, and so on.
Then we put all data in single framework & apply various statistical tools to find out the dynamic on the market.
During the analysis stage, feedback from the stakeholder groups would be compared to determine areas of agreement as well as areas of divergence