
Key Insights
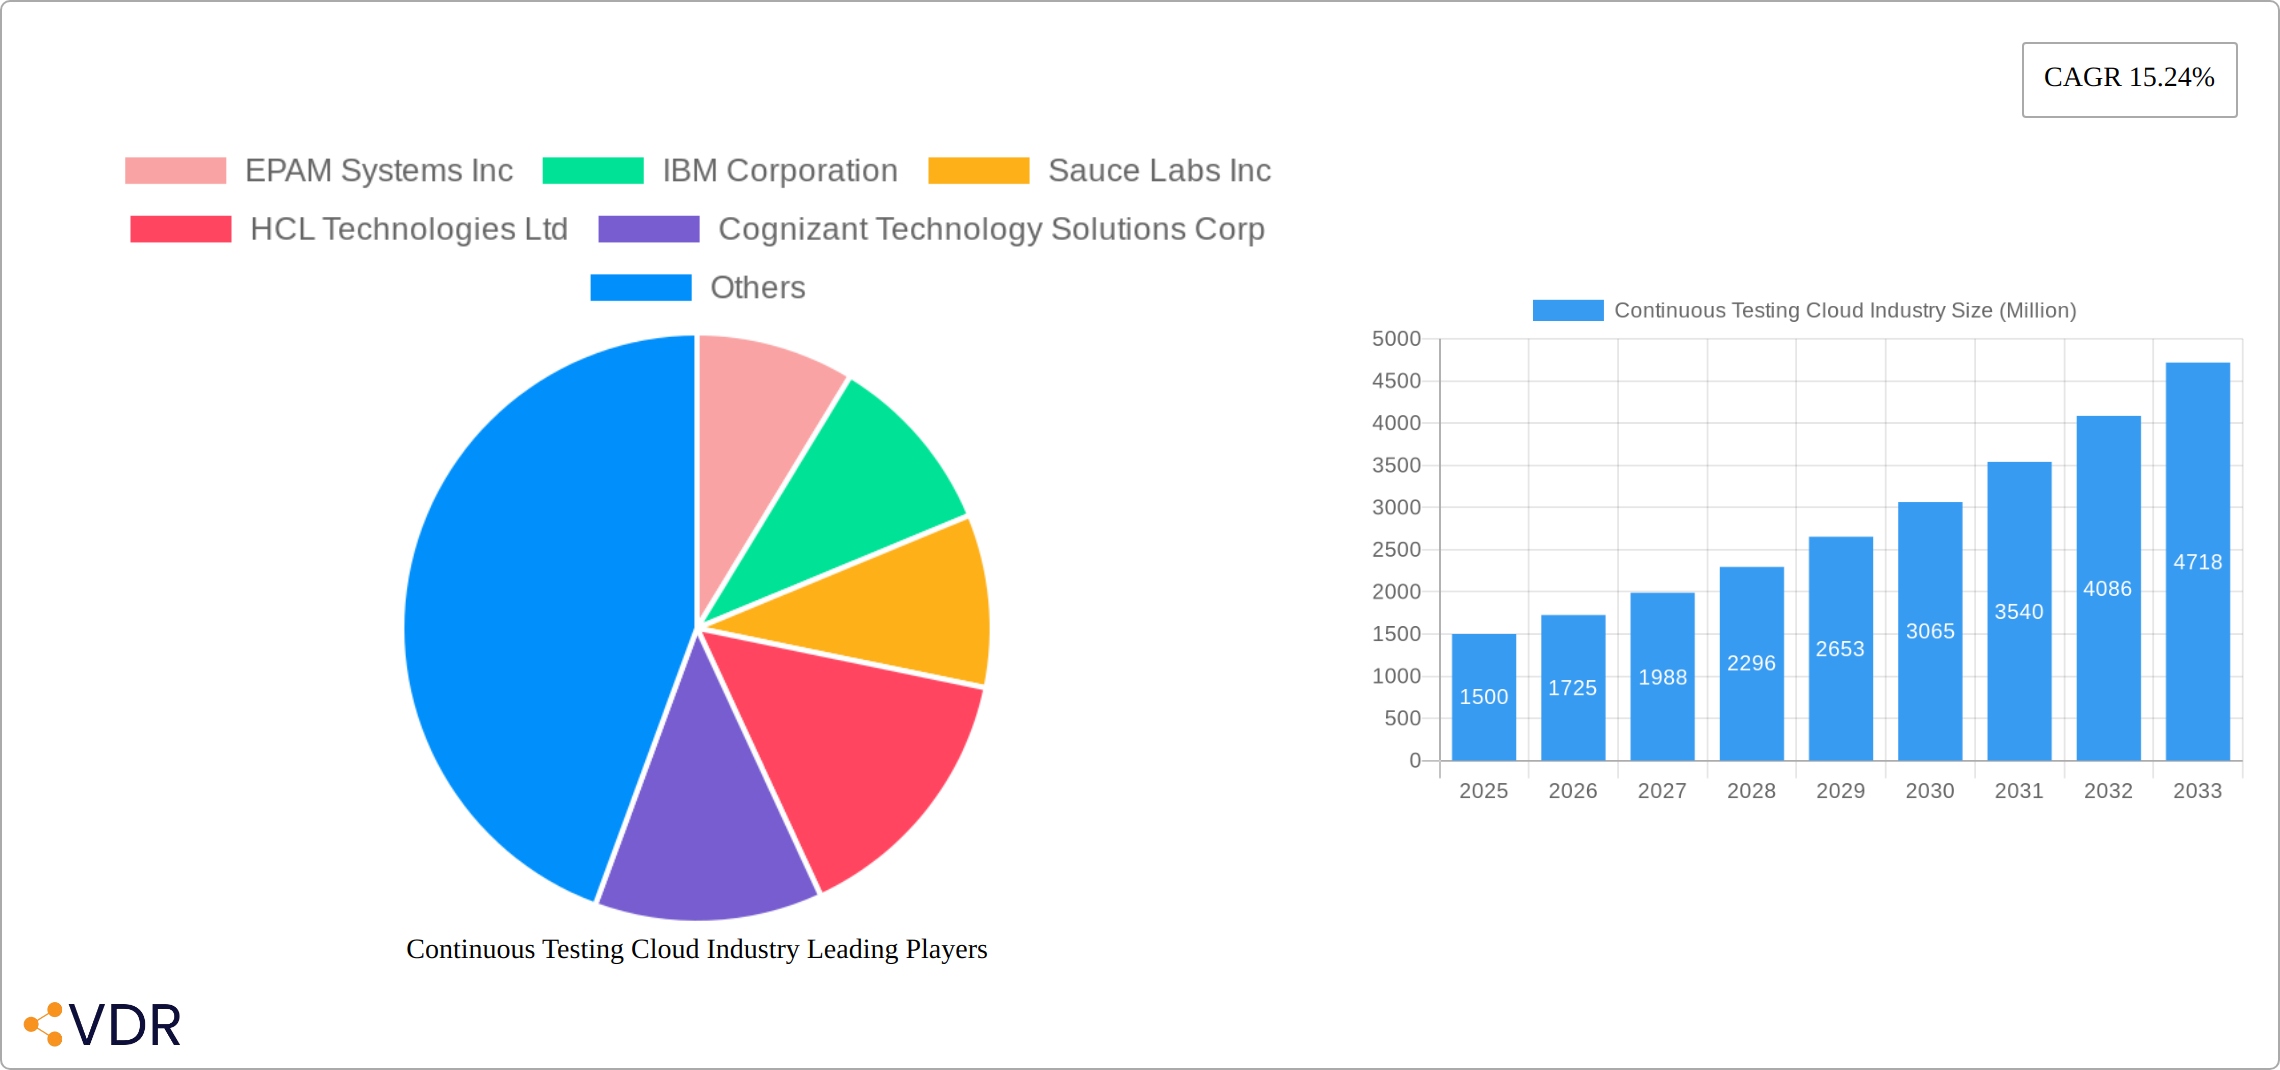
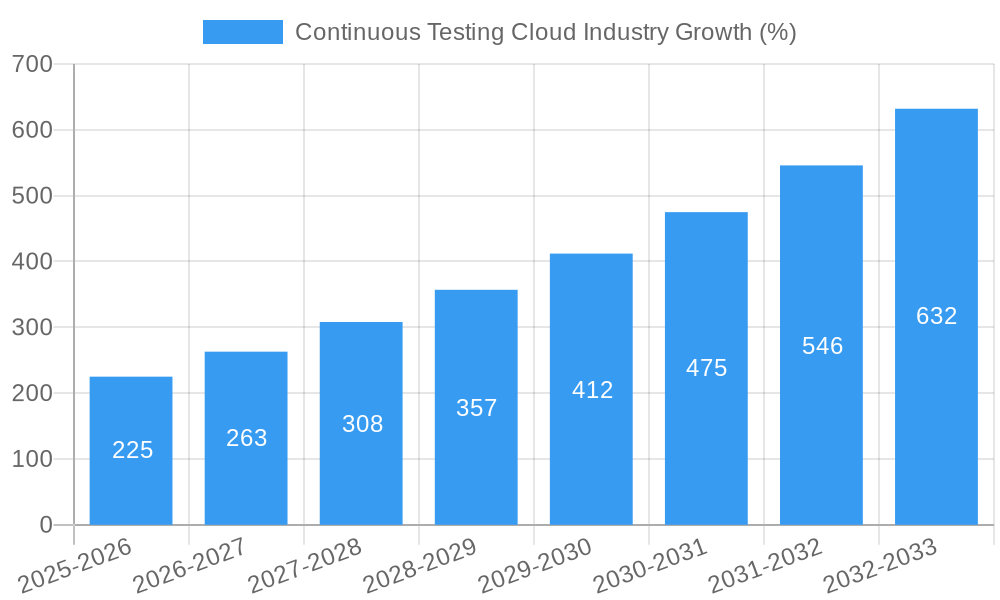
The Continuous Testing Cloud market is experiencing robust growth, projected to reach a substantial size driven by the increasing adoption of cloud-based technologies, the accelerating need for faster software delivery cycles, and the rising demand for improved software quality. The 15.24% CAGR from 2019-2033 signifies a significant expansion, with the market expected to more than double in size by 2033 compared to its 2019 value. Key growth drivers include the shift towards DevOps and Agile methodologies, increasing digital transformation initiatives across industries, and the need for comprehensive test automation to ensure seamless software functionality across various platforms (web, desktop, mobile). The cloud-based deployment model is a major catalyst for market expansion due to its scalability, cost-effectiveness, and accessibility. While the market faces challenges like security concerns surrounding cloud-based testing and the complexities involved in integrating diverse testing tools, the advantages of continuous testing far outweigh these limitations.
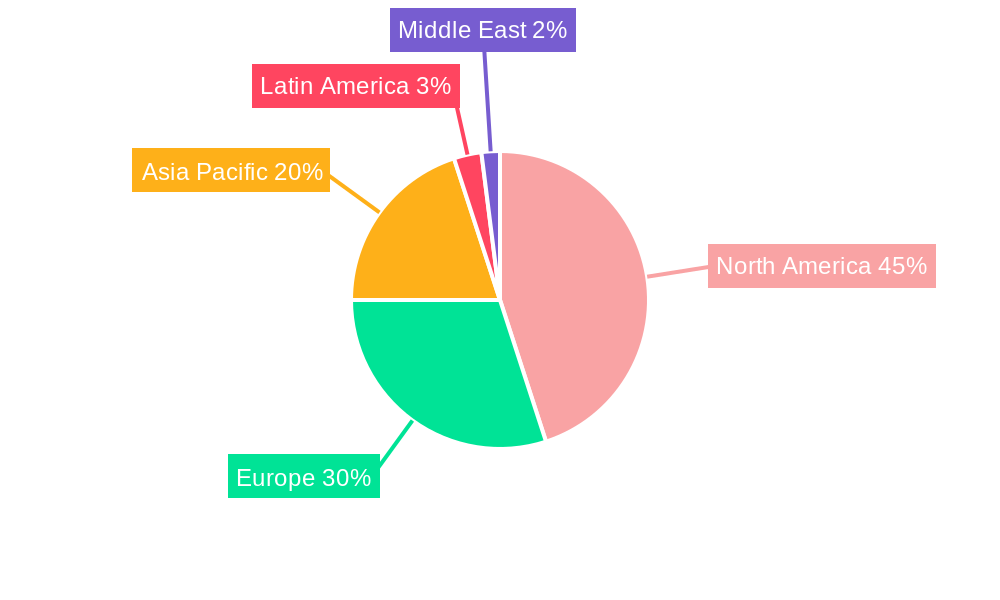
Segmentation analysis reveals strong demand across all service types – managed and professional services – reflecting the diverse needs of businesses, from outsourced testing solutions to specialized expertise for complex projects. The increasing ubiquity of smartphones and tablets fuels the growth in mobile interface testing, a key segment within the market. Furthermore, the geographic distribution reveals North America currently holds a significant market share, followed by Europe and the Asia-Pacific region. However, emerging markets in Asia-Pacific and Latin America are anticipated to witness rapid growth in the coming years, driven by increasing technology adoption and digitalization initiatives in these regions. Key players such as EPAM Systems, IBM, Sauce Labs, and HCL Technologies are strategically positioned to capitalize on this burgeoning market opportunity by continuously innovating and expanding their service offerings. The competitive landscape is dynamic, necessitating constant innovation and strategic partnerships to maintain market leadership.
Continuous Testing Cloud Industry Market Report: 2019-2033
This comprehensive report provides a detailed analysis of the Continuous Testing Cloud industry, encompassing market dynamics, growth trends, regional segmentation, product landscape, key players, and future outlook. The study period covers 2019-2033, with a base year of 2025 and a forecast period of 2025-2033. The report utilizes data from the historical period (2019-2024) to project future market growth. The market is segmented by service (Managed Service, Professional Service), interface (Web, Desktop, Mobile), and deployment type (On-premise, Cloud-based). The total market size in 2025 is estimated at xx Million.
Continuous Testing Cloud Industry Market Dynamics & Structure
The Continuous Testing Cloud market exhibits moderate concentration, with several key players commanding significant market share. This dynamic landscape is fueled by rapid technological innovation, particularly advancements in AI and automation, which are accelerating the adoption of cloud-based testing solutions. However, the market is also significantly shaped by the ever-evolving regulatory frameworks surrounding data privacy and security, demanding robust compliance measures from providers. While traditional testing methodologies remain viable alternatives, the industry is witnessing a substantial shift towards agile and DevOps practices, making continuous testing an increasingly indispensable component of the software development lifecycle. The end-user base spans diverse industries, with a notable concentration in technology, finance, and healthcare, reflecting the critical need for reliable and efficient software in these sectors. Furthermore, the market has seen considerable M&A activity in recent years, indicating strategic maneuvers by established players to expand capabilities and market reach.
- Market Concentration: Moderately concentrated, with top players holding a substantial market share, projected to reach approximately [Insert Projected Percentage]% in 2025. This concentration is expected to [Increase/Decrease/Remain Stable] in the coming years due to [Specific Market Factors].
- Technological Innovation: AI-powered test automation, cloud-native solutions, and seamless integration with DevOps pipelines are pivotal growth drivers, enabling faster testing cycles and improved accuracy.
- Regulatory Landscape: Stringent compliance with data privacy regulations (e.g., GDPR, CCPA, and other relevant regional regulations) is paramount, influencing both the adoption rate and the service offerings of Continuous Testing Cloud providers. This necessitates robust security protocols and transparent data handling practices.
- Competitive Landscape: While traditional testing methods persist, the efficiency and scalability of continuous testing offer a compelling advantage, accelerating the shift away from legacy approaches. This is further fueled by the growing demand for rapid software deployment and improved quality assurance.
- M&A Activity: Significant M&A activity has been observed over the past few years, with [Insert Number] deals recorded between 2019-2024, reflecting the strategic importance of continuous testing and the consolidation within the market.
Continuous Testing Cloud Industry Growth Trends & Insights
The Continuous Testing Cloud market exhibits robust growth, driven by increasing cloud adoption, the rise of DevOps methodologies, and the need for faster software release cycles. The market size experienced a CAGR of xx% during the historical period (2019-2024) and is projected to reach xx Million by 2033, with a CAGR of xx% during the forecast period (2025-2033). Market penetration is increasing across various industry verticals, particularly in organizations embracing digital transformation initiatives. Technological advancements, such as AI-powered test automation and shift-left testing, are further accelerating market growth. Consumer behavior shifts toward faster delivery and higher quality software fuel demand.
Dominant Regions, Countries, or Segments in Continuous Testing Cloud Industry
North America currently holds the dominant market share in the Continuous Testing Cloud industry, driven by high cloud adoption rates, a robust technological infrastructure, and the presence of major industry players. This region's advanced digital ecosystem and significant IT spending contribute to its leading position. Within the service segment, Managed Services represent the largest portion of the market, capturing approximately [Insert Percentage]% in 2025, projected to further expand due to its inherent cost-effectiveness and scalability advantages for businesses. The Cloud-based deployment type exhibits the fastest growth, exceeding [Insert Percentage]% market share in 2025, favored for its flexibility and accessibility. While Web interface testing currently holds a significant share, Mobile interface testing is predicted to experience the most rapid growth, mirroring the exponential rise of mobile applications across all sectors.
- Key Drivers in North America: High cloud adoption rates, substantial IT spending, a concentrated presence of major players, and a well-established technological infrastructure. Further growth is anticipated due to [Specific Regional Factors].
- Managed Services Dominance: The cost-effectiveness and scalability of Managed Services, coupled with reduced IT burden for enterprises, drives their widespread adoption and continued market leadership.
- Cloud-Based Deployment Growth: The flexibility, scalability, and pay-as-you-go models offered by cloud-based deployments are key factors driving this segment's rapid growth.
- Mobile Interface Testing Growth: The ubiquitous use of mobile applications across various sectors fuels the escalating demand for robust and efficient mobile interface testing solutions.
Continuous Testing Cloud Industry Product Landscape
The Continuous Testing Cloud market offers a diverse range of products, including AI-powered test automation platforms, cloud-based testing environments, and integrated DevOps tools. These platforms provide features such as automated test creation, execution, and reporting, along with real-time analytics and performance monitoring. Unique selling propositions often center around ease of use, scalability, integration capabilities, and the ability to accelerate testing cycles. Continuous innovation focuses on enhancing AI capabilities, improving test coverage, and integrating with emerging technologies like serverless computing.
Key Drivers, Barriers & Challenges in Continuous Testing Cloud Industry
Key Drivers:
- The accelerating adoption of cloud technologies and widespread digital transformation initiatives are fundamentally reshaping software development practices, driving the demand for continuous testing solutions.
- The intense pressure to shorten software delivery cycles while enhancing quality assurance has propelled continuous testing to the forefront of development strategies.
- The rising popularity of DevOps and Agile methodologies necessitates efficient and integrated testing processes, making continuous testing a vital component.
- Advancements in AI and machine learning are significantly improving test automation capabilities, increasing efficiency and reducing manual effort.
Challenges & Restraints:
- The high initial investment costs associated with implementing comprehensive continuous testing solutions can be a barrier to entry, particularly for smaller organizations.
- A significant skill gap exists in effectively managing and implementing complex cloud-based testing environments, requiring specialized expertise and training.
- Integrating continuous testing solutions with existing legacy systems can present integration challenges, demanding careful planning and execution.
- Data security and privacy concerns associated with cloud-based testing remain a significant challenge, requiring robust security measures and compliance with relevant regulations.
Emerging Opportunities in Continuous Testing Cloud Industry
The Continuous Testing Cloud market presents several emerging opportunities, including:
- Expansion into untapped markets, such as small and medium-sized enterprises (SMEs)
- Development of specialized solutions for specific industries, e.g., healthcare, finance.
- Integration with emerging technologies like IoT and blockchain.
- Growing demand for AI-powered test analytics and predictive testing capabilities.
Growth Accelerators in the Continuous Testing Cloud Industry Industry
Long-term growth in the Continuous Testing Cloud industry will be fueled by technological advancements in AI and machine learning, driving greater automation and efficiency. Strategic partnerships between testing vendors and cloud providers will expand market reach and integration capabilities. Expansion into emerging markets and the development of specialized solutions will further contribute to sustained growth. Government initiatives supporting digital transformation will also play a significant role in accelerating market expansion.
Key Players Shaping the Continuous Testing Cloud Market
- EPAM Systems Inc
- IBM Corporation
- Sauce Labs Inc
- HCL Technologies Ltd
- Cognizant Technology Solutions Corp
- Cigniti Technologies Limited
- Larsen & Toubro Infotech Ltd
- Atos SE
- Mindtree Limited
- Tech Mahindra Limited
- Hexaware Technologies Ltd
- Broadcom Inc (CA Technologies Inc)
Notable Milestones in Continuous Testing Cloud Industry Sector
- February 2022: Tricentis announced new strategies and solutions for accelerating cloud adoption via continuous testing, signifying a strategic focus on expanding its market reach.
- February 2022: Tricentis acquired Testim, an AI-based SaaS test automation platform, significantly enhancing its cloud-based testing capabilities and market position.
- May 2022: Opera partnered with Mindtree to enhance enterprise transformation through continuous testing, demonstrating the strategic importance of partnerships in driving market growth.
- [Add other significant milestones with dates and brief descriptions]
In-Depth Continuous Testing Cloud Industry Market Outlook
The Continuous Testing Cloud market is poised for substantial growth, driven by the sustained adoption of cloud computing, the increasing demand for agile software development practices, and the ongoing evolution of AI-powered testing solutions. Strategic partnerships, continuous technological innovation, and expansion into emerging markets present significant opportunities for both established players and new entrants. The future trajectory of this market strongly suggests a landscape characterized by highly automated, AI-driven processes, resulting in increased efficiency, significantly reduced testing cycles, and ultimately, a considerable improvement in overall software quality. [Add future predictions and analysis, e.g., projected market size in specific years, potential disruptions, etc.]
Continuous Testing Cloud Industry Segmentation
-
1. Service
- 1.1. Managed Service
- 1.2. Professional Service
-
2. Interface
- 2.1. Web
- 2.2. Desktop
- 2.3. Mobile
-
3. Deployment Type
- 3.1. On-premise
- 3.2. Cloud-based
Continuous Testing Cloud Industry Segmentation By Geography
- 1. North America
- 2. Europe
- 3. Asia Pacific
- 4. Latin America
- 5. Middle East
Continuous Testing Cloud Industry REPORT HIGHLIGHTS
| Aspects | Details |
|---|---|
| Study Period | 2019-2033 |
| Base Year | 2024 |
| Estimated Year | 2025 |
| Forecast Period | 2025-2033 |
| Historical Period | 2019-2024 |
| Growth Rate | CAGR of 15.24% from 2019-2033 |
| Segmentation |
|
Table of Contents
- 1. Introduction
- 1.1. Research Scope
- 1.2. Market Segmentation
- 1.3. Research Methodology
- 1.4. Definitions and Assumptions
- 2. Executive Summary
- 2.1. Introduction
- 3. Market Dynamics
- 3.1. Introduction
- 3.2. Market Drivers
- 3.2.1. Adoption of Agile and DevOps; Increasing Need for Continuous and Timely Delivery
- 3.3. Market Restrains
- 3.3.1. Dependency on Traditional Approaches; Lack of a Skilled and Experienced Test Automation Workforce
- 3.4. Market Trends
- 3.4.1. Cloud Based Deployment to Grow Significantly
- 4. Market Factor Analysis
- 4.1. Porters Five Forces
- 4.2. Supply/Value Chain
- 4.3. PESTEL analysis
- 4.4. Market Entropy
- 4.5. Patent/Trademark Analysis
- 5. Global Continuous Testing Cloud Industry Analysis, Insights and Forecast, 2019-2031
- 5.1. Market Analysis, Insights and Forecast - by Service
- 5.1.1. Managed Service
- 5.1.2. Professional Service
- 5.2. Market Analysis, Insights and Forecast - by Interface
- 5.2.1. Web
- 5.2.2. Desktop
- 5.2.3. Mobile
- 5.3. Market Analysis, Insights and Forecast - by Deployment Type
- 5.3.1. On-premise
- 5.3.2. Cloud-based
- 5.4. Market Analysis, Insights and Forecast - by Region
- 5.4.1. North America
- 5.4.2. Europe
- 5.4.3. Asia Pacific
- 5.4.4. Latin America
- 5.4.5. Middle East
- 5.1. Market Analysis, Insights and Forecast - by Service
- 6. North America Continuous Testing Cloud Industry Analysis, Insights and Forecast, 2019-2031
- 6.1. Market Analysis, Insights and Forecast - by Service
- 6.1.1. Managed Service
- 6.1.2. Professional Service
- 6.2. Market Analysis, Insights and Forecast - by Interface
- 6.2.1. Web
- 6.2.2. Desktop
- 6.2.3. Mobile
- 6.3. Market Analysis, Insights and Forecast - by Deployment Type
- 6.3.1. On-premise
- 6.3.2. Cloud-based
- 6.1. Market Analysis, Insights and Forecast - by Service
- 7. Europe Continuous Testing Cloud Industry Analysis, Insights and Forecast, 2019-2031
- 7.1. Market Analysis, Insights and Forecast - by Service
- 7.1.1. Managed Service
- 7.1.2. Professional Service
- 7.2. Market Analysis, Insights and Forecast - by Interface
- 7.2.1. Web
- 7.2.2. Desktop
- 7.2.3. Mobile
- 7.3. Market Analysis, Insights and Forecast - by Deployment Type
- 7.3.1. On-premise
- 7.3.2. Cloud-based
- 7.1. Market Analysis, Insights and Forecast - by Service
- 8. Asia Pacific Continuous Testing Cloud Industry Analysis, Insights and Forecast, 2019-2031
- 8.1. Market Analysis, Insights and Forecast - by Service
- 8.1.1. Managed Service
- 8.1.2. Professional Service
- 8.2. Market Analysis, Insights and Forecast - by Interface
- 8.2.1. Web
- 8.2.2. Desktop
- 8.2.3. Mobile
- 8.3. Market Analysis, Insights and Forecast - by Deployment Type
- 8.3.1. On-premise
- 8.3.2. Cloud-based
- 8.1. Market Analysis, Insights and Forecast - by Service
- 9. Latin America Continuous Testing Cloud Industry Analysis, Insights and Forecast, 2019-2031
- 9.1. Market Analysis, Insights and Forecast - by Service
- 9.1.1. Managed Service
- 9.1.2. Professional Service
- 9.2. Market Analysis, Insights and Forecast - by Interface
- 9.2.1. Web
- 9.2.2. Desktop
- 9.2.3. Mobile
- 9.3. Market Analysis, Insights and Forecast - by Deployment Type
- 9.3.1. On-premise
- 9.3.2. Cloud-based
- 9.1. Market Analysis, Insights and Forecast - by Service
- 10. Middle East Continuous Testing Cloud Industry Analysis, Insights and Forecast, 2019-2031
- 10.1. Market Analysis, Insights and Forecast - by Service
- 10.1.1. Managed Service
- 10.1.2. Professional Service
- 10.2. Market Analysis, Insights and Forecast - by Interface
- 10.2.1. Web
- 10.2.2. Desktop
- 10.2.3. Mobile
- 10.3. Market Analysis, Insights and Forecast - by Deployment Type
- 10.3.1. On-premise
- 10.3.2. Cloud-based
- 10.1. Market Analysis, Insights and Forecast - by Service
- 11. North America Continuous Testing Cloud Industry Analysis, Insights and Forecast, 2019-2031
- 11.1. Market Analysis, Insights and Forecast - By Country/Sub-region
- 11.1.1.
- 12. Europe Continuous Testing Cloud Industry Analysis, Insights and Forecast, 2019-2031
- 12.1. Market Analysis, Insights and Forecast - By Country/Sub-region
- 12.1.1.
- 13. Asia Pacific Continuous Testing Cloud Industry Analysis, Insights and Forecast, 2019-2031
- 13.1. Market Analysis, Insights and Forecast - By Country/Sub-region
- 13.1.1.
- 14. Latin America Continuous Testing Cloud Industry Analysis, Insights and Forecast, 2019-2031
- 14.1. Market Analysis, Insights and Forecast - By Country/Sub-region
- 14.1.1.
- 15. Middle East Continuous Testing Cloud Industry Analysis, Insights and Forecast, 2019-2031
- 15.1. Market Analysis, Insights and Forecast - By Country/Sub-region
- 15.1.1.
- 16. Competitive Analysis
- 16.1. Global Market Share Analysis 2024
- 16.2. Company Profiles
- 16.2.1 EPAM Systems Inc
- 16.2.1.1. Overview
- 16.2.1.2. Products
- 16.2.1.3. SWOT Analysis
- 16.2.1.4. Recent Developments
- 16.2.1.5. Financials (Based on Availability)
- 16.2.2 IBM Corporation
- 16.2.2.1. Overview
- 16.2.2.2. Products
- 16.2.2.3. SWOT Analysis
- 16.2.2.4. Recent Developments
- 16.2.2.5. Financials (Based on Availability)
- 16.2.3 Sauce Labs Inc
- 16.2.3.1. Overview
- 16.2.3.2. Products
- 16.2.3.3. SWOT Analysis
- 16.2.3.4. Recent Developments
- 16.2.3.5. Financials (Based on Availability)
- 16.2.4 HCL Technologies Ltd
- 16.2.4.1. Overview
- 16.2.4.2. Products
- 16.2.4.3. SWOT Analysis
- 16.2.4.4. Recent Developments
- 16.2.4.5. Financials (Based on Availability)
- 16.2.5 Cognizant Technology Solutions Corp
- 16.2.5.1. Overview
- 16.2.5.2. Products
- 16.2.5.3. SWOT Analysis
- 16.2.5.4. Recent Developments
- 16.2.5.5. Financials (Based on Availability)
- 16.2.6 Cigniti Technologies Limited
- 16.2.6.1. Overview
- 16.2.6.2. Products
- 16.2.6.3. SWOT Analysis
- 16.2.6.4. Recent Developments
- 16.2.6.5. Financials (Based on Availability)
- 16.2.7 Larsen & Toubro Infotech Ltd*List Not Exhaustive
- 16.2.7.1. Overview
- 16.2.7.2. Products
- 16.2.7.3. SWOT Analysis
- 16.2.7.4. Recent Developments
- 16.2.7.5. Financials (Based on Availability)
- 16.2.8 Atos SE
- 16.2.8.1. Overview
- 16.2.8.2. Products
- 16.2.8.3. SWOT Analysis
- 16.2.8.4. Recent Developments
- 16.2.8.5. Financials (Based on Availability)
- 16.2.9 Mindtree Limited
- 16.2.9.1. Overview
- 16.2.9.2. Products
- 16.2.9.3. SWOT Analysis
- 16.2.9.4. Recent Developments
- 16.2.9.5. Financials (Based on Availability)
- 16.2.10 Tech Mahindra Limited
- 16.2.10.1. Overview
- 16.2.10.2. Products
- 16.2.10.3. SWOT Analysis
- 16.2.10.4. Recent Developments
- 16.2.10.5. Financials (Based on Availability)
- 16.2.11 Hexaware Technologies Ltd
- 16.2.11.1. Overview
- 16.2.11.2. Products
- 16.2.11.3. SWOT Analysis
- 16.2.11.4. Recent Developments
- 16.2.11.5. Financials (Based on Availability)
- 16.2.12 Broadcom Inc (CA Technologies Inc )
- 16.2.12.1. Overview
- 16.2.12.2. Products
- 16.2.12.3. SWOT Analysis
- 16.2.12.4. Recent Developments
- 16.2.12.5. Financials (Based on Availability)
- 16.2.1 EPAM Systems Inc
List of Figures
- Figure 1: Global Continuous Testing Cloud Industry Revenue Breakdown (Million, %) by Region 2024 & 2032
- Figure 2: North America Continuous Testing Cloud Industry Revenue (Million), by Country 2024 & 2032
- Figure 3: North America Continuous Testing Cloud Industry Revenue Share (%), by Country 2024 & 2032
- Figure 4: Europe Continuous Testing Cloud Industry Revenue (Million), by Country 2024 & 2032
- Figure 5: Europe Continuous Testing Cloud Industry Revenue Share (%), by Country 2024 & 2032
- Figure 6: Asia Pacific Continuous Testing Cloud Industry Revenue (Million), by Country 2024 & 2032
- Figure 7: Asia Pacific Continuous Testing Cloud Industry Revenue Share (%), by Country 2024 & 2032
- Figure 8: Latin America Continuous Testing Cloud Industry Revenue (Million), by Country 2024 & 2032
- Figure 9: Latin America Continuous Testing Cloud Industry Revenue Share (%), by Country 2024 & 2032
- Figure 10: Middle East Continuous Testing Cloud Industry Revenue (Million), by Country 2024 & 2032
- Figure 11: Middle East Continuous Testing Cloud Industry Revenue Share (%), by Country 2024 & 2032
- Figure 12: North America Continuous Testing Cloud Industry Revenue (Million), by Service 2024 & 2032
- Figure 13: North America Continuous Testing Cloud Industry Revenue Share (%), by Service 2024 & 2032
- Figure 14: North America Continuous Testing Cloud Industry Revenue (Million), by Interface 2024 & 2032
- Figure 15: North America Continuous Testing Cloud Industry Revenue Share (%), by Interface 2024 & 2032
- Figure 16: North America Continuous Testing Cloud Industry Revenue (Million), by Deployment Type 2024 & 2032
- Figure 17: North America Continuous Testing Cloud Industry Revenue Share (%), by Deployment Type 2024 & 2032
- Figure 18: North America Continuous Testing Cloud Industry Revenue (Million), by Country 2024 & 2032
- Figure 19: North America Continuous Testing Cloud Industry Revenue Share (%), by Country 2024 & 2032
- Figure 20: Europe Continuous Testing Cloud Industry Revenue (Million), by Service 2024 & 2032
- Figure 21: Europe Continuous Testing Cloud Industry Revenue Share (%), by Service 2024 & 2032
- Figure 22: Europe Continuous Testing Cloud Industry Revenue (Million), by Interface 2024 & 2032
- Figure 23: Europe Continuous Testing Cloud Industry Revenue Share (%), by Interface 2024 & 2032
- Figure 24: Europe Continuous Testing Cloud Industry Revenue (Million), by Deployment Type 2024 & 2032
- Figure 25: Europe Continuous Testing Cloud Industry Revenue Share (%), by Deployment Type 2024 & 2032
- Figure 26: Europe Continuous Testing Cloud Industry Revenue (Million), by Country 2024 & 2032
- Figure 27: Europe Continuous Testing Cloud Industry Revenue Share (%), by Country 2024 & 2032
- Figure 28: Asia Pacific Continuous Testing Cloud Industry Revenue (Million), by Service 2024 & 2032
- Figure 29: Asia Pacific Continuous Testing Cloud Industry Revenue Share (%), by Service 2024 & 2032
- Figure 30: Asia Pacific Continuous Testing Cloud Industry Revenue (Million), by Interface 2024 & 2032
- Figure 31: Asia Pacific Continuous Testing Cloud Industry Revenue Share (%), by Interface 2024 & 2032
- Figure 32: Asia Pacific Continuous Testing Cloud Industry Revenue (Million), by Deployment Type 2024 & 2032
- Figure 33: Asia Pacific Continuous Testing Cloud Industry Revenue Share (%), by Deployment Type 2024 & 2032
- Figure 34: Asia Pacific Continuous Testing Cloud Industry Revenue (Million), by Country 2024 & 2032
- Figure 35: Asia Pacific Continuous Testing Cloud Industry Revenue Share (%), by Country 2024 & 2032
- Figure 36: Latin America Continuous Testing Cloud Industry Revenue (Million), by Service 2024 & 2032
- Figure 37: Latin America Continuous Testing Cloud Industry Revenue Share (%), by Service 2024 & 2032
- Figure 38: Latin America Continuous Testing Cloud Industry Revenue (Million), by Interface 2024 & 2032
- Figure 39: Latin America Continuous Testing Cloud Industry Revenue Share (%), by Interface 2024 & 2032
- Figure 40: Latin America Continuous Testing Cloud Industry Revenue (Million), by Deployment Type 2024 & 2032
- Figure 41: Latin America Continuous Testing Cloud Industry Revenue Share (%), by Deployment Type 2024 & 2032
- Figure 42: Latin America Continuous Testing Cloud Industry Revenue (Million), by Country 2024 & 2032
- Figure 43: Latin America Continuous Testing Cloud Industry Revenue Share (%), by Country 2024 & 2032
- Figure 44: Middle East Continuous Testing Cloud Industry Revenue (Million), by Service 2024 & 2032
- Figure 45: Middle East Continuous Testing Cloud Industry Revenue Share (%), by Service 2024 & 2032
- Figure 46: Middle East Continuous Testing Cloud Industry Revenue (Million), by Interface 2024 & 2032
- Figure 47: Middle East Continuous Testing Cloud Industry Revenue Share (%), by Interface 2024 & 2032
- Figure 48: Middle East Continuous Testing Cloud Industry Revenue (Million), by Deployment Type 2024 & 2032
- Figure 49: Middle East Continuous Testing Cloud Industry Revenue Share (%), by Deployment Type 2024 & 2032
- Figure 50: Middle East Continuous Testing Cloud Industry Revenue (Million), by Country 2024 & 2032
- Figure 51: Middle East Continuous Testing Cloud Industry Revenue Share (%), by Country 2024 & 2032
List of Tables
- Table 1: Global Continuous Testing Cloud Industry Revenue Million Forecast, by Region 2019 & 2032
- Table 2: Global Continuous Testing Cloud Industry Revenue Million Forecast, by Service 2019 & 2032
- Table 3: Global Continuous Testing Cloud Industry Revenue Million Forecast, by Interface 2019 & 2032
- Table 4: Global Continuous Testing Cloud Industry Revenue Million Forecast, by Deployment Type 2019 & 2032
- Table 5: Global Continuous Testing Cloud Industry Revenue Million Forecast, by Region 2019 & 2032
- Table 6: Global Continuous Testing Cloud Industry Revenue Million Forecast, by Country 2019 & 2032
- Table 7: Continuous Testing Cloud Industry Revenue (Million) Forecast, by Application 2019 & 2032
- Table 8: Global Continuous Testing Cloud Industry Revenue Million Forecast, by Country 2019 & 2032
- Table 9: Continuous Testing Cloud Industry Revenue (Million) Forecast, by Application 2019 & 2032
- Table 10: Global Continuous Testing Cloud Industry Revenue Million Forecast, by Country 2019 & 2032
- Table 11: Continuous Testing Cloud Industry Revenue (Million) Forecast, by Application 2019 & 2032
- Table 12: Global Continuous Testing Cloud Industry Revenue Million Forecast, by Country 2019 & 2032
- Table 13: Continuous Testing Cloud Industry Revenue (Million) Forecast, by Application 2019 & 2032
- Table 14: Global Continuous Testing Cloud Industry Revenue Million Forecast, by Country 2019 & 2032
- Table 15: Continuous Testing Cloud Industry Revenue (Million) Forecast, by Application 2019 & 2032
- Table 16: Global Continuous Testing Cloud Industry Revenue Million Forecast, by Service 2019 & 2032
- Table 17: Global Continuous Testing Cloud Industry Revenue Million Forecast, by Interface 2019 & 2032
- Table 18: Global Continuous Testing Cloud Industry Revenue Million Forecast, by Deployment Type 2019 & 2032
- Table 19: Global Continuous Testing Cloud Industry Revenue Million Forecast, by Country 2019 & 2032
- Table 20: Global Continuous Testing Cloud Industry Revenue Million Forecast, by Service 2019 & 2032
- Table 21: Global Continuous Testing Cloud Industry Revenue Million Forecast, by Interface 2019 & 2032
- Table 22: Global Continuous Testing Cloud Industry Revenue Million Forecast, by Deployment Type 2019 & 2032
- Table 23: Global Continuous Testing Cloud Industry Revenue Million Forecast, by Country 2019 & 2032
- Table 24: Global Continuous Testing Cloud Industry Revenue Million Forecast, by Service 2019 & 2032
- Table 25: Global Continuous Testing Cloud Industry Revenue Million Forecast, by Interface 2019 & 2032
- Table 26: Global Continuous Testing Cloud Industry Revenue Million Forecast, by Deployment Type 2019 & 2032
- Table 27: Global Continuous Testing Cloud Industry Revenue Million Forecast, by Country 2019 & 2032
- Table 28: Global Continuous Testing Cloud Industry Revenue Million Forecast, by Service 2019 & 2032
- Table 29: Global Continuous Testing Cloud Industry Revenue Million Forecast, by Interface 2019 & 2032
- Table 30: Global Continuous Testing Cloud Industry Revenue Million Forecast, by Deployment Type 2019 & 2032
- Table 31: Global Continuous Testing Cloud Industry Revenue Million Forecast, by Country 2019 & 2032
- Table 32: Global Continuous Testing Cloud Industry Revenue Million Forecast, by Service 2019 & 2032
- Table 33: Global Continuous Testing Cloud Industry Revenue Million Forecast, by Interface 2019 & 2032
- Table 34: Global Continuous Testing Cloud Industry Revenue Million Forecast, by Deployment Type 2019 & 2032
- Table 35: Global Continuous Testing Cloud Industry Revenue Million Forecast, by Country 2019 & 2032
Frequently Asked Questions
1. What is the projected Compound Annual Growth Rate (CAGR) of the Continuous Testing Cloud Industry?
The projected CAGR is approximately 15.24%.
2. Which companies are prominent players in the Continuous Testing Cloud Industry?
Key companies in the market include EPAM Systems Inc, IBM Corporation, Sauce Labs Inc, HCL Technologies Ltd, Cognizant Technology Solutions Corp, Cigniti Technologies Limited, Larsen & Toubro Infotech Ltd*List Not Exhaustive, Atos SE, Mindtree Limited, Tech Mahindra Limited, Hexaware Technologies Ltd, Broadcom Inc (CA Technologies Inc ).
3. What are the main segments of the Continuous Testing Cloud Industry?
The market segments include Service, Interface, Deployment Type.
4. Can you provide details about the market size?
The market size is estimated to be USD XX Million as of 2022.
5. What are some drivers contributing to market growth?
Adoption of Agile and DevOps; Increasing Need for Continuous and Timely Delivery.
6. What are the notable trends driving market growth?
Cloud Based Deployment to Grow Significantly.
7. Are there any restraints impacting market growth?
Dependency on Traditional Approaches; Lack of a Skilled and Experienced Test Automation Workforce.
8. Can you provide examples of recent developments in the market?
February 2022 - Tricentis announced new strategies and solutions for helping enterprise organizations accelerate cloud adoption across their most critical business applications and data. As organizations shift to cloud-centric IT, seamless continuous testing is anticipated to become the norm alongside migration to the cloud. It has been the driving force of the launch of new solutions by Tricentis.
9. What pricing options are available for accessing the report?
Pricing options include single-user, multi-user, and enterprise licenses priced at USD 4750, USD 5250, and USD 8750 respectively.
10. Is the market size provided in terms of value or volume?
The market size is provided in terms of value, measured in Million.
11. Are there any specific market keywords associated with the report?
Yes, the market keyword associated with the report is "Continuous Testing Cloud Industry," which aids in identifying and referencing the specific market segment covered.
12. How do I determine which pricing option suits my needs best?
The pricing options vary based on user requirements and access needs. Individual users may opt for single-user licenses, while businesses requiring broader access may choose multi-user or enterprise licenses for cost-effective access to the report.
13. Are there any additional resources or data provided in the Continuous Testing Cloud Industry report?
While the report offers comprehensive insights, it's advisable to review the specific contents or supplementary materials provided to ascertain if additional resources or data are available.
14. How can I stay updated on further developments or reports in the Continuous Testing Cloud Industry?
To stay informed about further developments, trends, and reports in the Continuous Testing Cloud Industry, consider subscribing to industry newsletters, following relevant companies and organizations, or regularly checking reputable industry news sources and publications.
Methodology
Step 1 - Identification of Relevant Samples Size from Population Database


Step 2 - Approaches for Defining Global Market Size (Value, Volume* & Price*)

Note*: In applicable scenarios
Step 3 - Data Sources
Primary Research
- Web Analytics
- Survey Reports
- Research Institute
- Latest Research Reports
- Opinion Leaders
Secondary Research
- Annual Reports
- White Paper
- Latest Press Release
- Industry Association
- Paid Database
- Investor Presentations

Step 4 - Data Triangulation
Involves using different sources of information in order to increase the validity of a study
These sources are likely to be stakeholders in a program - participants, other researchers, program staff, other community members, and so on.
Then we put all data in single framework & apply various statistical tools to find out the dynamic on the market.
During the analysis stage, feedback from the stakeholder groups would be compared to determine areas of agreement as well as areas of divergence


