
Key Insights
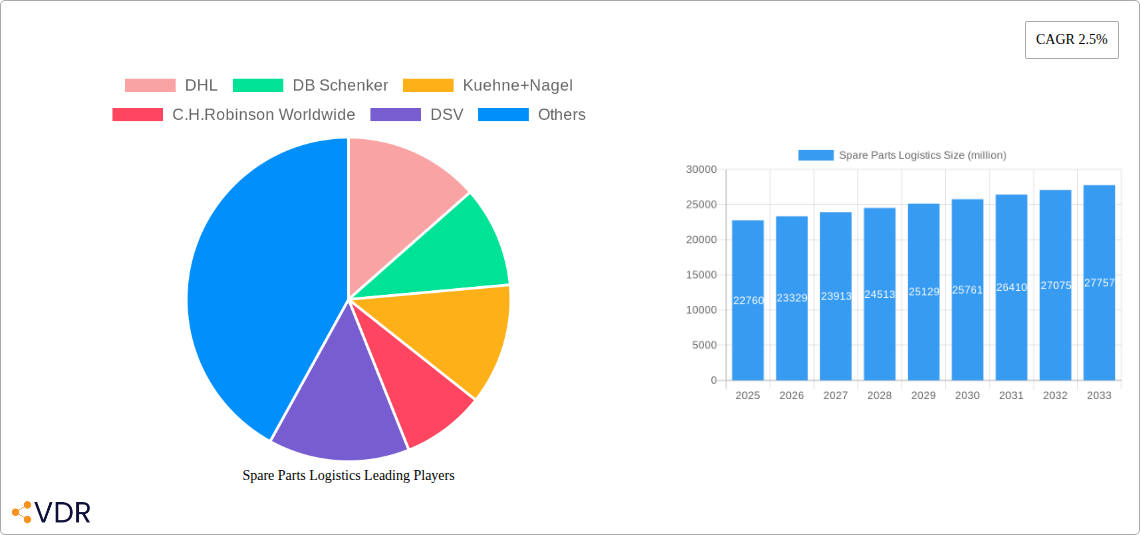
The global spare parts logistics market, valued at $22,760 million in 2025, is projected to experience steady growth, driven by the increasing complexity of modern machinery and the rising demand for efficient after-sales service. The 2.5% CAGR indicates a consistent, albeit moderate, expansion over the forecast period (2025-2033). Key drivers include the growth of e-commerce and the associated need for rapid and reliable delivery of replacement parts, the increasing adoption of advanced technologies like IoT and AI for inventory management and predictive maintenance, and the expanding global manufacturing sector requiring robust supply chains for timely part delivery. The market faces challenges such as fluctuating fuel prices, geopolitical instability impacting global trade, and the complexities of managing diverse regulatory environments across different regions. Successful players are those who can leverage technological advancements to enhance visibility and traceability throughout the supply chain, optimize warehousing and transportation networks, and build strong relationships with both manufacturers and end-users.
The competitive landscape is characterized by the presence of major global logistics providers such as DHL, DB Schenker, and Kuehne+Nagel, alongside specialized spare parts logistics companies. These companies are constantly striving to differentiate themselves through innovative solutions, such as specialized packaging and handling for sensitive components, customized inventory management systems, and value-added services like reverse logistics for faulty parts. Future growth will likely be influenced by the increasing integration of sustainable practices within the logistics industry, driven by environmental concerns and regulatory pressures. Companies that invest in eco-friendly transportation and warehousing solutions are expected to gain a competitive edge. Regional variations in market growth will likely be determined by factors such as economic development, industrial growth, and the maturity of after-sales service markets.
Spare Parts Logistics Market Report: 2019-2033
This comprehensive report provides a detailed analysis of the global spare parts logistics market, encompassing market dynamics, growth trends, regional dominance, product landscape, key players, and future outlook. The study period covers 2019-2033, with 2025 as the base and estimated year. The forecast period spans 2025-2033, and the historical period is 2019-2024. This report is essential for industry professionals, investors, and strategic decision-makers seeking actionable insights into this dynamic sector. The report covers the parent market of Logistics and the child market of Spare Parts Logistics.
The global spare parts logistics market is projected to reach xx million units by 2033, exhibiting a CAGR of xx% during the forecast period.
Spare Parts Logistics Market Dynamics & Structure
The spare parts logistics market is characterized by a moderately concentrated landscape, with key players like DHL, DB Schenker, and Kuehne+Nagel holding significant market share. Technological advancements, such as AI-powered predictive maintenance and blockchain for enhanced traceability, are driving innovation. Stringent regulatory frameworks concerning safety and compliance, coupled with the emergence of substitute solutions (e.g., 3D printing for on-demand part creation), significantly impact market dynamics. End-user demographics (e.g., manufacturing, automotive, aerospace) influence demand patterns. M&A activity has been moderate, with an estimated xx million units in deal volume during the historical period, primarily driven by expansion strategies and technology acquisitions.
- Market Concentration: High, with top 5 players holding approximately xx% market share in 2024.
- Technological Innovation: Significant, driven by AI, IoT, and blockchain. However, high implementation costs present a barrier.
- Regulatory Framework: Stringent, with compliance costs impacting smaller players.
- Competitive Product Substitutes: 3D printing and on-demand manufacturing present growing competition.
- End-User Demographics: Manufacturing and automotive sectors represent the largest end-user segments.
- M&A Trends: Moderate activity, focused on technology integration and market expansion.
Spare Parts Logistics Growth Trends & Insights
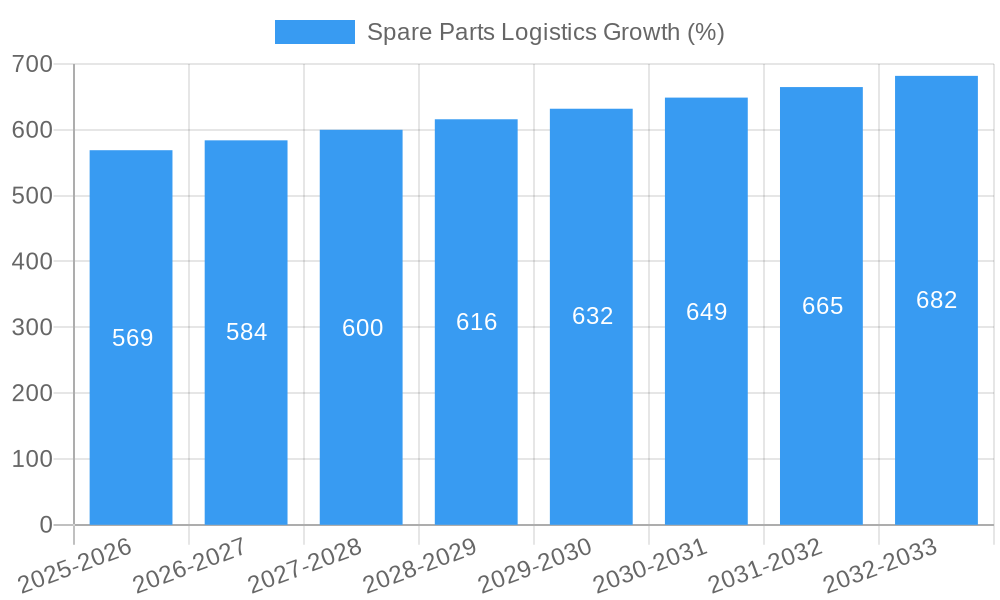
The spare parts logistics market has witnessed consistent growth driven by increasing industrial automation, globalization of supply chains, and the rising demand for efficient inventory management. The market size increased from xx million units in 2019 to xx million units in 2024, reflecting a CAGR of xx%. Technological disruptions, particularly the adoption of digital platforms for real-time tracking and predictive analytics, are transforming operational efficiency. Consumer behavior shifts toward just-in-time delivery and increased demand for transparency are further fueling market expansion. Market penetration rates in key regions are increasing, reflecting the growing adoption of specialized logistics solutions for spare parts.
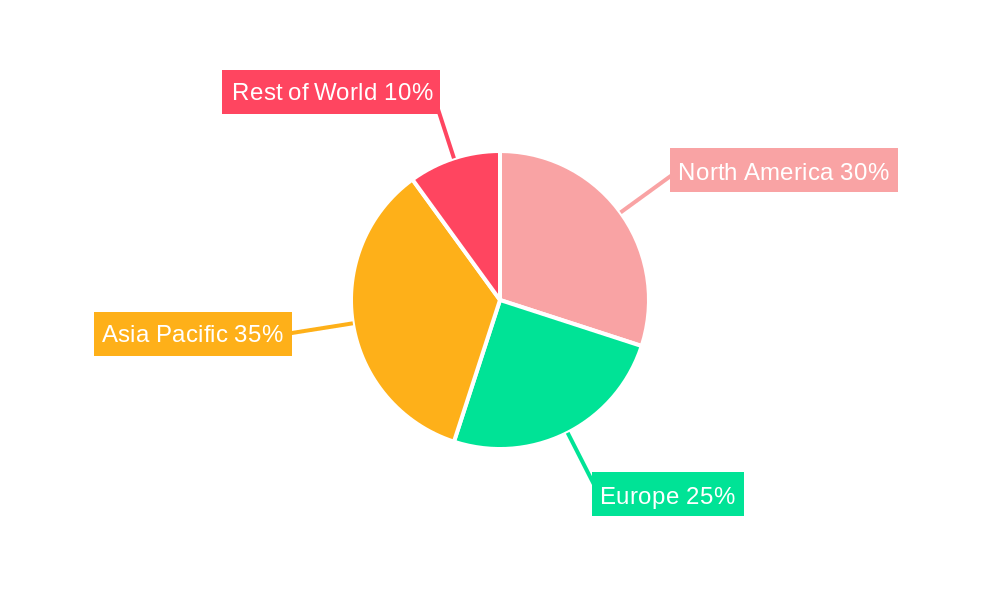
Dominant Regions, Countries, or Segments in Spare Parts Logistics
North America currently dominates the spare parts logistics market, holding approximately xx% market share in 2024, followed by Europe and Asia-Pacific. This dominance is driven by robust manufacturing sectors, developed infrastructure, and favorable regulatory environments. Specific countries like the U.S., Germany, and China exhibit particularly strong growth, fueled by factors such as:
- North America: Well-developed logistics infrastructure, high demand from automotive and aerospace industries.
- Europe: Strong manufacturing base, focus on technological advancements, and supportive government policies.
- Asia-Pacific: Rapid industrialization, increasing demand from emerging economies, and cost-effective labor.
Growth potential remains high in emerging markets, particularly within Asia-Pacific and Latin America, driven by increasing industrial activity and expanding e-commerce sectors.
Spare Parts Logistics Product Landscape
The spare parts logistics market offers a range of solutions, including specialized warehousing, tailored transportation modes (air, sea, road), and advanced technology platforms for inventory management and tracking. Product innovations focus on real-time visibility, predictive maintenance, and optimized routing algorithms to minimize downtime and improve efficiency. The unique selling propositions (USPs) revolve around speed, reliability, and cost optimization. Advancements in technology, such as AI-powered route optimization and blockchain-enabled traceability, enhance security and efficiency.
Key Drivers, Barriers & Challenges in Spare Parts Logistics
Key Drivers: Increasing global trade, rising demand for just-in-time delivery, advancements in technology (AI, IoT), and government initiatives promoting supply chain efficiency.
Key Challenges: Supply chain disruptions (e.g., geopolitical instability, natural disasters), high transportation costs, stringent regulatory compliance requirements, and intense competition from established players. These challenges lead to unpredictable delivery times and increased operational costs, potentially impacting the overall market growth by xx% by 2030.
Emerging Opportunities in Spare Parts Logistics
The growth of e-commerce, particularly in the B2B segment, presents significant opportunities for specialized spare parts logistics providers. The integration of advanced analytics and AI for predictive maintenance opens new avenues for optimizing inventory levels and reducing downtime. Furthermore, untapped markets in emerging economies and the rising adoption of sustainable and green logistics practices present substantial growth potential.
Growth Accelerators in the Spare Parts Logistics Industry
Technological advancements, strategic partnerships between logistics providers and manufacturers, and expansion into underserved markets are key growth catalysts for the spare parts logistics industry. The integration of AI and machine learning for predictive maintenance and demand forecasting will significantly enhance efficiency and optimize resource allocation. Strategic alliances and acquisitions will help companies expand their geographical reach and service portfolio.
Key Players Shaping the Spare Parts Logistics Market
- DHL
- DB Schenker
- Kuehne+Nagel
- C.H. Robinson Worldwide
- DSV
- CEVA
- UPS
- Toyota Tsusho
- Yusen Logistics
- Panalphina
- Ryder System
- Logwin
- Sinotrans
- SAIC AnJi Logistics
Notable Milestones in Spare Parts Logistics Sector
- 2020: Increased adoption of digital platforms for real-time tracking and inventory management.
- 2021: Several key players invested heavily in AI-powered predictive maintenance solutions.
- 2022: Rise of blockchain technology for enhanced traceability and security in the supply chain.
- 2023: Significant mergers and acquisitions activity to consolidate market share and expand service offerings.
In-Depth Spare Parts Logistics Market Outlook
The spare parts logistics market is poised for substantial growth over the next decade, driven by technological innovations, expanding e-commerce, and increasing industrial automation. Strategic partnerships, investments in advanced technologies, and expansion into new markets will be crucial for success. Companies that can offer integrated, end-to-end solutions with enhanced visibility and predictive capabilities will be best positioned to capitalize on the significant growth opportunities.
Spare Parts Logistics Segmentation
-
1. Application
- 1.1. Automotive
- 1.2. Aerospace
- 1.3. Datacenters
- 1.4. Medical
- 1.5. Telecoms and Utilities
- 1.6. Others
-
2. Types
- 2.1. Last Mile Delivery
- 2.2. Long Distance Transportation
Spare Parts Logistics Segmentation By Geography
-
1. North America
- 1.1. United States
- 1.2. Canada
- 1.3. Mexico
-
2. South America
- 2.1. Brazil
- 2.2. Argentina
- 2.3. Rest of South America
-
3. Europe
- 3.1. United Kingdom
- 3.2. Germany
- 3.3. France
- 3.4. Italy
- 3.5. Spain
- 3.6. Russia
- 3.7. Benelux
- 3.8. Nordics
- 3.9. Rest of Europe
-
4. Middle East & Africa
- 4.1. Turkey
- 4.2. Israel
- 4.3. GCC
- 4.4. North Africa
- 4.5. South Africa
- 4.6. Rest of Middle East & Africa
-
5. Asia Pacific
- 5.1. China
- 5.2. India
- 5.3. Japan
- 5.4. South Korea
- 5.5. ASEAN
- 5.6. Oceania
- 5.7. Rest of Asia Pacific
Spare Parts Logistics REPORT HIGHLIGHTS
| Aspects | Details |
|---|---|
| Study Period | 2019-2033 |
| Base Year | 2024 |
| Estimated Year | 2025 |
| Forecast Period | 2025-2033 |
| Historical Period | 2019-2024 |
| Growth Rate | CAGR of 2.5% from 2019-2033 |
| Segmentation |
|
Table of Contents
- 1. Introduction
- 1.1. Research Scope
- 1.2. Market Segmentation
- 1.3. Research Methodology
- 1.4. Definitions and Assumptions
- 2. Executive Summary
- 2.1. Introduction
- 3. Market Dynamics
- 3.1. Introduction
- 3.2. Market Drivers
- 3.3. Market Restrains
- 3.4. Market Trends
- 4. Market Factor Analysis
- 4.1. Porters Five Forces
- 4.2. Supply/Value Chain
- 4.3. PESTEL analysis
- 4.4. Market Entropy
- 4.5. Patent/Trademark Analysis
- 5. Global Spare Parts Logistics Analysis, Insights and Forecast, 2019-2031
- 5.1. Market Analysis, Insights and Forecast - by Application
- 5.1.1. Automotive
- 5.1.2. Aerospace
- 5.1.3. Datacenters
- 5.1.4. Medical
- 5.1.5. Telecoms and Utilities
- 5.1.6. Others
- 5.2. Market Analysis, Insights and Forecast - by Types
- 5.2.1. Last Mile Delivery
- 5.2.2. Long Distance Transportation
- 5.3. Market Analysis, Insights and Forecast - by Region
- 5.3.1. North America
- 5.3.2. South America
- 5.3.3. Europe
- 5.3.4. Middle East & Africa
- 5.3.5. Asia Pacific
- 5.1. Market Analysis, Insights and Forecast - by Application
- 6. North America Spare Parts Logistics Analysis, Insights and Forecast, 2019-2031
- 6.1. Market Analysis, Insights and Forecast - by Application
- 6.1.1. Automotive
- 6.1.2. Aerospace
- 6.1.3. Datacenters
- 6.1.4. Medical
- 6.1.5. Telecoms and Utilities
- 6.1.6. Others
- 6.2. Market Analysis, Insights and Forecast - by Types
- 6.2.1. Last Mile Delivery
- 6.2.2. Long Distance Transportation
- 6.1. Market Analysis, Insights and Forecast - by Application
- 7. South America Spare Parts Logistics Analysis, Insights and Forecast, 2019-2031
- 7.1. Market Analysis, Insights and Forecast - by Application
- 7.1.1. Automotive
- 7.1.2. Aerospace
- 7.1.3. Datacenters
- 7.1.4. Medical
- 7.1.5. Telecoms and Utilities
- 7.1.6. Others
- 7.2. Market Analysis, Insights and Forecast - by Types
- 7.2.1. Last Mile Delivery
- 7.2.2. Long Distance Transportation
- 7.1. Market Analysis, Insights and Forecast - by Application
- 8. Europe Spare Parts Logistics Analysis, Insights and Forecast, 2019-2031
- 8.1. Market Analysis, Insights and Forecast - by Application
- 8.1.1. Automotive
- 8.1.2. Aerospace
- 8.1.3. Datacenters
- 8.1.4. Medical
- 8.1.5. Telecoms and Utilities
- 8.1.6. Others
- 8.2. Market Analysis, Insights and Forecast - by Types
- 8.2.1. Last Mile Delivery
- 8.2.2. Long Distance Transportation
- 8.1. Market Analysis, Insights and Forecast - by Application
- 9. Middle East & Africa Spare Parts Logistics Analysis, Insights and Forecast, 2019-2031
- 9.1. Market Analysis, Insights and Forecast - by Application
- 9.1.1. Automotive
- 9.1.2. Aerospace
- 9.1.3. Datacenters
- 9.1.4. Medical
- 9.1.5. Telecoms and Utilities
- 9.1.6. Others
- 9.2. Market Analysis, Insights and Forecast - by Types
- 9.2.1. Last Mile Delivery
- 9.2.2. Long Distance Transportation
- 9.1. Market Analysis, Insights and Forecast - by Application
- 10. Asia Pacific Spare Parts Logistics Analysis, Insights and Forecast, 2019-2031
- 10.1. Market Analysis, Insights and Forecast - by Application
- 10.1.1. Automotive
- 10.1.2. Aerospace
- 10.1.3. Datacenters
- 10.1.4. Medical
- 10.1.5. Telecoms and Utilities
- 10.1.6. Others
- 10.2. Market Analysis, Insights and Forecast - by Types
- 10.2.1. Last Mile Delivery
- 10.2.2. Long Distance Transportation
- 10.1. Market Analysis, Insights and Forecast - by Application
- 11. Competitive Analysis
- 11.1. Global Market Share Analysis 2024
- 11.2. Company Profiles
- 11.2.1 DHL
- 11.2.1.1. Overview
- 11.2.1.2. Products
- 11.2.1.3. SWOT Analysis
- 11.2.1.4. Recent Developments
- 11.2.1.5. Financials (Based on Availability)
- 11.2.2 DB Schenker
- 11.2.2.1. Overview
- 11.2.2.2. Products
- 11.2.2.3. SWOT Analysis
- 11.2.2.4. Recent Developments
- 11.2.2.5. Financials (Based on Availability)
- 11.2.3 Kuehne+Nagel
- 11.2.3.1. Overview
- 11.2.3.2. Products
- 11.2.3.3. SWOT Analysis
- 11.2.3.4. Recent Developments
- 11.2.3.5. Financials (Based on Availability)
- 11.2.4 C.H.Robinson Worldwide
- 11.2.4.1. Overview
- 11.2.4.2. Products
- 11.2.4.3. SWOT Analysis
- 11.2.4.4. Recent Developments
- 11.2.4.5. Financials (Based on Availability)
- 11.2.5 DSV
- 11.2.5.1. Overview
- 11.2.5.2. Products
- 11.2.5.3. SWOT Analysis
- 11.2.5.4. Recent Developments
- 11.2.5.5. Financials (Based on Availability)
- 11.2.6 CEVA
- 11.2.6.1. Overview
- 11.2.6.2. Products
- 11.2.6.3. SWOT Analysis
- 11.2.6.4. Recent Developments
- 11.2.6.5. Financials (Based on Availability)
- 11.2.7 UPS
- 11.2.7.1. Overview
- 11.2.7.2. Products
- 11.2.7.3. SWOT Analysis
- 11.2.7.4. Recent Developments
- 11.2.7.5. Financials (Based on Availability)
- 11.2.8 Toyota Tsusho
- 11.2.8.1. Overview
- 11.2.8.2. Products
- 11.2.8.3. SWOT Analysis
- 11.2.8.4. Recent Developments
- 11.2.8.5. Financials (Based on Availability)
- 11.2.9 Yusen Logistics
- 11.2.9.1. Overview
- 11.2.9.2. Products
- 11.2.9.3. SWOT Analysis
- 11.2.9.4. Recent Developments
- 11.2.9.5. Financials (Based on Availability)
- 11.2.10 Panalphina
- 11.2.10.1. Overview
- 11.2.10.2. Products
- 11.2.10.3. SWOT Analysis
- 11.2.10.4. Recent Developments
- 11.2.10.5. Financials (Based on Availability)
- 11.2.11 Ryder System
- 11.2.11.1. Overview
- 11.2.11.2. Products
- 11.2.11.3. SWOT Analysis
- 11.2.11.4. Recent Developments
- 11.2.11.5. Financials (Based on Availability)
- 11.2.12 Logwin
- 11.2.12.1. Overview
- 11.2.12.2. Products
- 11.2.12.3. SWOT Analysis
- 11.2.12.4. Recent Developments
- 11.2.12.5. Financials (Based on Availability)
- 11.2.13 Sinotrans
- 11.2.13.1. Overview
- 11.2.13.2. Products
- 11.2.13.3. SWOT Analysis
- 11.2.13.4. Recent Developments
- 11.2.13.5. Financials (Based on Availability)
- 11.2.14 SAIC AnJi Logistics
- 11.2.14.1. Overview
- 11.2.14.2. Products
- 11.2.14.3. SWOT Analysis
- 11.2.14.4. Recent Developments
- 11.2.14.5. Financials (Based on Availability)
- 11.2.1 DHL
List of Figures
- Figure 1: Global Spare Parts Logistics Revenue Breakdown (million, %) by Region 2024 & 2032
- Figure 2: North America Spare Parts Logistics Revenue (million), by Application 2024 & 2032
- Figure 3: North America Spare Parts Logistics Revenue Share (%), by Application 2024 & 2032
- Figure 4: North America Spare Parts Logistics Revenue (million), by Types 2024 & 2032
- Figure 5: North America Spare Parts Logistics Revenue Share (%), by Types 2024 & 2032
- Figure 6: North America Spare Parts Logistics Revenue (million), by Country 2024 & 2032
- Figure 7: North America Spare Parts Logistics Revenue Share (%), by Country 2024 & 2032
- Figure 8: South America Spare Parts Logistics Revenue (million), by Application 2024 & 2032
- Figure 9: South America Spare Parts Logistics Revenue Share (%), by Application 2024 & 2032
- Figure 10: South America Spare Parts Logistics Revenue (million), by Types 2024 & 2032
- Figure 11: South America Spare Parts Logistics Revenue Share (%), by Types 2024 & 2032
- Figure 12: South America Spare Parts Logistics Revenue (million), by Country 2024 & 2032
- Figure 13: South America Spare Parts Logistics Revenue Share (%), by Country 2024 & 2032
- Figure 14: Europe Spare Parts Logistics Revenue (million), by Application 2024 & 2032
- Figure 15: Europe Spare Parts Logistics Revenue Share (%), by Application 2024 & 2032
- Figure 16: Europe Spare Parts Logistics Revenue (million), by Types 2024 & 2032
- Figure 17: Europe Spare Parts Logistics Revenue Share (%), by Types 2024 & 2032
- Figure 18: Europe Spare Parts Logistics Revenue (million), by Country 2024 & 2032
- Figure 19: Europe Spare Parts Logistics Revenue Share (%), by Country 2024 & 2032
- Figure 20: Middle East & Africa Spare Parts Logistics Revenue (million), by Application 2024 & 2032
- Figure 21: Middle East & Africa Spare Parts Logistics Revenue Share (%), by Application 2024 & 2032
- Figure 22: Middle East & Africa Spare Parts Logistics Revenue (million), by Types 2024 & 2032
- Figure 23: Middle East & Africa Spare Parts Logistics Revenue Share (%), by Types 2024 & 2032
- Figure 24: Middle East & Africa Spare Parts Logistics Revenue (million), by Country 2024 & 2032
- Figure 25: Middle East & Africa Spare Parts Logistics Revenue Share (%), by Country 2024 & 2032
- Figure 26: Asia Pacific Spare Parts Logistics Revenue (million), by Application 2024 & 2032
- Figure 27: Asia Pacific Spare Parts Logistics Revenue Share (%), by Application 2024 & 2032
- Figure 28: Asia Pacific Spare Parts Logistics Revenue (million), by Types 2024 & 2032
- Figure 29: Asia Pacific Spare Parts Logistics Revenue Share (%), by Types 2024 & 2032
- Figure 30: Asia Pacific Spare Parts Logistics Revenue (million), by Country 2024 & 2032
- Figure 31: Asia Pacific Spare Parts Logistics Revenue Share (%), by Country 2024 & 2032
List of Tables
- Table 1: Global Spare Parts Logistics Revenue million Forecast, by Region 2019 & 2032
- Table 2: Global Spare Parts Logistics Revenue million Forecast, by Application 2019 & 2032
- Table 3: Global Spare Parts Logistics Revenue million Forecast, by Types 2019 & 2032
- Table 4: Global Spare Parts Logistics Revenue million Forecast, by Region 2019 & 2032
- Table 5: Global Spare Parts Logistics Revenue million Forecast, by Application 2019 & 2032
- Table 6: Global Spare Parts Logistics Revenue million Forecast, by Types 2019 & 2032
- Table 7: Global Spare Parts Logistics Revenue million Forecast, by Country 2019 & 2032
- Table 8: United States Spare Parts Logistics Revenue (million) Forecast, by Application 2019 & 2032
- Table 9: Canada Spare Parts Logistics Revenue (million) Forecast, by Application 2019 & 2032
- Table 10: Mexico Spare Parts Logistics Revenue (million) Forecast, by Application 2019 & 2032
- Table 11: Global Spare Parts Logistics Revenue million Forecast, by Application 2019 & 2032
- Table 12: Global Spare Parts Logistics Revenue million Forecast, by Types 2019 & 2032
- Table 13: Global Spare Parts Logistics Revenue million Forecast, by Country 2019 & 2032
- Table 14: Brazil Spare Parts Logistics Revenue (million) Forecast, by Application 2019 & 2032
- Table 15: Argentina Spare Parts Logistics Revenue (million) Forecast, by Application 2019 & 2032
- Table 16: Rest of South America Spare Parts Logistics Revenue (million) Forecast, by Application 2019 & 2032
- Table 17: Global Spare Parts Logistics Revenue million Forecast, by Application 2019 & 2032
- Table 18: Global Spare Parts Logistics Revenue million Forecast, by Types 2019 & 2032
- Table 19: Global Spare Parts Logistics Revenue million Forecast, by Country 2019 & 2032
- Table 20: United Kingdom Spare Parts Logistics Revenue (million) Forecast, by Application 2019 & 2032
- Table 21: Germany Spare Parts Logistics Revenue (million) Forecast, by Application 2019 & 2032
- Table 22: France Spare Parts Logistics Revenue (million) Forecast, by Application 2019 & 2032
- Table 23: Italy Spare Parts Logistics Revenue (million) Forecast, by Application 2019 & 2032
- Table 24: Spain Spare Parts Logistics Revenue (million) Forecast, by Application 2019 & 2032
- Table 25: Russia Spare Parts Logistics Revenue (million) Forecast, by Application 2019 & 2032
- Table 26: Benelux Spare Parts Logistics Revenue (million) Forecast, by Application 2019 & 2032
- Table 27: Nordics Spare Parts Logistics Revenue (million) Forecast, by Application 2019 & 2032
- Table 28: Rest of Europe Spare Parts Logistics Revenue (million) Forecast, by Application 2019 & 2032
- Table 29: Global Spare Parts Logistics Revenue million Forecast, by Application 2019 & 2032
- Table 30: Global Spare Parts Logistics Revenue million Forecast, by Types 2019 & 2032
- Table 31: Global Spare Parts Logistics Revenue million Forecast, by Country 2019 & 2032
- Table 32: Turkey Spare Parts Logistics Revenue (million) Forecast, by Application 2019 & 2032
- Table 33: Israel Spare Parts Logistics Revenue (million) Forecast, by Application 2019 & 2032
- Table 34: GCC Spare Parts Logistics Revenue (million) Forecast, by Application 2019 & 2032
- Table 35: North Africa Spare Parts Logistics Revenue (million) Forecast, by Application 2019 & 2032
- Table 36: South Africa Spare Parts Logistics Revenue (million) Forecast, by Application 2019 & 2032
- Table 37: Rest of Middle East & Africa Spare Parts Logistics Revenue (million) Forecast, by Application 2019 & 2032
- Table 38: Global Spare Parts Logistics Revenue million Forecast, by Application 2019 & 2032
- Table 39: Global Spare Parts Logistics Revenue million Forecast, by Types 2019 & 2032
- Table 40: Global Spare Parts Logistics Revenue million Forecast, by Country 2019 & 2032
- Table 41: China Spare Parts Logistics Revenue (million) Forecast, by Application 2019 & 2032
- Table 42: India Spare Parts Logistics Revenue (million) Forecast, by Application 2019 & 2032
- Table 43: Japan Spare Parts Logistics Revenue (million) Forecast, by Application 2019 & 2032
- Table 44: South Korea Spare Parts Logistics Revenue (million) Forecast, by Application 2019 & 2032
- Table 45: ASEAN Spare Parts Logistics Revenue (million) Forecast, by Application 2019 & 2032
- Table 46: Oceania Spare Parts Logistics Revenue (million) Forecast, by Application 2019 & 2032
- Table 47: Rest of Asia Pacific Spare Parts Logistics Revenue (million) Forecast, by Application 2019 & 2032
Frequently Asked Questions
1. What is the projected Compound Annual Growth Rate (CAGR) of the Spare Parts Logistics?
The projected CAGR is approximately 2.5%.
2. Which companies are prominent players in the Spare Parts Logistics?
Key companies in the market include DHL, DB Schenker, Kuehne+Nagel, C.H.Robinson Worldwide, DSV, CEVA, UPS, Toyota Tsusho, Yusen Logistics, Panalphina, Ryder System, Logwin, Sinotrans, SAIC AnJi Logistics.
3. What are the main segments of the Spare Parts Logistics?
The market segments include Application, Types.
4. Can you provide details about the market size?
The market size is estimated to be USD 22760 million as of 2022.
5. What are some drivers contributing to market growth?
N/A
6. What are the notable trends driving market growth?
N/A
7. Are there any restraints impacting market growth?
N/A
8. Can you provide examples of recent developments in the market?
N/A
9. What pricing options are available for accessing the report?
Pricing options include single-user, multi-user, and enterprise licenses priced at USD 3950.00, USD 5925.00, and USD 7900.00 respectively.
10. Is the market size provided in terms of value or volume?
The market size is provided in terms of value, measured in million.
11. Are there any specific market keywords associated with the report?
Yes, the market keyword associated with the report is "Spare Parts Logistics," which aids in identifying and referencing the specific market segment covered.
12. How do I determine which pricing option suits my needs best?
The pricing options vary based on user requirements and access needs. Individual users may opt for single-user licenses, while businesses requiring broader access may choose multi-user or enterprise licenses for cost-effective access to the report.
13. Are there any additional resources or data provided in the Spare Parts Logistics report?
While the report offers comprehensive insights, it's advisable to review the specific contents or supplementary materials provided to ascertain if additional resources or data are available.
14. How can I stay updated on further developments or reports in the Spare Parts Logistics?
To stay informed about further developments, trends, and reports in the Spare Parts Logistics, consider subscribing to industry newsletters, following relevant companies and organizations, or regularly checking reputable industry news sources and publications.
Methodology
Step 1 - Identification of Relevant Samples Size from Population Database


Step 2 - Approaches for Defining Global Market Size (Value, Volume* & Price*)

Note*: In applicable scenarios
Step 3 - Data Sources
Primary Research
- Web Analytics
- Survey Reports
- Research Institute
- Latest Research Reports
- Opinion Leaders
Secondary Research
- Annual Reports
- White Paper
- Latest Press Release
- Industry Association
- Paid Database
- Investor Presentations

Step 4 - Data Triangulation
Involves using different sources of information in order to increase the validity of a study
These sources are likely to be stakeholders in a program - participants, other researchers, program staff, other community members, and so on.
Then we put all data in single framework & apply various statistical tools to find out the dynamic on the market.
During the analysis stage, feedback from the stakeholder groups would be compared to determine areas of agreement as well as areas of divergence


