


Key Insights
The Asia Pacific Positive Displacement Pumps Market is projected for significant expansion, anticipated to reach $20,721.9 million by 2025, with a Compound Annual Growth Rate (CAGR) of 5.4% from the base year. This growth is propelled by robust industrial development across sectors such as oil and gas, chemical manufacturing, and the burgeoning food & beverage and pharmaceutical industries. Increased infrastructure investments in key economies like China and India are also boosting demand for efficient pumping solutions. Furthermore, the adoption of advanced manufacturing and stricter environmental standards drives the need for high-performance positive displacement pumps offering precise fluid control and minimal leakage.

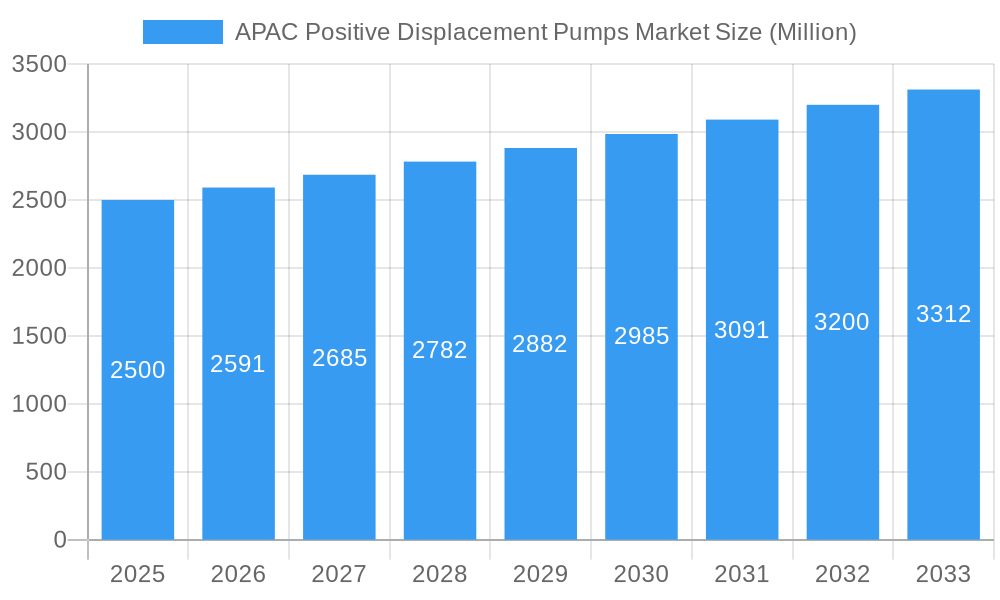
APAC Positive Displacement Pumps Market Market Size (In Billion)

Key growth drivers include the expanding petrochemical sector, the demand for sophisticated fluid transfer in pharmaceuticals, and the critical role of these pumps in wastewater treatment. While technological advancements introduce more energy-efficient and durable pump types, market restraints include the high initial cost of certain advanced technologies and the availability of alternative solutions. Nevertheless, the emphasis on operational efficiency, reduced maintenance, and enhanced safety is expected to propel the APAC Positive Displacement Pumps Market forward. Leading companies are actively pursuing product innovation and strategic expansion to leverage opportunities in this dynamic market.
APAC Positive Displacement Pumps Market Company Market Share
APAC Positive Displacement Pumps Market: Comprehensive Growth Outlook & Forecast (2019-2033)
This comprehensive report delves into the dynamic APAC Positive Displacement Pumps Market, offering an in-depth analysis of market drivers, challenges, and future trajectories. We explore the intricate market structure, technological innovations, and regulatory landscapes shaping the industry. The report provides granular insights into market size evolution, adoption rates, and consumer behavior shifts across diverse end-user industries including Oil & Gas, Chemicals, Food & Beverage, Waste & Wastewater, Pharmaceutical, and Power. With a focus on the Parent Market and its key Child Markets, this research utilizes a robust study period from 2019 to 2033, with 2025 as the base and estimated year, and a detailed forecast from 2025 to 2033. We meticulously examine pivotal market segments by Type, including Diaphragm, Piston, Gear, Lobe, Progressive Cavity, Screw, Vane, and Peristaltic pumps, quantifying their contributions and growth potential. For enhanced readability and actionable insights, all quantitative data is presented in Million units.
APAC Positive Displacement Pumps Market Market Dynamics & Structure
The APAC Positive Displacement Pumps Market exhibits a moderately concentrated structure, with a few major global players holding significant market share. Technological innovation is a primary driver, fueled by increasing demand for energy efficiency, precise fluid handling, and compliance with stringent environmental regulations. Companies are investing heavily in R&D to develop advanced pump technologies with enhanced durability, reduced maintenance requirements, and improved performance across varied applications. Regulatory frameworks, particularly concerning environmental protection and industrial safety standards across countries like China, India, and Southeast Asian nations, are increasingly influencing product design and adoption. Competitive product substitutes, while present in niche applications, are largely outmatched by the precision and reliability offered by positive displacement pumps, especially in demanding sectors. End-user demographics are shifting towards industries prioritizing automation, digitalization, and sustainable operations. Mergers and acquisitions (M&A) trends are evident as key players seek to expand their product portfolios, geographical reach, and technological capabilities. For instance, the integration of advanced digital monitoring and predictive maintenance features in pumps is a significant trend.
- Market Concentration: Moderate, with key global players dominating market share.
- Technological Innovation Drivers: Energy efficiency, precision fluid handling, environmental compliance, automation.
- Regulatory Frameworks: Strict environmental and safety standards across key APAC nations.
- Competitive Product Substitutes: Limited impact in core applications due to superior performance of PD pumps.
- End-User Demographics: Growing demand from industries adopting automation and sustainability.
- M&A Trends: Strategic acquisitions to enhance product offerings and market penetration.
APAC Positive Displacement Pumps Market Growth Trends & Insights
The APAC Positive Displacement Pumps Market is poised for robust growth over the forecast period, driven by a confluence of economic development, industrial expansion, and technological advancements across the region. The market size evolution is projected to witness a healthy Compound Annual Growth Rate (CAGR) of approximately 5.8% from 2025 to 2033, reaching an estimated xx Million units by 2033. Adoption rates for positive displacement pumps are escalating, particularly in burgeoning economies undergoing significant industrialization and infrastructure development. The Oil & Gas sector continues to be a substantial contributor, with increasing upstream and downstream activities requiring reliable and efficient pumping solutions for crude oil, refined products, and petrochemicals. Similarly, the Chemical industry is a major end-user, demanding high-precision pumps for corrosive, viscous, and hazardous fluid transfer. The Food & Beverage sector is witnessing a surge in demand for hygienic and sanitary pumps to meet stringent food safety regulations and facilitate efficient processing of diverse food products.
Technological disruptions are playing a pivotal role in shaping market dynamics. The development of smart pumps with integrated IoT capabilities for remote monitoring, diagnostics, and predictive maintenance is gaining traction. This not only enhances operational efficiency but also reduces downtime and maintenance costs. Furthermore, advancements in material science are leading to the creation of pumps with improved chemical resistance and wear durability, expanding their applicability in more challenging environments. Consumer behavior shifts are characterized by an increasing preference for solutions that offer lower total cost of ownership, higher reliability, and reduced environmental impact. Companies that can offer energy-efficient, low-emission, and digitally-enabled pumping solutions are best positioned to capitalize on these evolving demands. The Waste & Wastewater treatment sector is also a significant growth engine, with government initiatives and increased public awareness driving investments in advanced wastewater management systems, all of which rely heavily on dependable positive displacement pumps for sludge and wastewater transfer. The Pharmaceutical industry's stringent requirements for aseptic processing and precise dosing further fuel the demand for specialized positive displacement pumps, such as diaphragm and peristaltic pumps.
Dominant Regions, Countries, or Segments in APAC Positive Displacement Pumps Market
The APAC Positive Displacement Pumps Market is characterized by strong growth across various segments, with specific regions and industries emerging as dominant forces. China stands out as the leading country within the APAC region, driven by its massive industrial base, substantial investments in infrastructure development, and a burgeoning manufacturing sector across diverse industries. Its significant role in global manufacturing, coupled with ongoing modernization efforts in its Oil & Gas, Chemical, and Waste & Wastewater treatment sectors, propels the demand for a wide array of positive displacement pumps. The country's commitment to environmental regulations also necessitates advanced pumping solutions for pollution control and resource management.
In terms of end-user industries, the Oil & Gas sector remains a colossal driver of demand for positive displacement pumps in APAC. This is due to the extensive nature of exploration, extraction, refining, and transportation of hydrocarbons across countries like China, India, Indonesia, and Australia. The need for reliable and robust pumps to handle viscous crude oil, high-pressure gas, and various petrochemical products makes positive displacement pumps indispensable. The Chemical industry is another paramount segment, with APAC serving as a global hub for chemical manufacturing. The diverse range of chemicals produced, including specialty chemicals, petrochemicals, and industrial gases, requires pumps capable of handling corrosive, abrasive, and highly viscous fluids with utmost precision and safety. The Waste & Wastewater segment is experiencing exponential growth, fueled by rapid urbanization, increasing population density, and a growing emphasis on environmental sustainability and public health initiatives across the region. Governments are investing heavily in upgrading and expanding wastewater treatment facilities, creating a substantial demand for progressive cavity, diaphragm, and lobe pumps for sludge and effluent transfer.
Analyzing by pump type, Gear pumps and Progressive Cavity pumps are among the most dominant segments. Gear pumps are widely utilized in the oil and gas and chemical industries for their ability to handle a broad range of fluid viscosities and deliver consistent flow rates. Progressive cavity pumps are gaining significant traction in the waste and wastewater sector due to their exceptional ability to pump high-solids content materials, viscous sludge, and shear-sensitive media with minimal damage. The expanding applications of these pump types, coupled with their inherent advantages in specific industrial processes, solidify their dominant positions within the APAC market.
- Dominant Country: China, due to its extensive industrial base and infrastructure development.
- Leading End-User Industries: Oil & Gas, Chemicals, Waste & Wastewater.
- Key Drivers in Dominant Industries: Hydrocarbon exploration and production, diverse chemical manufacturing, urbanization and environmental initiatives.
- Dominant Pump Types: Gear Pumps, Progressive Cavity Pumps.
- Reasons for Dominance: High viscosity handling, solids-laden fluid transfer capabilities, and broad industrial applicability.
APAC Positive Displacement Pumps Market Product Landscape
The APAC Positive Displacement Pumps Market product landscape is characterized by a continuous stream of innovations aimed at enhancing efficiency, reliability, and application-specific performance. Manufacturers are focusing on developing pumps with advanced sealing technologies, improved material compositions for superior chemical and wear resistance, and intelligent control systems for optimized operation. The launch of NETZSCH's PERIPRO peristaltic pump in February 2022 exemplifies this trend, offering versatile solutions for chemical, industrial, and food applications, complementing their existing expertise in progressing cavity, multi-screw, and rotary lobe pumps. This expansion caters to growing demands for safe and precise fluid handling in sensitive environments. Products are increasingly designed for energy efficiency, reducing operational costs for end-users, and for minimal environmental impact. Applications span from high-pressure fluid injection in oilfields to delicate ingredient transfer in food processing and precise dosing in pharmaceutical manufacturing.
Key Drivers, Barriers & Challenges in APAC Positive Displacement Pumps Market
The APAC Positive Displacement Pumps Market is propelled by several key drivers. Industrial Growth and Urbanization across APAC nations fuels demand from sectors like Oil & Gas, Chemicals, and Waste & Wastewater. Technological Advancements, such as smart pumps with IoT integration and energy-efficient designs, enhance performance and adoption. Stringent Environmental Regulations necessitate advanced pumping solutions for emission control and pollution management. Furthermore, the Growing Food & Beverage and Pharmaceutical sectors, with their demand for precision and hygiene, are significant growth accelerators.
However, the market faces certain barriers and challenges. High Initial Investment Costs for advanced positive displacement pumps can be a restraint, especially for small and medium-sized enterprises. Skilled Workforce Shortage for installation, maintenance, and operation of sophisticated pumping systems can hinder widespread adoption. Supply Chain Disruptions and Volatile Raw Material Prices can impact manufacturing costs and product availability. Intense Competition from Established and Emerging Players necessitates continuous innovation and competitive pricing strategies.
Emerging Opportunities in APAC Positive Displacement Pumps Market
Emerging opportunities within the APAC Positive Displacement Pumps Market are abundant and diverse. The increasing focus on Renewable Energy Infrastructure, particularly in solar and wind power generation, is creating new demand for specialized pumps in cooling systems and maintenance operations. The growing adoption of Smart Manufacturing and Industry 4.0 initiatives is driving the need for digitally-enabled pumps with predictive maintenance capabilities and seamless integration into automated production lines. The expansion of the Water Treatment and Desalination Sector, particularly in water-scarce regions of APAC, presents a significant avenue for growth, requiring robust and efficient pumping solutions. Furthermore, the development of Advanced Materials and Biopharmaceuticals is opening up niche markets for highly specialized and hygienic positive displacement pumps, such as peristaltic and diaphragm pumps.
Growth Accelerators in the APAC Positive Displacement Pumps Market Industry
Several key factors are acting as growth accelerators for the APAC Positive Displacement Pumps Market. The Increasing Government Investments in Infrastructure Development, particularly in waste management and water treatment facilities across developing APAC economies, provides a sustained demand for pumping solutions. Technological Breakthroughs in areas like smart sensing, AI-driven diagnostics, and the development of new composite materials for pump components are enhancing product performance and opening new application possibilities. Strategic Partnerships and Collaborations between pump manufacturers and end-user industries are fostering innovation and accelerating market penetration. Moreover, the ongoing Focus on Energy Efficiency and Sustainability across all industrial sectors is driving the adoption of highly efficient positive displacement pumps, contributing to long-term market expansion.
Key Players Shaping the APAC Positive Displacement Pumps Market Market
- The Weir Group PLC
- Xylem Inc
- KSB SE & Co KGaA
- SPX Flow Inc
- NETZSCH Holding
- TSURUMI MANUFACTURING CO LTD
- Sulzer AG
- Pentair PLC
- Atlas Copco
- GRUNDFOS
Notable Milestones in APAC Positive Displacement Pumps Market Sector
- February 2022: NETZSCH Pumps and Systems announced the expansion of its product portfolio with the launch of the PERIPRO peristaltic pump, available in chemical, industrial, and food versions, complementing its established NEMO progressing cavity, NOTOS multi screw, and TORNADO rotary lobe pump technologies.
In-Depth APAC Positive Displacement Pumps Market Market Outlook
The APAC Positive Displacement Pumps Market is set for an upward trajectory, driven by sustained industrial expansion, technological innovation, and an increasing emphasis on sustainable operational practices. Growth accelerators such as government infrastructure spending, smart manufacturing adoption, and a burgeoning renewable energy sector will continue to fuel demand. Strategic opportunities lie in catering to the evolving needs of the pharmaceutical and food & beverage industries with specialized hygienic and precise pumping solutions. Manufacturers focusing on energy efficiency, digitalization, and robust after-sales support will be best positioned to capture market share and capitalize on the immense future potential of this dynamic market.
APAC Positive Displacement Pumps Market Segmentation
-
1. Type
- 1.1. Diaphragm
- 1.2. Piston
- 1.3. Gear
- 1.4. Lobe
- 1.5. Progressive Cavity
- 1.6. Screw
- 1.7. Vane
- 1.8. Peristaltic
-
2. End-user Industry
- 2.1. Oil & Gas
- 2.2. Chemicals
- 2.3. Food & Beverage
- 2.4. Waste & Wastewater
- 2.5. Pharmaceutical
- 2.6. Power
- 2.7. Other End-user Industries
APAC Positive Displacement Pumps Market Segmentation By Geography
-
1. North America
- 1.1. United States
- 1.2. Canada
- 1.3. Mexico
-
2. South America
- 2.1. Brazil
- 2.2. Argentina
- 2.3. Rest of South America
-
3. Europe
- 3.1. United Kingdom
- 3.2. Germany
- 3.3. France
- 3.4. Italy
- 3.5. Spain
- 3.6. Russia
- 3.7. Benelux
- 3.8. Nordics
- 3.9. Rest of Europe
-
4. Middle East & Africa
- 4.1. Turkey
- 4.2. Israel
- 4.3. GCC
- 4.4. North Africa
- 4.5. South Africa
- 4.6. Rest of Middle East & Africa
-
5. Asia Pacific
- 5.1. China
- 5.2. India
- 5.3. Japan
- 5.4. South Korea
- 5.5. ASEAN
- 5.6. Oceania
- 5.7. Rest of Asia Pacific

APAC Positive Displacement Pumps Market Regional Market Share
Geographic Coverage of APAC Positive Displacement Pumps Market
APAC Positive Displacement Pumps Market REPORT HIGHLIGHTS
| Aspects | Details |
|---|---|
| Study Period | 2020-2034 |
| Base Year | 2025 |
| Estimated Year | 2026 |
| Forecast Period | 2026-2034 |
| Historical Period | 2020-2025 |
| Growth Rate | CAGR of 5.4% from 2020-2034 |
| Segmentation |
|
Table of Contents
- 1. Introduction
- 1.1. Research Scope
- 1.2. Market Segmentation
- 1.3. Research Methodology
- 1.4. Definitions and Assumptions
- 2. Executive Summary
- 2.1. Introduction
- 3. Market Dynamics
- 3.1. Introduction
- 3.2. Market Drivers
- 3.2.1. Increased Focus on Wastewater Management
- 3.3. Market Restrains
- 3.3.1. Environmental and Safe Use Concerns
- 3.4. Market Trends
- 3.4.1. Waste and Wastewater Industry is Expected to Register Significant Growth
- 4. Market Factor Analysis
- 4.1. Porters Five Forces
- 4.2. Supply/Value Chain
- 4.3. PESTEL analysis
- 4.4. Market Entropy
- 4.5. Patent/Trademark Analysis
- 5. Global APAC Positive Displacement Pumps Market Analysis, Insights and Forecast, 2020-2032
- 5.1. Market Analysis, Insights and Forecast - by Type
- 5.1.1. Diaphragm
- 5.1.2. Piston
- 5.1.3. Gear
- 5.1.4. Lobe
- 5.1.5. Progressive Cavity
- 5.1.6. Screw
- 5.1.7. Vane
- 5.1.8. Peristaltic
- 5.2. Market Analysis, Insights and Forecast - by End-user Industry
- 5.2.1. Oil & Gas
- 5.2.2. Chemicals
- 5.2.3. Food & Beverage
- 5.2.4. Waste & Wastewater
- 5.2.5. Pharmaceutical
- 5.2.6. Power
- 5.2.7. Other End-user Industries
- 5.3. Market Analysis, Insights and Forecast - by Region
- 5.3.1. North America
- 5.3.2. South America
- 5.3.3. Europe
- 5.3.4. Middle East & Africa
- 5.3.5. Asia Pacific
- 5.1. Market Analysis, Insights and Forecast - by Type
- 6. North America APAC Positive Displacement Pumps Market Analysis, Insights and Forecast, 2020-2032
- 6.1. Market Analysis, Insights and Forecast - by Type
- 6.1.1. Diaphragm
- 6.1.2. Piston
- 6.1.3. Gear
- 6.1.4. Lobe
- 6.1.5. Progressive Cavity
- 6.1.6. Screw
- 6.1.7. Vane
- 6.1.8. Peristaltic
- 6.2. Market Analysis, Insights and Forecast - by End-user Industry
- 6.2.1. Oil & Gas
- 6.2.2. Chemicals
- 6.2.3. Food & Beverage
- 6.2.4. Waste & Wastewater
- 6.2.5. Pharmaceutical
- 6.2.6. Power
- 6.2.7. Other End-user Industries
- 6.1. Market Analysis, Insights and Forecast - by Type
- 7. South America APAC Positive Displacement Pumps Market Analysis, Insights and Forecast, 2020-2032
- 7.1. Market Analysis, Insights and Forecast - by Type
- 7.1.1. Diaphragm
- 7.1.2. Piston
- 7.1.3. Gear
- 7.1.4. Lobe
- 7.1.5. Progressive Cavity
- 7.1.6. Screw
- 7.1.7. Vane
- 7.1.8. Peristaltic
- 7.2. Market Analysis, Insights and Forecast - by End-user Industry
- 7.2.1. Oil & Gas
- 7.2.2. Chemicals
- 7.2.3. Food & Beverage
- 7.2.4. Waste & Wastewater
- 7.2.5. Pharmaceutical
- 7.2.6. Power
- 7.2.7. Other End-user Industries
- 7.1. Market Analysis, Insights and Forecast - by Type
- 8. Europe APAC Positive Displacement Pumps Market Analysis, Insights and Forecast, 2020-2032
- 8.1. Market Analysis, Insights and Forecast - by Type
- 8.1.1. Diaphragm
- 8.1.2. Piston
- 8.1.3. Gear
- 8.1.4. Lobe
- 8.1.5. Progressive Cavity
- 8.1.6. Screw
- 8.1.7. Vane
- 8.1.8. Peristaltic
- 8.2. Market Analysis, Insights and Forecast - by End-user Industry
- 8.2.1. Oil & Gas
- 8.2.2. Chemicals
- 8.2.3. Food & Beverage
- 8.2.4. Waste & Wastewater
- 8.2.5. Pharmaceutical
- 8.2.6. Power
- 8.2.7. Other End-user Industries
- 8.1. Market Analysis, Insights and Forecast - by Type
- 9. Middle East & Africa APAC Positive Displacement Pumps Market Analysis, Insights and Forecast, 2020-2032
- 9.1. Market Analysis, Insights and Forecast - by Type
- 9.1.1. Diaphragm
- 9.1.2. Piston
- 9.1.3. Gear
- 9.1.4. Lobe
- 9.1.5. Progressive Cavity
- 9.1.6. Screw
- 9.1.7. Vane
- 9.1.8. Peristaltic
- 9.2. Market Analysis, Insights and Forecast - by End-user Industry
- 9.2.1. Oil & Gas
- 9.2.2. Chemicals
- 9.2.3. Food & Beverage
- 9.2.4. Waste & Wastewater
- 9.2.5. Pharmaceutical
- 9.2.6. Power
- 9.2.7. Other End-user Industries
- 9.1. Market Analysis, Insights and Forecast - by Type
- 10. Asia Pacific APAC Positive Displacement Pumps Market Analysis, Insights and Forecast, 2020-2032
- 10.1. Market Analysis, Insights and Forecast - by Type
- 10.1.1. Diaphragm
- 10.1.2. Piston
- 10.1.3. Gear
- 10.1.4. Lobe
- 10.1.5. Progressive Cavity
- 10.1.6. Screw
- 10.1.7. Vane
- 10.1.8. Peristaltic
- 10.2. Market Analysis, Insights and Forecast - by End-user Industry
- 10.2.1. Oil & Gas
- 10.2.2. Chemicals
- 10.2.3. Food & Beverage
- 10.2.4. Waste & Wastewater
- 10.2.5. Pharmaceutical
- 10.2.6. Power
- 10.2.7. Other End-user Industries
- 10.1. Market Analysis, Insights and Forecast - by Type
- 11. Competitive Analysis
- 11.1. Global Market Share Analysis 2025
- 11.2. Company Profiles
- 11.2.1 The Weir Group PLC
- 11.2.1.1. Overview
- 11.2.1.2. Products
- 11.2.1.3. SWOT Analysis
- 11.2.1.4. Recent Developments
- 11.2.1.5. Financials (Based on Availability)
- 11.2.2 Xylem Inc
- 11.2.2.1. Overview
- 11.2.2.2. Products
- 11.2.2.3. SWOT Analysis
- 11.2.2.4. Recent Developments
- 11.2.2.5. Financials (Based on Availability)
- 11.2.3 KSB SE & Co KGaA
- 11.2.3.1. Overview
- 11.2.3.2. Products
- 11.2.3.3. SWOT Analysis
- 11.2.3.4. Recent Developments
- 11.2.3.5. Financials (Based on Availability)
- 11.2.4 SPX Flow Inc
- 11.2.4.1. Overview
- 11.2.4.2. Products
- 11.2.4.3. SWOT Analysis
- 11.2.4.4. Recent Developments
- 11.2.4.5. Financials (Based on Availability)
- 11.2.5 NETZSCH Holding
- 11.2.5.1. Overview
- 11.2.5.2. Products
- 11.2.5.3. SWOT Analysis
- 11.2.5.4. Recent Developments
- 11.2.5.5. Financials (Based on Availability)
- 11.2.6 TSURUMI MANUFACTURING CO LTD
- 11.2.6.1. Overview
- 11.2.6.2. Products
- 11.2.6.3. SWOT Analysis
- 11.2.6.4. Recent Developments
- 11.2.6.5. Financials (Based on Availability)
- 11.2.7 Sulzer AG
- 11.2.7.1. Overview
- 11.2.7.2. Products
- 11.2.7.3. SWOT Analysis
- 11.2.7.4. Recent Developments
- 11.2.7.5. Financials (Based on Availability)
- 11.2.8 Pentair PLC
- 11.2.8.1. Overview
- 11.2.8.2. Products
- 11.2.8.3. SWOT Analysis
- 11.2.8.4. Recent Developments
- 11.2.8.5. Financials (Based on Availability)
- 11.2.9 Atlas Copco
- 11.2.9.1. Overview
- 11.2.9.2. Products
- 11.2.9.3. SWOT Analysis
- 11.2.9.4. Recent Developments
- 11.2.9.5. Financials (Based on Availability)
- 11.2.10 GRUNDFOS
- 11.2.10.1. Overview
- 11.2.10.2. Products
- 11.2.10.3. SWOT Analysis
- 11.2.10.4. Recent Developments
- 11.2.10.5. Financials (Based on Availability)
- 11.2.1 The Weir Group PLC
List of Figures
- Figure 1: Global APAC Positive Displacement Pumps Market Revenue Breakdown (million, %) by Region 2025 & 2033
- Figure 2: Global APAC Positive Displacement Pumps Market Volume Breakdown (K Unit, %) by Region 2025 & 2033
- Figure 3: North America APAC Positive Displacement Pumps Market Revenue (million), by Type 2025 & 2033
- Figure 4: North America APAC Positive Displacement Pumps Market Volume (K Unit), by Type 2025 & 2033
- Figure 5: North America APAC Positive Displacement Pumps Market Revenue Share (%), by Type 2025 & 2033
- Figure 6: North America APAC Positive Displacement Pumps Market Volume Share (%), by Type 2025 & 2033
- Figure 7: North America APAC Positive Displacement Pumps Market Revenue (million), by End-user Industry 2025 & 2033
- Figure 8: North America APAC Positive Displacement Pumps Market Volume (K Unit), by End-user Industry 2025 & 2033
- Figure 9: North America APAC Positive Displacement Pumps Market Revenue Share (%), by End-user Industry 2025 & 2033
- Figure 10: North America APAC Positive Displacement Pumps Market Volume Share (%), by End-user Industry 2025 & 2033
- Figure 11: North America APAC Positive Displacement Pumps Market Revenue (million), by Country 2025 & 2033
- Figure 12: North America APAC Positive Displacement Pumps Market Volume (K Unit), by Country 2025 & 2033
- Figure 13: North America APAC Positive Displacement Pumps Market Revenue Share (%), by Country 2025 & 2033
- Figure 14: North America APAC Positive Displacement Pumps Market Volume Share (%), by Country 2025 & 2033
- Figure 15: South America APAC Positive Displacement Pumps Market Revenue (million), by Type 2025 & 2033
- Figure 16: South America APAC Positive Displacement Pumps Market Volume (K Unit), by Type 2025 & 2033
- Figure 17: South America APAC Positive Displacement Pumps Market Revenue Share (%), by Type 2025 & 2033
- Figure 18: South America APAC Positive Displacement Pumps Market Volume Share (%), by Type 2025 & 2033
- Figure 19: South America APAC Positive Displacement Pumps Market Revenue (million), by End-user Industry 2025 & 2033
- Figure 20: South America APAC Positive Displacement Pumps Market Volume (K Unit), by End-user Industry 2025 & 2033
- Figure 21: South America APAC Positive Displacement Pumps Market Revenue Share (%), by End-user Industry 2025 & 2033
- Figure 22: South America APAC Positive Displacement Pumps Market Volume Share (%), by End-user Industry 2025 & 2033
- Figure 23: South America APAC Positive Displacement Pumps Market Revenue (million), by Country 2025 & 2033
- Figure 24: South America APAC Positive Displacement Pumps Market Volume (K Unit), by Country 2025 & 2033
- Figure 25: South America APAC Positive Displacement Pumps Market Revenue Share (%), by Country 2025 & 2033
- Figure 26: South America APAC Positive Displacement Pumps Market Volume Share (%), by Country 2025 & 2033
- Figure 27: Europe APAC Positive Displacement Pumps Market Revenue (million), by Type 2025 & 2033
- Figure 28: Europe APAC Positive Displacement Pumps Market Volume (K Unit), by Type 2025 & 2033
- Figure 29: Europe APAC Positive Displacement Pumps Market Revenue Share (%), by Type 2025 & 2033
- Figure 30: Europe APAC Positive Displacement Pumps Market Volume Share (%), by Type 2025 & 2033
- Figure 31: Europe APAC Positive Displacement Pumps Market Revenue (million), by End-user Industry 2025 & 2033
- Figure 32: Europe APAC Positive Displacement Pumps Market Volume (K Unit), by End-user Industry 2025 & 2033
- Figure 33: Europe APAC Positive Displacement Pumps Market Revenue Share (%), by End-user Industry 2025 & 2033
- Figure 34: Europe APAC Positive Displacement Pumps Market Volume Share (%), by End-user Industry 2025 & 2033
- Figure 35: Europe APAC Positive Displacement Pumps Market Revenue (million), by Country 2025 & 2033
- Figure 36: Europe APAC Positive Displacement Pumps Market Volume (K Unit), by Country 2025 & 2033
- Figure 37: Europe APAC Positive Displacement Pumps Market Revenue Share (%), by Country 2025 & 2033
- Figure 38: Europe APAC Positive Displacement Pumps Market Volume Share (%), by Country 2025 & 2033
- Figure 39: Middle East & Africa APAC Positive Displacement Pumps Market Revenue (million), by Type 2025 & 2033
- Figure 40: Middle East & Africa APAC Positive Displacement Pumps Market Volume (K Unit), by Type 2025 & 2033
- Figure 41: Middle East & Africa APAC Positive Displacement Pumps Market Revenue Share (%), by Type 2025 & 2033
- Figure 42: Middle East & Africa APAC Positive Displacement Pumps Market Volume Share (%), by Type 2025 & 2033
- Figure 43: Middle East & Africa APAC Positive Displacement Pumps Market Revenue (million), by End-user Industry 2025 & 2033
- Figure 44: Middle East & Africa APAC Positive Displacement Pumps Market Volume (K Unit), by End-user Industry 2025 & 2033
- Figure 45: Middle East & Africa APAC Positive Displacement Pumps Market Revenue Share (%), by End-user Industry 2025 & 2033
- Figure 46: Middle East & Africa APAC Positive Displacement Pumps Market Volume Share (%), by End-user Industry 2025 & 2033
- Figure 47: Middle East & Africa APAC Positive Displacement Pumps Market Revenue (million), by Country 2025 & 2033
- Figure 48: Middle East & Africa APAC Positive Displacement Pumps Market Volume (K Unit), by Country 2025 & 2033
- Figure 49: Middle East & Africa APAC Positive Displacement Pumps Market Revenue Share (%), by Country 2025 & 2033
- Figure 50: Middle East & Africa APAC Positive Displacement Pumps Market Volume Share (%), by Country 2025 & 2033
- Figure 51: Asia Pacific APAC Positive Displacement Pumps Market Revenue (million), by Type 2025 & 2033
- Figure 52: Asia Pacific APAC Positive Displacement Pumps Market Volume (K Unit), by Type 2025 & 2033
- Figure 53: Asia Pacific APAC Positive Displacement Pumps Market Revenue Share (%), by Type 2025 & 2033
- Figure 54: Asia Pacific APAC Positive Displacement Pumps Market Volume Share (%), by Type 2025 & 2033
- Figure 55: Asia Pacific APAC Positive Displacement Pumps Market Revenue (million), by End-user Industry 2025 & 2033
- Figure 56: Asia Pacific APAC Positive Displacement Pumps Market Volume (K Unit), by End-user Industry 2025 & 2033
- Figure 57: Asia Pacific APAC Positive Displacement Pumps Market Revenue Share (%), by End-user Industry 2025 & 2033
- Figure 58: Asia Pacific APAC Positive Displacement Pumps Market Volume Share (%), by End-user Industry 2025 & 2033
- Figure 59: Asia Pacific APAC Positive Displacement Pumps Market Revenue (million), by Country 2025 & 2033
- Figure 60: Asia Pacific APAC Positive Displacement Pumps Market Volume (K Unit), by Country 2025 & 2033
- Figure 61: Asia Pacific APAC Positive Displacement Pumps Market Revenue Share (%), by Country 2025 & 2033
- Figure 62: Asia Pacific APAC Positive Displacement Pumps Market Volume Share (%), by Country 2025 & 2033
List of Tables
- Table 1: Global APAC Positive Displacement Pumps Market Revenue million Forecast, by Type 2020 & 2033
- Table 2: Global APAC Positive Displacement Pumps Market Volume K Unit Forecast, by Type 2020 & 2033
- Table 3: Global APAC Positive Displacement Pumps Market Revenue million Forecast, by End-user Industry 2020 & 2033
- Table 4: Global APAC Positive Displacement Pumps Market Volume K Unit Forecast, by End-user Industry 2020 & 2033
- Table 5: Global APAC Positive Displacement Pumps Market Revenue million Forecast, by Region 2020 & 2033
- Table 6: Global APAC Positive Displacement Pumps Market Volume K Unit Forecast, by Region 2020 & 2033
- Table 7: Global APAC Positive Displacement Pumps Market Revenue million Forecast, by Type 2020 & 2033
- Table 8: Global APAC Positive Displacement Pumps Market Volume K Unit Forecast, by Type 2020 & 2033
- Table 9: Global APAC Positive Displacement Pumps Market Revenue million Forecast, by End-user Industry 2020 & 2033
- Table 10: Global APAC Positive Displacement Pumps Market Volume K Unit Forecast, by End-user Industry 2020 & 2033
- Table 11: Global APAC Positive Displacement Pumps Market Revenue million Forecast, by Country 2020 & 2033
- Table 12: Global APAC Positive Displacement Pumps Market Volume K Unit Forecast, by Country 2020 & 2033
- Table 13: United States APAC Positive Displacement Pumps Market Revenue (million) Forecast, by Application 2020 & 2033
- Table 14: United States APAC Positive Displacement Pumps Market Volume (K Unit) Forecast, by Application 2020 & 2033
- Table 15: Canada APAC Positive Displacement Pumps Market Revenue (million) Forecast, by Application 2020 & 2033
- Table 16: Canada APAC Positive Displacement Pumps Market Volume (K Unit) Forecast, by Application 2020 & 2033
- Table 17: Mexico APAC Positive Displacement Pumps Market Revenue (million) Forecast, by Application 2020 & 2033
- Table 18: Mexico APAC Positive Displacement Pumps Market Volume (K Unit) Forecast, by Application 2020 & 2033
- Table 19: Global APAC Positive Displacement Pumps Market Revenue million Forecast, by Type 2020 & 2033
- Table 20: Global APAC Positive Displacement Pumps Market Volume K Unit Forecast, by Type 2020 & 2033
- Table 21: Global APAC Positive Displacement Pumps Market Revenue million Forecast, by End-user Industry 2020 & 2033
- Table 22: Global APAC Positive Displacement Pumps Market Volume K Unit Forecast, by End-user Industry 2020 & 2033
- Table 23: Global APAC Positive Displacement Pumps Market Revenue million Forecast, by Country 2020 & 2033
- Table 24: Global APAC Positive Displacement Pumps Market Volume K Unit Forecast, by Country 2020 & 2033
- Table 25: Brazil APAC Positive Displacement Pumps Market Revenue (million) Forecast, by Application 2020 & 2033
- Table 26: Brazil APAC Positive Displacement Pumps Market Volume (K Unit) Forecast, by Application 2020 & 2033
- Table 27: Argentina APAC Positive Displacement Pumps Market Revenue (million) Forecast, by Application 2020 & 2033
- Table 28: Argentina APAC Positive Displacement Pumps Market Volume (K Unit) Forecast, by Application 2020 & 2033
- Table 29: Rest of South America APAC Positive Displacement Pumps Market Revenue (million) Forecast, by Application 2020 & 2033
- Table 30: Rest of South America APAC Positive Displacement Pumps Market Volume (K Unit) Forecast, by Application 2020 & 2033
- Table 31: Global APAC Positive Displacement Pumps Market Revenue million Forecast, by Type 2020 & 2033
- Table 32: Global APAC Positive Displacement Pumps Market Volume K Unit Forecast, by Type 2020 & 2033
- Table 33: Global APAC Positive Displacement Pumps Market Revenue million Forecast, by End-user Industry 2020 & 2033
- Table 34: Global APAC Positive Displacement Pumps Market Volume K Unit Forecast, by End-user Industry 2020 & 2033
- Table 35: Global APAC Positive Displacement Pumps Market Revenue million Forecast, by Country 2020 & 2033
- Table 36: Global APAC Positive Displacement Pumps Market Volume K Unit Forecast, by Country 2020 & 2033
- Table 37: United Kingdom APAC Positive Displacement Pumps Market Revenue (million) Forecast, by Application 2020 & 2033
- Table 38: United Kingdom APAC Positive Displacement Pumps Market Volume (K Unit) Forecast, by Application 2020 & 2033
- Table 39: Germany APAC Positive Displacement Pumps Market Revenue (million) Forecast, by Application 2020 & 2033
- Table 40: Germany APAC Positive Displacement Pumps Market Volume (K Unit) Forecast, by Application 2020 & 2033
- Table 41: France APAC Positive Displacement Pumps Market Revenue (million) Forecast, by Application 2020 & 2033
- Table 42: France APAC Positive Displacement Pumps Market Volume (K Unit) Forecast, by Application 2020 & 2033
- Table 43: Italy APAC Positive Displacement Pumps Market Revenue (million) Forecast, by Application 2020 & 2033
- Table 44: Italy APAC Positive Displacement Pumps Market Volume (K Unit) Forecast, by Application 2020 & 2033
- Table 45: Spain APAC Positive Displacement Pumps Market Revenue (million) Forecast, by Application 2020 & 2033
- Table 46: Spain APAC Positive Displacement Pumps Market Volume (K Unit) Forecast, by Application 2020 & 2033
- Table 47: Russia APAC Positive Displacement Pumps Market Revenue (million) Forecast, by Application 2020 & 2033
- Table 48: Russia APAC Positive Displacement Pumps Market Volume (K Unit) Forecast, by Application 2020 & 2033
- Table 49: Benelux APAC Positive Displacement Pumps Market Revenue (million) Forecast, by Application 2020 & 2033
- Table 50: Benelux APAC Positive Displacement Pumps Market Volume (K Unit) Forecast, by Application 2020 & 2033
- Table 51: Nordics APAC Positive Displacement Pumps Market Revenue (million) Forecast, by Application 2020 & 2033
- Table 52: Nordics APAC Positive Displacement Pumps Market Volume (K Unit) Forecast, by Application 2020 & 2033
- Table 53: Rest of Europe APAC Positive Displacement Pumps Market Revenue (million) Forecast, by Application 2020 & 2033
- Table 54: Rest of Europe APAC Positive Displacement Pumps Market Volume (K Unit) Forecast, by Application 2020 & 2033
- Table 55: Global APAC Positive Displacement Pumps Market Revenue million Forecast, by Type 2020 & 2033
- Table 56: Global APAC Positive Displacement Pumps Market Volume K Unit Forecast, by Type 2020 & 2033
- Table 57: Global APAC Positive Displacement Pumps Market Revenue million Forecast, by End-user Industry 2020 & 2033
- Table 58: Global APAC Positive Displacement Pumps Market Volume K Unit Forecast, by End-user Industry 2020 & 2033
- Table 59: Global APAC Positive Displacement Pumps Market Revenue million Forecast, by Country 2020 & 2033
- Table 60: Global APAC Positive Displacement Pumps Market Volume K Unit Forecast, by Country 2020 & 2033
- Table 61: Turkey APAC Positive Displacement Pumps Market Revenue (million) Forecast, by Application 2020 & 2033
- Table 62: Turkey APAC Positive Displacement Pumps Market Volume (K Unit) Forecast, by Application 2020 & 2033
- Table 63: Israel APAC Positive Displacement Pumps Market Revenue (million) Forecast, by Application 2020 & 2033
- Table 64: Israel APAC Positive Displacement Pumps Market Volume (K Unit) Forecast, by Application 2020 & 2033
- Table 65: GCC APAC Positive Displacement Pumps Market Revenue (million) Forecast, by Application 2020 & 2033
- Table 66: GCC APAC Positive Displacement Pumps Market Volume (K Unit) Forecast, by Application 2020 & 2033
- Table 67: North Africa APAC Positive Displacement Pumps Market Revenue (million) Forecast, by Application 2020 & 2033
- Table 68: North Africa APAC Positive Displacement Pumps Market Volume (K Unit) Forecast, by Application 2020 & 2033
- Table 69: South Africa APAC Positive Displacement Pumps Market Revenue (million) Forecast, by Application 2020 & 2033
- Table 70: South Africa APAC Positive Displacement Pumps Market Volume (K Unit) Forecast, by Application 2020 & 2033
- Table 71: Rest of Middle East & Africa APAC Positive Displacement Pumps Market Revenue (million) Forecast, by Application 2020 & 2033
- Table 72: Rest of Middle East & Africa APAC Positive Displacement Pumps Market Volume (K Unit) Forecast, by Application 2020 & 2033
- Table 73: Global APAC Positive Displacement Pumps Market Revenue million Forecast, by Type 2020 & 2033
- Table 74: Global APAC Positive Displacement Pumps Market Volume K Unit Forecast, by Type 2020 & 2033
- Table 75: Global APAC Positive Displacement Pumps Market Revenue million Forecast, by End-user Industry 2020 & 2033
- Table 76: Global APAC Positive Displacement Pumps Market Volume K Unit Forecast, by End-user Industry 2020 & 2033
- Table 77: Global APAC Positive Displacement Pumps Market Revenue million Forecast, by Country 2020 & 2033
- Table 78: Global APAC Positive Displacement Pumps Market Volume K Unit Forecast, by Country 2020 & 2033
- Table 79: China APAC Positive Displacement Pumps Market Revenue (million) Forecast, by Application 2020 & 2033
- Table 80: China APAC Positive Displacement Pumps Market Volume (K Unit) Forecast, by Application 2020 & 2033
- Table 81: India APAC Positive Displacement Pumps Market Revenue (million) Forecast, by Application 2020 & 2033
- Table 82: India APAC Positive Displacement Pumps Market Volume (K Unit) Forecast, by Application 2020 & 2033
- Table 83: Japan APAC Positive Displacement Pumps Market Revenue (million) Forecast, by Application 2020 & 2033
- Table 84: Japan APAC Positive Displacement Pumps Market Volume (K Unit) Forecast, by Application 2020 & 2033
- Table 85: South Korea APAC Positive Displacement Pumps Market Revenue (million) Forecast, by Application 2020 & 2033
- Table 86: South Korea APAC Positive Displacement Pumps Market Volume (K Unit) Forecast, by Application 2020 & 2033
- Table 87: ASEAN APAC Positive Displacement Pumps Market Revenue (million) Forecast, by Application 2020 & 2033
- Table 88: ASEAN APAC Positive Displacement Pumps Market Volume (K Unit) Forecast, by Application 2020 & 2033
- Table 89: Oceania APAC Positive Displacement Pumps Market Revenue (million) Forecast, by Application 2020 & 2033
- Table 90: Oceania APAC Positive Displacement Pumps Market Volume (K Unit) Forecast, by Application 2020 & 2033
- Table 91: Rest of Asia Pacific APAC Positive Displacement Pumps Market Revenue (million) Forecast, by Application 2020 & 2033
- Table 92: Rest of Asia Pacific APAC Positive Displacement Pumps Market Volume (K Unit) Forecast, by Application 2020 & 2033
Frequently Asked Questions
1. What is the projected Compound Annual Growth Rate (CAGR) of the APAC Positive Displacement Pumps Market?
The projected CAGR is approximately 5.4%.
2. Which companies are prominent players in the APAC Positive Displacement Pumps Market?
Key companies in the market include The Weir Group PLC, Xylem Inc, KSB SE & Co KGaA, SPX Flow Inc, NETZSCH Holding, TSURUMI MANUFACTURING CO LTD , Sulzer AG, Pentair PLC, Atlas Copco, GRUNDFOS.
3. What are the main segments of the APAC Positive Displacement Pumps Market?
The market segments include Type, End-user Industry.
4. Can you provide details about the market size?
The market size is estimated to be USD 20721.9 million as of 2022.
5. What are some drivers contributing to market growth?
Increased Focus on Wastewater Management.
6. What are the notable trends driving market growth?
Waste and Wastewater Industry is Expected to Register Significant Growth.
7. Are there any restraints impacting market growth?
Environmental and Safe Use Concerns.
8. Can you provide examples of recent developments in the market?
February 2022 - NETZSCH Pumps and Systems announced the expansion of its product portfolio with the launch of the PERIPRO peristaltic pump. The pump model is available in chemical, industrial, and food versions. Moreover, the newly launched product complements the company's well-known technologies of NEMO progressing cavity pumps, NOTOS multi screw pumps, and TORNADO rotary lobe pumps.
9. What pricing options are available for accessing the report?
Pricing options include single-user, multi-user, and enterprise licenses priced at USD 4750, USD 4950, and USD 6800 respectively.
10. Is the market size provided in terms of value or volume?
The market size is provided in terms of value, measured in million and volume, measured in K Unit.
11. Are there any specific market keywords associated with the report?
Yes, the market keyword associated with the report is "APAC Positive Displacement Pumps Market," which aids in identifying and referencing the specific market segment covered.
12. How do I determine which pricing option suits my needs best?
The pricing options vary based on user requirements and access needs. Individual users may opt for single-user licenses, while businesses requiring broader access may choose multi-user or enterprise licenses for cost-effective access to the report.
13. Are there any additional resources or data provided in the APAC Positive Displacement Pumps Market report?
While the report offers comprehensive insights, it's advisable to review the specific contents or supplementary materials provided to ascertain if additional resources or data are available.
14. How can I stay updated on further developments or reports in the APAC Positive Displacement Pumps Market?
To stay informed about further developments, trends, and reports in the APAC Positive Displacement Pumps Market, consider subscribing to industry newsletters, following relevant companies and organizations, or regularly checking reputable industry news sources and publications.
Methodology
Step 1 - Identification of Relevant Samples Size from Population Database


Step 2 - Approaches for Defining Global Market Size (Value, Volume* & Price*)

Note*: In applicable scenarios
Step 3 - Data Sources
Primary Research
- Web Analytics
- Survey Reports
- Research Institute
- Latest Research Reports
- Opinion Leaders
Secondary Research
- Annual Reports
- White Paper
- Latest Press Release
- Industry Association
- Paid Database
- Investor Presentations

Step 4 - Data Triangulation
Involves using different sources of information in order to increase the validity of a study
These sources are likely to be stakeholders in a program - participants, other researchers, program staff, other community members, and so on.
Then we put all data in single framework & apply various statistical tools to find out the dynamic on the market.
During the analysis stage, feedback from the stakeholder groups would be compared to determine areas of agreement as well as areas of divergence