
Key Insights
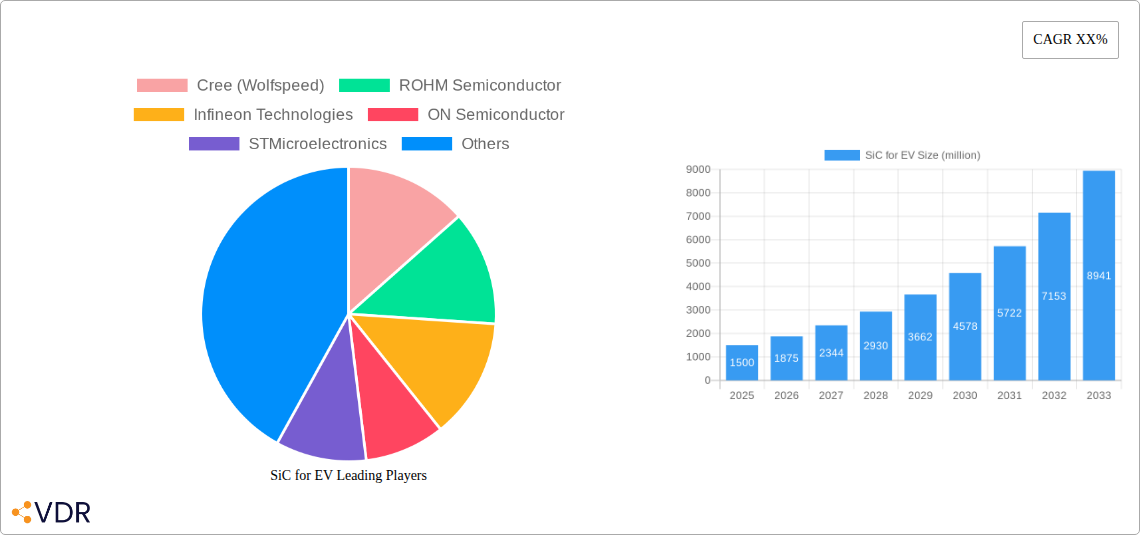
The silicon carbide (SiC) for electric vehicle (EV) market is experiencing rapid growth, driven by the increasing demand for EVs globally and the inherent advantages of SiC power semiconductors. SiC devices offer superior performance compared to traditional silicon-based components, enabling higher efficiency, faster switching speeds, and smaller size in EV powertrains – crucial for extending driving range and improving vehicle performance. The market is witnessing significant technological advancements, including the development of wider bandgap materials and improved manufacturing processes, further boosting adoption. Major players like Cree (Wolfspeed), ROHM Semiconductor, Infineon Technologies, and ON Semiconductor are investing heavily in research and development, expanding their production capacities to meet the surging demand. While the initial high cost of SiC devices remains a restraint, the long-term cost benefits associated with increased efficiency and reduced energy consumption are driving widespread adoption, particularly in high-performance EV segments. We estimate the market size in 2025 to be around $1.5 billion, with a Compound Annual Growth Rate (CAGR) of 25% projected through 2033. This strong growth is fueled by the increasing penetration of EVs in both passenger and commercial vehicle segments across major regions, including North America, Europe, and Asia-Pacific.
The segmentation within the SiC for EV market includes different power levels (e.g., onboard chargers, inverters, DC-DC converters) and applications (passenger vehicles, commercial vehicles, buses, etc.). Regional variations exist due to differences in EV adoption rates and government policies promoting electrification. Although the current market is dominated by a few key players, increased competition is expected as new entrants emerge and existing players expand their product portfolios. Continued innovation in SiC technology and the escalating demand from the burgeoning EV industry suggest a highly promising and lucrative future for this market segment. Further research and development into cost-effective manufacturing techniques will be crucial to driving broader adoption and realizing the full market potential.
SiC for EV Market Report: A Comprehensive Analysis (2019-2033)
This comprehensive report provides an in-depth analysis of the burgeoning SiC for EV market, offering invaluable insights for industry professionals, investors, and strategic decision-makers. Covering the period from 2019 to 2033, with a base year of 2025 and a forecast period of 2025-2033, this report meticulously examines market dynamics, growth trends, regional dominance, and the key players shaping this transformative sector. The report segments the market by device type and application (Parent Market: Power Semiconductors; Child Market: Electric Vehicle components), providing granular data for informed strategic planning. The total market size is projected to reach xx million units by 2033.
SiC for EV Market Dynamics & Structure
This section analyzes the competitive landscape of the SiC for EV market, exploring market concentration, technological innovation, regulatory influences, and the impact of mergers and acquisitions (M&A) activity. We delve into the interplay of various factors, examining the market share of key players and providing insights into the dynamics of the industry structure. The historical period (2019-2024) reveals a significant rise in market activity driven by increasing EV adoption and technological advances.
- Market Concentration: The market is currently moderately concentrated, with a few major players holding significant market share. Cree (Wolfspeed), Infineon, and STMicroelectronics are key players. However, several smaller, more specialized firms are also emerging. The combined market share of the top 5 players in 2024 was approximately 60%.
- Technological Innovation: Continuous advancements in SiC manufacturing and device design are major drivers, leading to improved efficiency, power density, and cost reduction.
- Regulatory Framework: Government incentives and regulations promoting EV adoption are fueling market expansion, particularly in regions with stringent emission standards.
- Competitive Substitutes: While SiC faces competition from other wide-bandgap semiconductors like GaN, its superior performance in high-power applications gives it a significant edge.
- End-User Demographics: The primary end-users are automotive manufacturers, Tier-1 suppliers, and charging infrastructure developers.
- M&A Trends: The past five years have seen a notable increase in M&A activity, with larger companies acquiring smaller, specialized SiC firms to strengthen their product portfolios and expand market reach. The total value of M&A deals in the SiC for EV segment exceeded $xx million in 2024.
SiC for EV Growth Trends & Insights
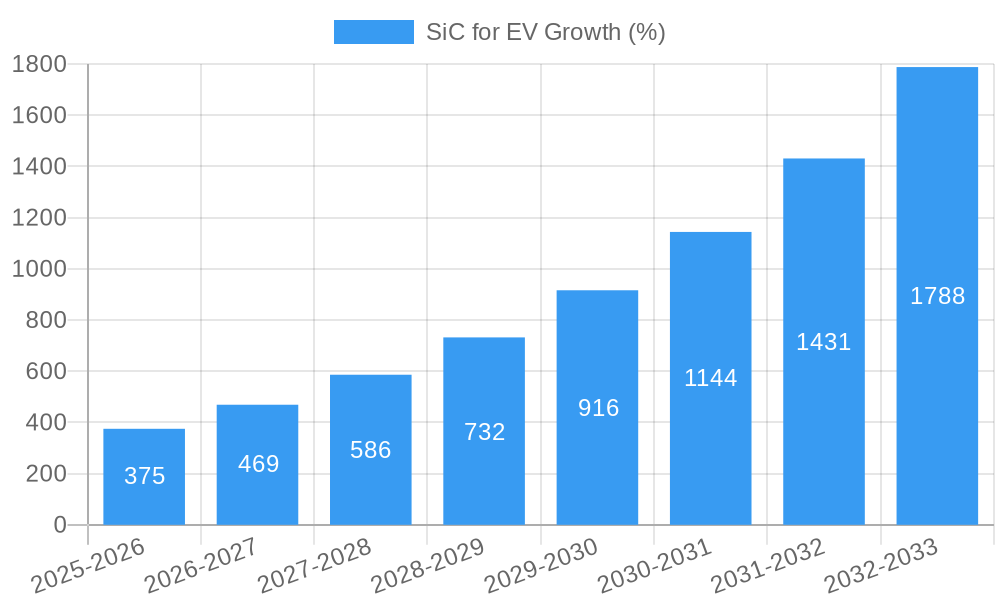
This section details the evolution of the SiC for EV market size, focusing on adoption rates, technological disruptions, and shifts in consumer preferences. We examine the Compound Annual Growth Rate (CAGR) and analyze market penetration across different regions and segments. The adoption of SiC power modules is directly correlated with electric vehicle production volumes and government policies supporting electrification.
The market experienced a CAGR of xx% during the historical period (2019-2024) and is projected to maintain a robust CAGR of xx% during the forecast period (2025-2033). Factors such as increasing demand for higher efficiency and longer range EVs are driving this growth, along with improvements in SiC device performance and cost reductions. The market penetration rate in the passenger vehicle segment is expected to reach xx% by 2033, while the commercial vehicle segment is anticipated to demonstrate even faster growth. Specific technological disruptions examined include advancements in packaging technologies and the development of high-voltage SiC devices. Consumer behavior shifts towards environmentally conscious choices and the availability of more affordable EVs are crucial factors supporting market growth.
Dominant Regions, Countries, or Segments in SiC for EV
This section identifies the leading regions and segments driving market growth, analyzing factors such as economic policies, infrastructure development, and market share. Analysis reveals that the Asia Pacific region, particularly China and Japan, is currently the leading market, followed by North America and Europe.
- Key Drivers:
- Government Policies: Strong government support for EV adoption, including subsidies, tax incentives, and emission regulations, is a major driver. China's aggressive push for electrification is a prime example.
- Infrastructure Development: Investments in charging infrastructure are crucial for EV adoption, fueling the demand for high-efficiency SiC components.
- Technological Advancements: Continuous improvements in SiC technology, coupled with falling costs, are making the technology more accessible.
- Dominance Factors: China’s massive EV market, coupled with its strong domestic SiC manufacturing base, provides a significant advantage. The presence of several key SiC manufacturers in this region, coupled with substantial government support, contributes to its market dominance. North America benefits from a strong automotive industry and advanced technological capabilities. Europe is witnessing strong growth due to its commitment to emission reduction targets. The passenger vehicle segment is the largest segment presently, although the commercial vehicle segment is expected to show rapid growth in the coming years.
SiC for EV Product Landscape
The SiC for EV market encompasses a variety of products, including MOSFETs, diodes, and integrated modules. These components are used in various EV applications such as inverters, onboard chargers (OBCs), and DC-DC converters. Significant advancements have led to improved switching speeds, lower on-resistance, and enhanced thermal management. Unique selling propositions include higher efficiency, smaller size, and increased power density compared to traditional silicon-based devices. Ongoing developments focus on optimizing cost and improving reliability for wider market adoption.
Key Drivers, Barriers & Challenges in SiC for EV
Key Drivers:
- The increasing demand for electric vehicles globally is the primary driver, pushing the need for high-efficiency power conversion components.
- Government regulations mandating reduced emissions are stimulating the adoption of SiC devices in EVs.
- Technological advancements leading to improved performance and reduced costs of SiC devices.
Key Challenges:
- The high cost of SiC wafers and the complexities of manufacturing remain a challenge, limiting widespread adoption. The overall manufacturing cost is significantly higher compared to traditional silicon devices, impacting market penetration.
- Supply chain limitations and the dependence on a limited number of key players pose risks to supply stability. A concentration of manufacturing in specific regions could lead to disruptions in supply during times of crisis.
- The industry is facing challenges in developing robust thermal management solutions for high-power applications.
Emerging Opportunities in SiC for EV
Emerging opportunities lie in the expansion into new segments like commercial vehicles and charging infrastructure. The development of more sophisticated SiC-based power modules with integrated functionalities, along with innovative applications like wireless charging and vehicle-to-grid (V2G) technology, presents significant market growth potential. Exploration of new materials and manufacturing techniques will further enhance performance and reduce costs, opening up broader market access.
Growth Accelerators in the SiC for EV Industry
Several factors are accelerating long-term growth in the SiC for EV industry. These include technological breakthroughs leading to higher power density and improved efficiency, strategic partnerships between automotive manufacturers and SiC suppliers, and expanding market access in emerging economies. Continued research and development efforts, along with government support for the industry, are pivotal in driving sustainable long-term growth.
Key Players Shaping the SiC for EV Market
- Cree (Wolfspeed)
- ROHM Semiconductor
- Infineon Technologies
- ON Semiconductor
- STMicroelectronics
- UnitedSiC
- GeneSiC Semiconductor
- Microsemi Corporation (Microchip Technology)
- Semikron International
- Littelfuse
Notable Milestones in SiC for EV Sector
- 2020: Cree (Wolfspeed) announced a significant expansion of its SiC wafer production capacity.
- 2021: Infineon Technologies launched a new generation of SiC modules for EV applications with enhanced performance.
- 2022: Several major automotive manufacturers announced partnerships with SiC suppliers to secure long-term supply agreements.
- 2023: Significant advancements in SiC packaging technology were announced, enhancing device performance and reliability.
In-Depth SiC for EV Market Outlook
The SiC for EV market is poised for substantial growth in the coming years, driven by the accelerating adoption of electric vehicles and ongoing technological advancements. The market presents significant strategic opportunities for companies involved in the development, manufacturing, and supply of SiC-based components. Strategic partnerships and continuous innovation will be crucial for companies to capitalize on the immense potential of this rapidly expanding market. The reduction in manufacturing costs and improvement in supply chain efficiency will further broaden market penetration and accelerate overall market expansion.
SiC for EV Segmentation
-
1. Application
- 1.1. BEV
- 1.2. PHEV
-
2. Types
- 2.1. SiC Power Modules
- 2.2. SiC MOSFETs
- 2.3. SiC Schottky Diodes
- 2.4. SiC Inverters
- 2.5. SiC Power Semiconductors
- 2.6. SiC Power Electronics
SiC for EV Segmentation By Geography
-
1. North America
- 1.1. United States
- 1.2. Canada
- 1.3. Mexico
-
2. South America
- 2.1. Brazil
- 2.2. Argentina
- 2.3. Rest of South America
-
3. Europe
- 3.1. United Kingdom
- 3.2. Germany
- 3.3. France
- 3.4. Italy
- 3.5. Spain
- 3.6. Russia
- 3.7. Benelux
- 3.8. Nordics
- 3.9. Rest of Europe
-
4. Middle East & Africa
- 4.1. Turkey
- 4.2. Israel
- 4.3. GCC
- 4.4. North Africa
- 4.5. South Africa
- 4.6. Rest of Middle East & Africa
-
5. Asia Pacific
- 5.1. China
- 5.2. India
- 5.3. Japan
- 5.4. South Korea
- 5.5. ASEAN
- 5.6. Oceania
- 5.7. Rest of Asia Pacific

SiC for EV REPORT HIGHLIGHTS
| Aspects | Details |
|---|---|
| Study Period | 2019-2033 |
| Base Year | 2024 |
| Estimated Year | 2025 |
| Forecast Period | 2025-2033 |
| Historical Period | 2019-2024 |
| Growth Rate | CAGR of XX% from 2019-2033 |
| Segmentation |
|
Table of Contents
- 1. Introduction
- 1.1. Research Scope
- 1.2. Market Segmentation
- 1.3. Research Methodology
- 1.4. Definitions and Assumptions
- 2. Executive Summary
- 2.1. Introduction
- 3. Market Dynamics
- 3.1. Introduction
- 3.2. Market Drivers
- 3.3. Market Restrains
- 3.4. Market Trends
- 4. Market Factor Analysis
- 4.1. Porters Five Forces
- 4.2. Supply/Value Chain
- 4.3. PESTEL analysis
- 4.4. Market Entropy
- 4.5. Patent/Trademark Analysis
- 5. Global SiC for EV Analysis, Insights and Forecast, 2019-2031
- 5.1. Market Analysis, Insights and Forecast - by Application
- 5.1.1. BEV
- 5.1.2. PHEV
- 5.2. Market Analysis, Insights and Forecast - by Types
- 5.2.1. SiC Power Modules
- 5.2.2. SiC MOSFETs
- 5.2.3. SiC Schottky Diodes
- 5.2.4. SiC Inverters
- 5.2.5. SiC Power Semiconductors
- 5.2.6. SiC Power Electronics
- 5.3. Market Analysis, Insights and Forecast - by Region
- 5.3.1. North America
- 5.3.2. South America
- 5.3.3. Europe
- 5.3.4. Middle East & Africa
- 5.3.5. Asia Pacific
- 5.1. Market Analysis, Insights and Forecast - by Application
- 6. North America SiC for EV Analysis, Insights and Forecast, 2019-2031
- 6.1. Market Analysis, Insights and Forecast - by Application
- 6.1.1. BEV
- 6.1.2. PHEV
- 6.2. Market Analysis, Insights and Forecast - by Types
- 6.2.1. SiC Power Modules
- 6.2.2. SiC MOSFETs
- 6.2.3. SiC Schottky Diodes
- 6.2.4. SiC Inverters
- 6.2.5. SiC Power Semiconductors
- 6.2.6. SiC Power Electronics
- 6.1. Market Analysis, Insights and Forecast - by Application
- 7. South America SiC for EV Analysis, Insights and Forecast, 2019-2031
- 7.1. Market Analysis, Insights and Forecast - by Application
- 7.1.1. BEV
- 7.1.2. PHEV
- 7.2. Market Analysis, Insights and Forecast - by Types
- 7.2.1. SiC Power Modules
- 7.2.2. SiC MOSFETs
- 7.2.3. SiC Schottky Diodes
- 7.2.4. SiC Inverters
- 7.2.5. SiC Power Semiconductors
- 7.2.6. SiC Power Electronics
- 7.1. Market Analysis, Insights and Forecast - by Application
- 8. Europe SiC for EV Analysis, Insights and Forecast, 2019-2031
- 8.1. Market Analysis, Insights and Forecast - by Application
- 8.1.1. BEV
- 8.1.2. PHEV
- 8.2. Market Analysis, Insights and Forecast - by Types
- 8.2.1. SiC Power Modules
- 8.2.2. SiC MOSFETs
- 8.2.3. SiC Schottky Diodes
- 8.2.4. SiC Inverters
- 8.2.5. SiC Power Semiconductors
- 8.2.6. SiC Power Electronics
- 8.1. Market Analysis, Insights and Forecast - by Application
- 9. Middle East & Africa SiC for EV Analysis, Insights and Forecast, 2019-2031
- 9.1. Market Analysis, Insights and Forecast - by Application
- 9.1.1. BEV
- 9.1.2. PHEV
- 9.2. Market Analysis, Insights and Forecast - by Types
- 9.2.1. SiC Power Modules
- 9.2.2. SiC MOSFETs
- 9.2.3. SiC Schottky Diodes
- 9.2.4. SiC Inverters
- 9.2.5. SiC Power Semiconductors
- 9.2.6. SiC Power Electronics
- 9.1. Market Analysis, Insights and Forecast - by Application
- 10. Asia Pacific SiC for EV Analysis, Insights and Forecast, 2019-2031
- 10.1. Market Analysis, Insights and Forecast - by Application
- 10.1.1. BEV
- 10.1.2. PHEV
- 10.2. Market Analysis, Insights and Forecast - by Types
- 10.2.1. SiC Power Modules
- 10.2.2. SiC MOSFETs
- 10.2.3. SiC Schottky Diodes
- 10.2.4. SiC Inverters
- 10.2.5. SiC Power Semiconductors
- 10.2.6. SiC Power Electronics
- 10.1. Market Analysis, Insights and Forecast - by Application
- 11. Competitive Analysis
- 11.1. Global Market Share Analysis 2024
- 11.2. Company Profiles
- 11.2.1 Cree (Wolfspeed)
- 11.2.1.1. Overview
- 11.2.1.2. Products
- 11.2.1.3. SWOT Analysis
- 11.2.1.4. Recent Developments
- 11.2.1.5. Financials (Based on Availability)
- 11.2.2 ROHM Semiconductor
- 11.2.2.1. Overview
- 11.2.2.2. Products
- 11.2.2.3. SWOT Analysis
- 11.2.2.4. Recent Developments
- 11.2.2.5. Financials (Based on Availability)
- 11.2.3 Infineon Technologies
- 11.2.3.1. Overview
- 11.2.3.2. Products
- 11.2.3.3. SWOT Analysis
- 11.2.3.4. Recent Developments
- 11.2.3.5. Financials (Based on Availability)
- 11.2.4 ON Semiconductor
- 11.2.4.1. Overview
- 11.2.4.2. Products
- 11.2.4.3. SWOT Analysis
- 11.2.4.4. Recent Developments
- 11.2.4.5. Financials (Based on Availability)
- 11.2.5 STMicroelectronics
- 11.2.5.1. Overview
- 11.2.5.2. Products
- 11.2.5.3. SWOT Analysis
- 11.2.5.4. Recent Developments
- 11.2.5.5. Financials (Based on Availability)
- 11.2.6 UnitedSiC
- 11.2.6.1. Overview
- 11.2.6.2. Products
- 11.2.6.3. SWOT Analysis
- 11.2.6.4. Recent Developments
- 11.2.6.5. Financials (Based on Availability)
- 11.2.7 GeneSiC Semiconductor
- 11.2.7.1. Overview
- 11.2.7.2. Products
- 11.2.7.3. SWOT Analysis
- 11.2.7.4. Recent Developments
- 11.2.7.5. Financials (Based on Availability)
- 11.2.8 Microsemi Corporation (Microchip Technology)
- 11.2.8.1. Overview
- 11.2.8.2. Products
- 11.2.8.3. SWOT Analysis
- 11.2.8.4. Recent Developments
- 11.2.8.5. Financials (Based on Availability)
- 11.2.9 Semikron International
- 11.2.9.1. Overview
- 11.2.9.2. Products
- 11.2.9.3. SWOT Analysis
- 11.2.9.4. Recent Developments
- 11.2.9.5. Financials (Based on Availability)
- 11.2.10 Littelfuse
- 11.2.10.1. Overview
- 11.2.10.2. Products
- 11.2.10.3. SWOT Analysis
- 11.2.10.4. Recent Developments
- 11.2.10.5. Financials (Based on Availability)
- 11.2.1 Cree (Wolfspeed)
List of Figures
- Figure 1: Global SiC for EV Revenue Breakdown (million, %) by Region 2024 & 2032
- Figure 2: North America SiC for EV Revenue (million), by Application 2024 & 2032
- Figure 3: North America SiC for EV Revenue Share (%), by Application 2024 & 2032
- Figure 4: North America SiC for EV Revenue (million), by Types 2024 & 2032
- Figure 5: North America SiC for EV Revenue Share (%), by Types 2024 & 2032
- Figure 6: North America SiC for EV Revenue (million), by Country 2024 & 2032
- Figure 7: North America SiC for EV Revenue Share (%), by Country 2024 & 2032
- Figure 8: South America SiC for EV Revenue (million), by Application 2024 & 2032
- Figure 9: South America SiC for EV Revenue Share (%), by Application 2024 & 2032
- Figure 10: South America SiC for EV Revenue (million), by Types 2024 & 2032
- Figure 11: South America SiC for EV Revenue Share (%), by Types 2024 & 2032
- Figure 12: South America SiC for EV Revenue (million), by Country 2024 & 2032
- Figure 13: South America SiC for EV Revenue Share (%), by Country 2024 & 2032
- Figure 14: Europe SiC for EV Revenue (million), by Application 2024 & 2032
- Figure 15: Europe SiC for EV Revenue Share (%), by Application 2024 & 2032
- Figure 16: Europe SiC for EV Revenue (million), by Types 2024 & 2032
- Figure 17: Europe SiC for EV Revenue Share (%), by Types 2024 & 2032
- Figure 18: Europe SiC for EV Revenue (million), by Country 2024 & 2032
- Figure 19: Europe SiC for EV Revenue Share (%), by Country 2024 & 2032
- Figure 20: Middle East & Africa SiC for EV Revenue (million), by Application 2024 & 2032
- Figure 21: Middle East & Africa SiC for EV Revenue Share (%), by Application 2024 & 2032
- Figure 22: Middle East & Africa SiC for EV Revenue (million), by Types 2024 & 2032
- Figure 23: Middle East & Africa SiC for EV Revenue Share (%), by Types 2024 & 2032
- Figure 24: Middle East & Africa SiC for EV Revenue (million), by Country 2024 & 2032
- Figure 25: Middle East & Africa SiC for EV Revenue Share (%), by Country 2024 & 2032
- Figure 26: Asia Pacific SiC for EV Revenue (million), by Application 2024 & 2032
- Figure 27: Asia Pacific SiC for EV Revenue Share (%), by Application 2024 & 2032
- Figure 28: Asia Pacific SiC for EV Revenue (million), by Types 2024 & 2032
- Figure 29: Asia Pacific SiC for EV Revenue Share (%), by Types 2024 & 2032
- Figure 30: Asia Pacific SiC for EV Revenue (million), by Country 2024 & 2032
- Figure 31: Asia Pacific SiC for EV Revenue Share (%), by Country 2024 & 2032
List of Tables
- Table 1: Global SiC for EV Revenue million Forecast, by Region 2019 & 2032
- Table 2: Global SiC for EV Revenue million Forecast, by Application 2019 & 2032
- Table 3: Global SiC for EV Revenue million Forecast, by Types 2019 & 2032
- Table 4: Global SiC for EV Revenue million Forecast, by Region 2019 & 2032
- Table 5: Global SiC for EV Revenue million Forecast, by Application 2019 & 2032
- Table 6: Global SiC for EV Revenue million Forecast, by Types 2019 & 2032
- Table 7: Global SiC for EV Revenue million Forecast, by Country 2019 & 2032
- Table 8: United States SiC for EV Revenue (million) Forecast, by Application 2019 & 2032
- Table 9: Canada SiC for EV Revenue (million) Forecast, by Application 2019 & 2032
- Table 10: Mexico SiC for EV Revenue (million) Forecast, by Application 2019 & 2032
- Table 11: Global SiC for EV Revenue million Forecast, by Application 2019 & 2032
- Table 12: Global SiC for EV Revenue million Forecast, by Types 2019 & 2032
- Table 13: Global SiC for EV Revenue million Forecast, by Country 2019 & 2032
- Table 14: Brazil SiC for EV Revenue (million) Forecast, by Application 2019 & 2032
- Table 15: Argentina SiC for EV Revenue (million) Forecast, by Application 2019 & 2032
- Table 16: Rest of South America SiC for EV Revenue (million) Forecast, by Application 2019 & 2032
- Table 17: Global SiC for EV Revenue million Forecast, by Application 2019 & 2032
- Table 18: Global SiC for EV Revenue million Forecast, by Types 2019 & 2032
- Table 19: Global SiC for EV Revenue million Forecast, by Country 2019 & 2032
- Table 20: United Kingdom SiC for EV Revenue (million) Forecast, by Application 2019 & 2032
- Table 21: Germany SiC for EV Revenue (million) Forecast, by Application 2019 & 2032
- Table 22: France SiC for EV Revenue (million) Forecast, by Application 2019 & 2032
- Table 23: Italy SiC for EV Revenue (million) Forecast, by Application 2019 & 2032
- Table 24: Spain SiC for EV Revenue (million) Forecast, by Application 2019 & 2032
- Table 25: Russia SiC for EV Revenue (million) Forecast, by Application 2019 & 2032
- Table 26: Benelux SiC for EV Revenue (million) Forecast, by Application 2019 & 2032
- Table 27: Nordics SiC for EV Revenue (million) Forecast, by Application 2019 & 2032
- Table 28: Rest of Europe SiC for EV Revenue (million) Forecast, by Application 2019 & 2032
- Table 29: Global SiC for EV Revenue million Forecast, by Application 2019 & 2032
- Table 30: Global SiC for EV Revenue million Forecast, by Types 2019 & 2032
- Table 31: Global SiC for EV Revenue million Forecast, by Country 2019 & 2032
- Table 32: Turkey SiC for EV Revenue (million) Forecast, by Application 2019 & 2032
- Table 33: Israel SiC for EV Revenue (million) Forecast, by Application 2019 & 2032
- Table 34: GCC SiC for EV Revenue (million) Forecast, by Application 2019 & 2032
- Table 35: North Africa SiC for EV Revenue (million) Forecast, by Application 2019 & 2032
- Table 36: South Africa SiC for EV Revenue (million) Forecast, by Application 2019 & 2032
- Table 37: Rest of Middle East & Africa SiC for EV Revenue (million) Forecast, by Application 2019 & 2032
- Table 38: Global SiC for EV Revenue million Forecast, by Application 2019 & 2032
- Table 39: Global SiC for EV Revenue million Forecast, by Types 2019 & 2032
- Table 40: Global SiC for EV Revenue million Forecast, by Country 2019 & 2032
- Table 41: China SiC for EV Revenue (million) Forecast, by Application 2019 & 2032
- Table 42: India SiC for EV Revenue (million) Forecast, by Application 2019 & 2032
- Table 43: Japan SiC for EV Revenue (million) Forecast, by Application 2019 & 2032
- Table 44: South Korea SiC for EV Revenue (million) Forecast, by Application 2019 & 2032
- Table 45: ASEAN SiC for EV Revenue (million) Forecast, by Application 2019 & 2032
- Table 46: Oceania SiC for EV Revenue (million) Forecast, by Application 2019 & 2032
- Table 47: Rest of Asia Pacific SiC for EV Revenue (million) Forecast, by Application 2019 & 2032
Frequently Asked Questions
1. What is the projected Compound Annual Growth Rate (CAGR) of the SiC for EV?
The projected CAGR is approximately XX%.
2. Which companies are prominent players in the SiC for EV?
Key companies in the market include Cree (Wolfspeed), ROHM Semiconductor, Infineon Technologies, ON Semiconductor, STMicroelectronics, UnitedSiC, GeneSiC Semiconductor, Microsemi Corporation (Microchip Technology), Semikron International, Littelfuse.
3. What are the main segments of the SiC for EV?
The market segments include Application, Types.
4. Can you provide details about the market size?
The market size is estimated to be USD XXX million as of 2022.
5. What are some drivers contributing to market growth?
N/A
6. What are the notable trends driving market growth?
N/A
7. Are there any restraints impacting market growth?
N/A
8. Can you provide examples of recent developments in the market?
N/A
9. What pricing options are available for accessing the report?
Pricing options include single-user, multi-user, and enterprise licenses priced at USD 4900.00, USD 7350.00, and USD 9800.00 respectively.
10. Is the market size provided in terms of value or volume?
The market size is provided in terms of value, measured in million.
11. Are there any specific market keywords associated with the report?
Yes, the market keyword associated with the report is "SiC for EV," which aids in identifying and referencing the specific market segment covered.
12. How do I determine which pricing option suits my needs best?
The pricing options vary based on user requirements and access needs. Individual users may opt for single-user licenses, while businesses requiring broader access may choose multi-user or enterprise licenses for cost-effective access to the report.
13. Are there any additional resources or data provided in the SiC for EV report?
While the report offers comprehensive insights, it's advisable to review the specific contents or supplementary materials provided to ascertain if additional resources or data are available.
14. How can I stay updated on further developments or reports in the SiC for EV?
To stay informed about further developments, trends, and reports in the SiC for EV, consider subscribing to industry newsletters, following relevant companies and organizations, or regularly checking reputable industry news sources and publications.
Methodology
Step 1 - Identification of Relevant Samples Size from Population Database


Step 2 - Approaches for Defining Global Market Size (Value, Volume* & Price*)

Note*: In applicable scenarios
Step 3 - Data Sources
Primary Research
- Web Analytics
- Survey Reports
- Research Institute
- Latest Research Reports
- Opinion Leaders
Secondary Research
- Annual Reports
- White Paper
- Latest Press Release
- Industry Association
- Paid Database
- Investor Presentations

Step 4 - Data Triangulation
Involves using different sources of information in order to increase the validity of a study
These sources are likely to be stakeholders in a program - participants, other researchers, program staff, other community members, and so on.
Then we put all data in single framework & apply various statistical tools to find out the dynamic on the market.
During the analysis stage, feedback from the stakeholder groups would be compared to determine areas of agreement as well as areas of divergence


