
Key Insights
The Narrow Band Internet of Things (NB-IoT) market is experiencing robust growth, driven by the increasing demand for low-power, wide-area network (LPWAN) connectivity solutions. This demand stems from various sectors including smart agriculture, smart metering, asset tracking, and environmental monitoring, all of which benefit from NB-IoT's long battery life, deep indoor penetration, and cost-effectiveness. The market's Compound Annual Growth Rate (CAGR) is estimated to be around 25% for the forecast period of 2025-2033, indicating significant expansion. Key players like Huawei, Nokia, Ericsson, and Qualcomm are heavily invested in developing and deploying NB-IoT infrastructure, fueling competition and innovation. Regional variations in market penetration exist, with mature markets like North America and Europe witnessing steady growth, while emerging economies in Asia and Africa demonstrate potentially explosive growth trajectories due to rapid infrastructure development and increasing digital adoption. However, challenges remain, including interoperability issues across different NB-IoT networks and the need for robust security measures to address potential vulnerabilities. Overall, the market presents substantial opportunities for businesses involved in network infrastructure, device manufacturing, and application development, promising significant returns in the coming years.
The continued expansion of the NB-IoT market is predicated on several converging factors. Firstly, the decreasing cost of NB-IoT modules and devices makes them increasingly accessible for diverse applications. Secondly, evolving regulations and government initiatives focused on smart city development and digital transformation are incentivizing widespread NB-IoT deployment. Thirdly, the rising adoption of 5G technology is creating synergistic opportunities, with NB-IoT often complementing 5G networks to provide broader, cost-effective connectivity solutions. While competitive pressures and potential technological disruptions pose certain risks, the long-term outlook for the NB-IoT market remains exceptionally positive, indicating a substantial market value exceeding $10 billion by 2033. The focus on enhancing security protocols and achieving greater network interoperability will be crucial in maximizing the market's potential and ensuring its long-term sustainability.
Narrow Band Internet of Things (NB-IoT) Market Report: 2019-2033
This comprehensive report provides an in-depth analysis of the Narrow Band Internet of Things (NB-IoT) market, encompassing market dynamics, growth trends, regional dominance, product landscape, key players, and future outlook. The report covers the period from 2019 to 2033, with a focus on the forecast period of 2025-2033 and a base year of 2025. The parent market is the Internet of Things (IoT), and the child market is specifically Narrow Band IoT. This report is crucial for industry professionals, investors, and strategic decision-makers seeking a detailed understanding of this rapidly evolving sector. The global market size in 2025 is estimated at xx million units.
Narrow Band Internet Of Things (NB-IoT) Market Dynamics & Structure
This section analyzes the competitive landscape, technological advancements, regulatory influences, and market forces shaping the NB-IoT market. The global market is characterized by a moderately concentrated structure with key players holding significant market share. The market size in 2025 is estimated at xx million units.
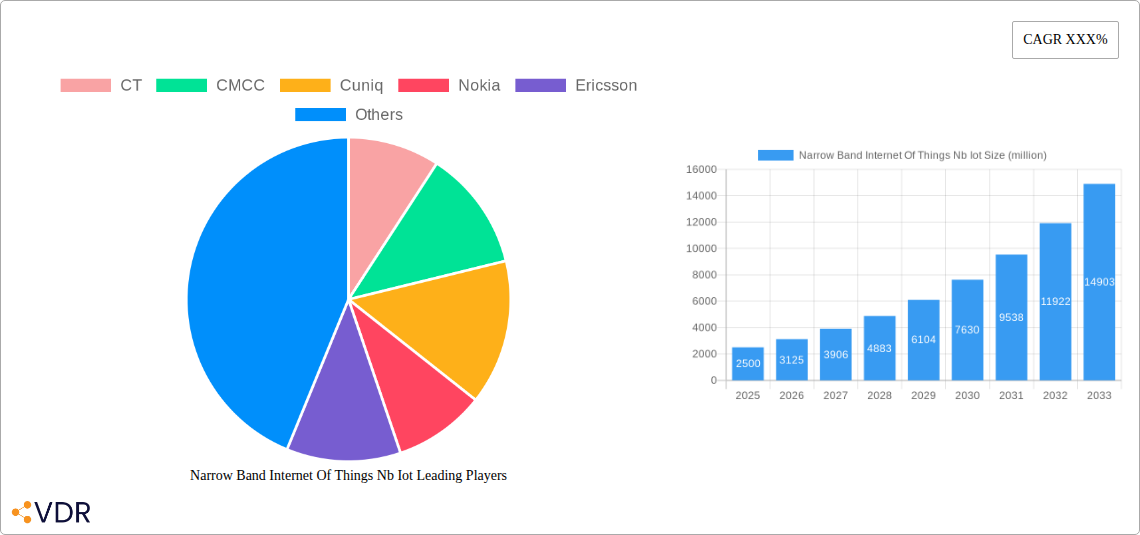
- Market Concentration: The top 5 players (CT, CMCC, Huawei, Nokia, and Ericsson) account for approximately xx% of the market share in 2025.
- Technological Innovation: Ongoing advancements in low-power wide-area network (LPWAN) technologies, improved chipsets, and enhanced security protocols are driving market growth.
- Regulatory Frameworks: Government initiatives promoting IoT adoption and spectrum allocation policies significantly influence market expansion. Variability in regulations across regions presents both opportunities and challenges.
- Competitive Substitutes: Other LPWAN technologies like LoRaWAN compete with NB-IoT, creating a dynamic competitive environment.
- End-User Demographics: The primary end-users are across diverse sectors including smart metering, asset tracking, agriculture, and environmental monitoring. The increasing adoption of smart city initiatives is a key driver of demand.
- M&A Trends: A moderate number of mergers and acquisitions (M&A) are observed (xx deals in 2024), primarily focused on strengthening technological capabilities and expanding market reach.
Narrow Band Internet Of Things (NB-IoT) Growth Trends & Insights
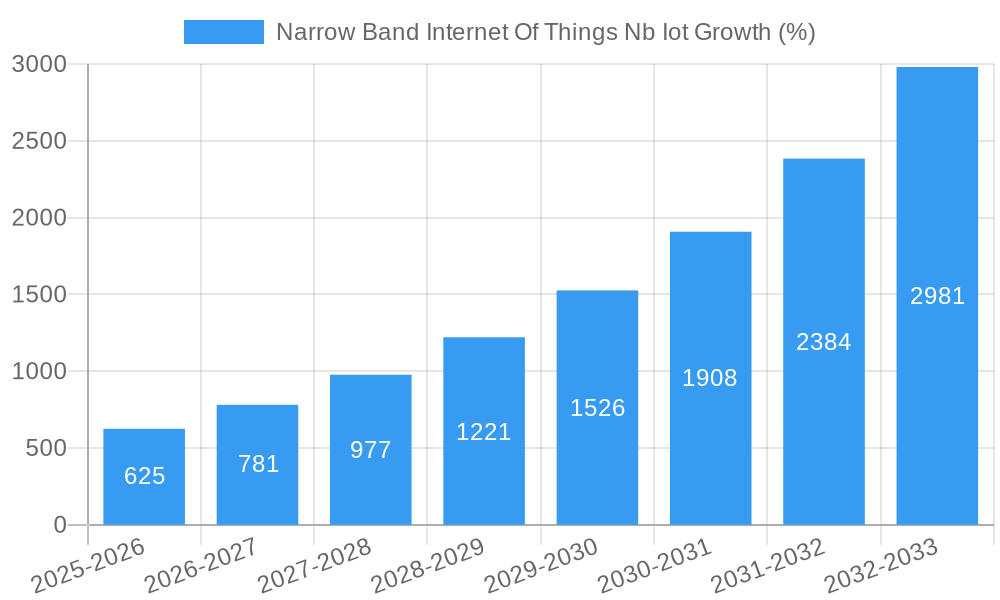
This section details the historical and projected growth trajectory of the NB-IoT market, analyzing factors influencing adoption rates and technological disruptions. The Compound Annual Growth Rate (CAGR) from 2025 to 2033 is projected at xx%. Market penetration is estimated to reach xx% by 2033. The global market size is expected to reach xx million units by 2033.
[Insert 600-word analysis of market size evolution, adoption rates, technological disruptions, and consumer behavior shifts, including specific metrics (e.g., CAGR, market penetration) for deeper insights.]
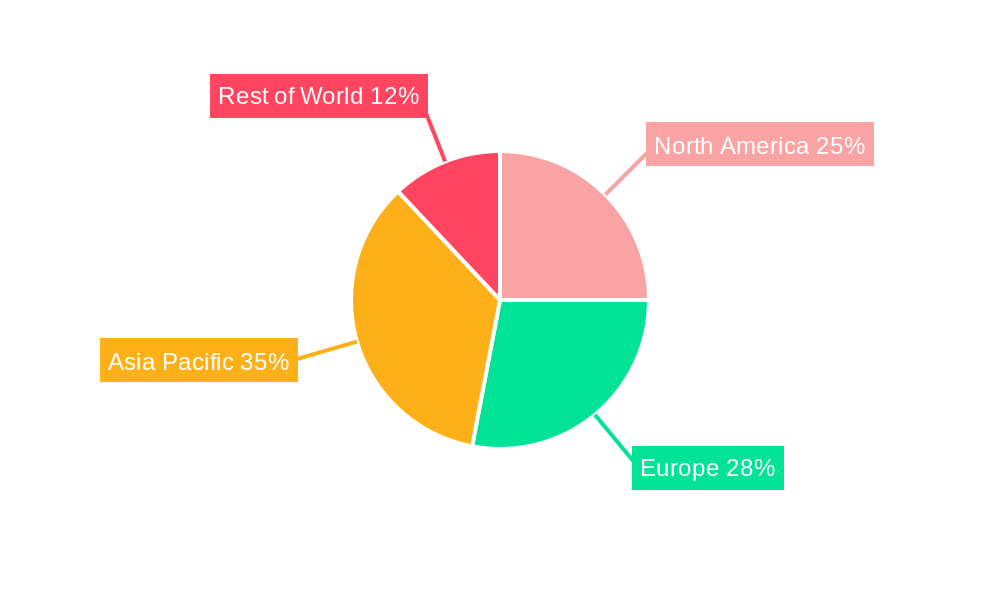
Dominant Regions, Countries, or Segments in Narrow Band Internet Of Things (NB-IoT)
This section identifies the leading geographical regions and market segments driving NB-IoT growth. Asia-Pacific is projected to be the dominant region, driven by robust infrastructure development and increasing government investments in smart city projects.
- Key Drivers in Asia-Pacific:
- Massive investments in infrastructure development.
- High adoption rates in smart city initiatives.
- Favorable government policies supporting IoT adoption.
- Large and growing consumer base.
[Insert 400 words analyzing dominance factors, including market share and growth potential for Asia-Pacific and other key regions, using paragraphs and bullet points to highlight key drivers and factors.]
Narrow Band Internet Of Things (NB-IoT) Product Landscape
The NB-IoT product landscape is characterized by a range of modules, chipsets, and gateways catering to diverse applications. Key product innovations focus on enhancing power efficiency, improving connectivity range, and increasing data security. The integration of AI and machine learning capabilities into NB-IoT devices is emerging as a key trend.
[Insert 100-150 words detailing product innovations, applications, and performance metrics, highlighting unique selling propositions and technological advancements.]
Key Drivers, Barriers & Challenges in Narrow Band Internet Of Things (NB-IoT)
Key Drivers:
- Increasing demand for connected devices across various sectors.
- Cost-effectiveness compared to other connectivity technologies.
- Growing adoption of smart city initiatives and industrial automation.
[Insert 150 words detailing primary forces propelling the market.]
Challenges and Restraints:
- Interoperability issues across different NB-IoT networks.
- Security concerns related to data breaches and network vulnerabilities.
- Limited deployment in remote and underserved areas.
[Insert 150 words analyzing key challenges and restraints, addressing supply chain issues, regulatory hurdles, and competitive pressures with quantifiable impacts (e.g., xx% impact on deployment costs).]
Emerging Opportunities in Narrow Band Internet Of Things (NB-IoT)
Emerging opportunities lie in the expansion of NB-IoT applications into untapped sectors, such as precision agriculture, smart healthcare, and environmental monitoring. The integration of NB-IoT with other technologies like AI and edge computing creates further opportunities for innovation. Growing demand for low-cost, long-range connectivity fuels further expansion.
[Insert 150 words highlighting emerging trends and opportunities.]
Growth Accelerators in the Narrow Band Internet Of Things (NB-IoT) Industry
The long-term growth of the NB-IoT market will be propelled by technological advancements (e.g., 5G integration), strategic partnerships between telecom operators and device manufacturers, and continued expansion into new geographic markets. Government regulations incentivizing IoT adoption will also play a significant role in market acceleration.
[Insert 150 words discussing catalysts driving long-term growth.]
Key Players Shaping the Narrow Band Internet Of Things (NB-IoT) Market
Notable Milestones in Narrow Band Internet Of Things (NB-IoT) Sector
- 2020: Significant increase in NB-IoT deployments globally.
- 2021: Several key partnerships between telecom operators and device manufacturers.
- 2022: Launch of several new NB-IoT-enabled products across various industry sectors.
- 2023: Significant regulatory developments in various countries.
- 2024: xx M&A deals.
[Add more milestones with specific dates and impactful details.]
In-Depth Narrow Band Internet Of Things (NB-IoT) Market Outlook
The NB-IoT market is poised for significant growth in the coming years, driven by the increasing demand for connected devices and the expanding deployment of 5G networks. Strategic partnerships, technological innovations, and favorable regulatory environments will further fuel market expansion. This presents substantial opportunities for businesses to capitalize on the increasing adoption of NB-IoT technology across various sectors. The market will experience steady growth with potential for disruption from new technologies.
[Insert 150 words summarizing growth accelerators and focusing on future market potential and strategic opportunities.]
Narrow Band Internet Of Things Nb Iot Segmentation
-
1. Application
- 1.1. Smart Agriculture
- 1.2. Asset Tracking
- 1.3. Other
-
2. Type
- 2.1. CP Mode
- 2.2. UP Mode
Narrow Band Internet Of Things Nb Iot Segmentation By Geography
-
1. North America
- 1.1. United States
- 1.2. Canada
- 1.3. Mexico
-
2. South America
- 2.1. Brazil
- 2.2. Argentina
- 2.3. Rest of South America
-
3. Europe
- 3.1. United Kingdom
- 3.2. Germany
- 3.3. France
- 3.4. Italy
- 3.5. Spain
- 3.6. Russia
- 3.7. Benelux
- 3.8. Nordics
- 3.9. Rest of Europe
-
4. Middle East & Africa
- 4.1. Turkey
- 4.2. Israel
- 4.3. GCC
- 4.4. North Africa
- 4.5. South Africa
- 4.6. Rest of Middle East & Africa
-
5. Asia Pacific
- 5.1. China
- 5.2. India
- 5.3. Japan
- 5.4. South Korea
- 5.5. ASEAN
- 5.6. Oceania
- 5.7. Rest of Asia Pacific
Narrow Band Internet Of Things Nb Iot REPORT HIGHLIGHTS
| Aspects | Details |
|---|---|
| Study Period | 2019-2033 |
| Base Year | 2024 |
| Estimated Year | 2025 |
| Forecast Period | 2025-2033 |
| Historical Period | 2019-2024 |
| Growth Rate | CAGR of XXX% from 2019-2033 |
| Segmentation |
|
Table of Contents
- 1. Introduction
- 1.1. Research Scope
- 1.2. Market Segmentation
- 1.3. Research Methodology
- 1.4. Definitions and Assumptions
- 2. Executive Summary
- 2.1. Introduction
- 3. Market Dynamics
- 3.1. Introduction
- 3.2. Market Drivers
- 3.3. Market Restrains
- 3.4. Market Trends
- 4. Market Factor Analysis
- 4.1. Porters Five Forces
- 4.2. Supply/Value Chain
- 4.3. PESTEL analysis
- 4.4. Market Entropy
- 4.5. Patent/Trademark Analysis
- 5. Global Narrow Band Internet Of Things Nb Iot Analysis, Insights and Forecast, 2019-2031
- 5.1. Market Analysis, Insights and Forecast - by Application
- 5.1.1. Smart Agriculture
- 5.1.2. Asset Tracking
- 5.1.3. Other
- 5.2. Market Analysis, Insights and Forecast - by Type
- 5.2.1. CP Mode
- 5.2.2. UP Mode
- 5.3. Market Analysis, Insights and Forecast - by Region
- 5.3.1. North America
- 5.3.2. South America
- 5.3.3. Europe
- 5.3.4. Middle East & Africa
- 5.3.5. Asia Pacific
- 5.1. Market Analysis, Insights and Forecast - by Application
- 6. North America Narrow Band Internet Of Things Nb Iot Analysis, Insights and Forecast, 2019-2031
- 6.1. Market Analysis, Insights and Forecast - by Application
- 6.1.1. Smart Agriculture
- 6.1.2. Asset Tracking
- 6.1.3. Other
- 6.2. Market Analysis, Insights and Forecast - by Type
- 6.2.1. CP Mode
- 6.2.2. UP Mode
- 6.1. Market Analysis, Insights and Forecast - by Application
- 7. South America Narrow Band Internet Of Things Nb Iot Analysis, Insights and Forecast, 2019-2031
- 7.1. Market Analysis, Insights and Forecast - by Application
- 7.1.1. Smart Agriculture
- 7.1.2. Asset Tracking
- 7.1.3. Other
- 7.2. Market Analysis, Insights and Forecast - by Type
- 7.2.1. CP Mode
- 7.2.2. UP Mode
- 7.1. Market Analysis, Insights and Forecast - by Application
- 8. Europe Narrow Band Internet Of Things Nb Iot Analysis, Insights and Forecast, 2019-2031
- 8.1. Market Analysis, Insights and Forecast - by Application
- 8.1.1. Smart Agriculture
- 8.1.2. Asset Tracking
- 8.1.3. Other
- 8.2. Market Analysis, Insights and Forecast - by Type
- 8.2.1. CP Mode
- 8.2.2. UP Mode
- 8.1. Market Analysis, Insights and Forecast - by Application
- 9. Middle East & Africa Narrow Band Internet Of Things Nb Iot Analysis, Insights and Forecast, 2019-2031
- 9.1. Market Analysis, Insights and Forecast - by Application
- 9.1.1. Smart Agriculture
- 9.1.2. Asset Tracking
- 9.1.3. Other
- 9.2. Market Analysis, Insights and Forecast - by Type
- 9.2.1. CP Mode
- 9.2.2. UP Mode
- 9.1. Market Analysis, Insights and Forecast - by Application
- 10. Asia Pacific Narrow Band Internet Of Things Nb Iot Analysis, Insights and Forecast, 2019-2031
- 10.1. Market Analysis, Insights and Forecast - by Application
- 10.1.1. Smart Agriculture
- 10.1.2. Asset Tracking
- 10.1.3. Other
- 10.2. Market Analysis, Insights and Forecast - by Type
- 10.2.1. CP Mode
- 10.2.2. UP Mode
- 10.1. Market Analysis, Insights and Forecast - by Application
- 11. Competitive Analysis
- 11.1. Global Market Share Analysis 2024
- 11.2. Company Profiles
- 11.2.1 CT
- 11.2.1.1. Overview
- 11.2.1.2. Products
- 11.2.1.3. SWOT Analysis
- 11.2.1.4. Recent Developments
- 11.2.1.5. Financials (Based on Availability)
- 11.2.2 CMCC
- 11.2.2.1. Overview
- 11.2.2.2. Products
- 11.2.2.3. SWOT Analysis
- 11.2.2.4. Recent Developments
- 11.2.2.5. Financials (Based on Availability)
- 11.2.3 Cuniq
- 11.2.3.1. Overview
- 11.2.3.2. Products
- 11.2.3.3. SWOT Analysis
- 11.2.3.4. Recent Developments
- 11.2.3.5. Financials (Based on Availability)
- 11.2.4 Nokia
- 11.2.4.1. Overview
- 11.2.4.2. Products
- 11.2.4.3. SWOT Analysis
- 11.2.4.4. Recent Developments
- 11.2.4.5. Financials (Based on Availability)
- 11.2.5 Ericsson
- 11.2.5.1. Overview
- 11.2.5.2. Products
- 11.2.5.3. SWOT Analysis
- 11.2.5.4. Recent Developments
- 11.2.5.5. Financials (Based on Availability)
- 11.2.6 ZTE
- 11.2.6.1. Overview
- 11.2.6.2. Products
- 11.2.6.3. SWOT Analysis
- 11.2.6.4. Recent Developments
- 11.2.6.5. Financials (Based on Availability)
- 11.2.7 Intel
- 11.2.7.1. Overview
- 11.2.7.2. Products
- 11.2.7.3. SWOT Analysis
- 11.2.7.4. Recent Developments
- 11.2.7.5. Financials (Based on Availability)
- 11.2.8 Qualcomm
- 11.2.8.1. Overview
- 11.2.8.2. Products
- 11.2.8.3. SWOT Analysis
- 11.2.8.4. Recent Developments
- 11.2.8.5. Financials (Based on Availability)
- 11.2.9 Vodafone Group
- 11.2.9.1. Overview
- 11.2.9.2. Products
- 11.2.9.3. SWOT Analysis
- 11.2.9.4. Recent Developments
- 11.2.9.5. Financials (Based on Availability)
- 11.2.10 Telekom
- 11.2.10.1. Overview
- 11.2.10.2. Products
- 11.2.10.3. SWOT Analysis
- 11.2.10.4. Recent Developments
- 11.2.10.5. Financials (Based on Availability)
- 11.2.11 Huawei
- 11.2.11.1. Overview
- 11.2.11.2. Products
- 11.2.11.3. SWOT Analysis
- 11.2.11.4. Recent Developments
- 11.2.11.5. Financials (Based on Availability)
- 11.2.1 CT
List of Figures
- Figure 1: Global Narrow Band Internet Of Things Nb Iot Revenue Breakdown (million, %) by Region 2024 & 2032
- Figure 2: North America Narrow Band Internet Of Things Nb Iot Revenue (million), by Application 2024 & 2032
- Figure 3: North America Narrow Band Internet Of Things Nb Iot Revenue Share (%), by Application 2024 & 2032
- Figure 4: North America Narrow Band Internet Of Things Nb Iot Revenue (million), by Type 2024 & 2032
- Figure 5: North America Narrow Band Internet Of Things Nb Iot Revenue Share (%), by Type 2024 & 2032
- Figure 6: North America Narrow Band Internet Of Things Nb Iot Revenue (million), by Country 2024 & 2032
- Figure 7: North America Narrow Band Internet Of Things Nb Iot Revenue Share (%), by Country 2024 & 2032
- Figure 8: South America Narrow Band Internet Of Things Nb Iot Revenue (million), by Application 2024 & 2032
- Figure 9: South America Narrow Band Internet Of Things Nb Iot Revenue Share (%), by Application 2024 & 2032
- Figure 10: South America Narrow Band Internet Of Things Nb Iot Revenue (million), by Type 2024 & 2032
- Figure 11: South America Narrow Band Internet Of Things Nb Iot Revenue Share (%), by Type 2024 & 2032
- Figure 12: South America Narrow Band Internet Of Things Nb Iot Revenue (million), by Country 2024 & 2032
- Figure 13: South America Narrow Band Internet Of Things Nb Iot Revenue Share (%), by Country 2024 & 2032
- Figure 14: Europe Narrow Band Internet Of Things Nb Iot Revenue (million), by Application 2024 & 2032
- Figure 15: Europe Narrow Band Internet Of Things Nb Iot Revenue Share (%), by Application 2024 & 2032
- Figure 16: Europe Narrow Band Internet Of Things Nb Iot Revenue (million), by Type 2024 & 2032
- Figure 17: Europe Narrow Band Internet Of Things Nb Iot Revenue Share (%), by Type 2024 & 2032
- Figure 18: Europe Narrow Band Internet Of Things Nb Iot Revenue (million), by Country 2024 & 2032
- Figure 19: Europe Narrow Band Internet Of Things Nb Iot Revenue Share (%), by Country 2024 & 2032
- Figure 20: Middle East & Africa Narrow Band Internet Of Things Nb Iot Revenue (million), by Application 2024 & 2032
- Figure 21: Middle East & Africa Narrow Band Internet Of Things Nb Iot Revenue Share (%), by Application 2024 & 2032
- Figure 22: Middle East & Africa Narrow Band Internet Of Things Nb Iot Revenue (million), by Type 2024 & 2032
- Figure 23: Middle East & Africa Narrow Band Internet Of Things Nb Iot Revenue Share (%), by Type 2024 & 2032
- Figure 24: Middle East & Africa Narrow Band Internet Of Things Nb Iot Revenue (million), by Country 2024 & 2032
- Figure 25: Middle East & Africa Narrow Band Internet Of Things Nb Iot Revenue Share (%), by Country 2024 & 2032
- Figure 26: Asia Pacific Narrow Band Internet Of Things Nb Iot Revenue (million), by Application 2024 & 2032
- Figure 27: Asia Pacific Narrow Band Internet Of Things Nb Iot Revenue Share (%), by Application 2024 & 2032
- Figure 28: Asia Pacific Narrow Band Internet Of Things Nb Iot Revenue (million), by Type 2024 & 2032
- Figure 29: Asia Pacific Narrow Band Internet Of Things Nb Iot Revenue Share (%), by Type 2024 & 2032
- Figure 30: Asia Pacific Narrow Band Internet Of Things Nb Iot Revenue (million), by Country 2024 & 2032
- Figure 31: Asia Pacific Narrow Band Internet Of Things Nb Iot Revenue Share (%), by Country 2024 & 2032
List of Tables
- Table 1: Global Narrow Band Internet Of Things Nb Iot Revenue million Forecast, by Region 2019 & 2032
- Table 2: Global Narrow Band Internet Of Things Nb Iot Revenue million Forecast, by Application 2019 & 2032
- Table 3: Global Narrow Band Internet Of Things Nb Iot Revenue million Forecast, by Type 2019 & 2032
- Table 4: Global Narrow Band Internet Of Things Nb Iot Revenue million Forecast, by Region 2019 & 2032
- Table 5: Global Narrow Band Internet Of Things Nb Iot Revenue million Forecast, by Application 2019 & 2032
- Table 6: Global Narrow Band Internet Of Things Nb Iot Revenue million Forecast, by Type 2019 & 2032
- Table 7: Global Narrow Band Internet Of Things Nb Iot Revenue million Forecast, by Country 2019 & 2032
- Table 8: United States Narrow Band Internet Of Things Nb Iot Revenue (million) Forecast, by Application 2019 & 2032
- Table 9: Canada Narrow Band Internet Of Things Nb Iot Revenue (million) Forecast, by Application 2019 & 2032
- Table 10: Mexico Narrow Band Internet Of Things Nb Iot Revenue (million) Forecast, by Application 2019 & 2032
- Table 11: Global Narrow Band Internet Of Things Nb Iot Revenue million Forecast, by Application 2019 & 2032
- Table 12: Global Narrow Band Internet Of Things Nb Iot Revenue million Forecast, by Type 2019 & 2032
- Table 13: Global Narrow Band Internet Of Things Nb Iot Revenue million Forecast, by Country 2019 & 2032
- Table 14: Brazil Narrow Band Internet Of Things Nb Iot Revenue (million) Forecast, by Application 2019 & 2032
- Table 15: Argentina Narrow Band Internet Of Things Nb Iot Revenue (million) Forecast, by Application 2019 & 2032
- Table 16: Rest of South America Narrow Band Internet Of Things Nb Iot Revenue (million) Forecast, by Application 2019 & 2032
- Table 17: Global Narrow Band Internet Of Things Nb Iot Revenue million Forecast, by Application 2019 & 2032
- Table 18: Global Narrow Band Internet Of Things Nb Iot Revenue million Forecast, by Type 2019 & 2032
- Table 19: Global Narrow Band Internet Of Things Nb Iot Revenue million Forecast, by Country 2019 & 2032
- Table 20: United Kingdom Narrow Band Internet Of Things Nb Iot Revenue (million) Forecast, by Application 2019 & 2032
- Table 21: Germany Narrow Band Internet Of Things Nb Iot Revenue (million) Forecast, by Application 2019 & 2032
- Table 22: France Narrow Band Internet Of Things Nb Iot Revenue (million) Forecast, by Application 2019 & 2032
- Table 23: Italy Narrow Band Internet Of Things Nb Iot Revenue (million) Forecast, by Application 2019 & 2032
- Table 24: Spain Narrow Band Internet Of Things Nb Iot Revenue (million) Forecast, by Application 2019 & 2032
- Table 25: Russia Narrow Band Internet Of Things Nb Iot Revenue (million) Forecast, by Application 2019 & 2032
- Table 26: Benelux Narrow Band Internet Of Things Nb Iot Revenue (million) Forecast, by Application 2019 & 2032
- Table 27: Nordics Narrow Band Internet Of Things Nb Iot Revenue (million) Forecast, by Application 2019 & 2032
- Table 28: Rest of Europe Narrow Band Internet Of Things Nb Iot Revenue (million) Forecast, by Application 2019 & 2032
- Table 29: Global Narrow Band Internet Of Things Nb Iot Revenue million Forecast, by Application 2019 & 2032
- Table 30: Global Narrow Band Internet Of Things Nb Iot Revenue million Forecast, by Type 2019 & 2032
- Table 31: Global Narrow Band Internet Of Things Nb Iot Revenue million Forecast, by Country 2019 & 2032
- Table 32: Turkey Narrow Band Internet Of Things Nb Iot Revenue (million) Forecast, by Application 2019 & 2032
- Table 33: Israel Narrow Band Internet Of Things Nb Iot Revenue (million) Forecast, by Application 2019 & 2032
- Table 34: GCC Narrow Band Internet Of Things Nb Iot Revenue (million) Forecast, by Application 2019 & 2032
- Table 35: North Africa Narrow Band Internet Of Things Nb Iot Revenue (million) Forecast, by Application 2019 & 2032
- Table 36: South Africa Narrow Band Internet Of Things Nb Iot Revenue (million) Forecast, by Application 2019 & 2032
- Table 37: Rest of Middle East & Africa Narrow Band Internet Of Things Nb Iot Revenue (million) Forecast, by Application 2019 & 2032
- Table 38: Global Narrow Band Internet Of Things Nb Iot Revenue million Forecast, by Application 2019 & 2032
- Table 39: Global Narrow Band Internet Of Things Nb Iot Revenue million Forecast, by Type 2019 & 2032
- Table 40: Global Narrow Band Internet Of Things Nb Iot Revenue million Forecast, by Country 2019 & 2032
- Table 41: China Narrow Band Internet Of Things Nb Iot Revenue (million) Forecast, by Application 2019 & 2032
- Table 42: India Narrow Band Internet Of Things Nb Iot Revenue (million) Forecast, by Application 2019 & 2032
- Table 43: Japan Narrow Band Internet Of Things Nb Iot Revenue (million) Forecast, by Application 2019 & 2032
- Table 44: South Korea Narrow Band Internet Of Things Nb Iot Revenue (million) Forecast, by Application 2019 & 2032
- Table 45: ASEAN Narrow Band Internet Of Things Nb Iot Revenue (million) Forecast, by Application 2019 & 2032
- Table 46: Oceania Narrow Band Internet Of Things Nb Iot Revenue (million) Forecast, by Application 2019 & 2032
- Table 47: Rest of Asia Pacific Narrow Band Internet Of Things Nb Iot Revenue (million) Forecast, by Application 2019 & 2032
Frequently Asked Questions
1. What is the projected Compound Annual Growth Rate (CAGR) of the Narrow Band Internet Of Things Nb Iot?
The projected CAGR is approximately XXX%.
2. Which companies are prominent players in the Narrow Band Internet Of Things Nb Iot?
Key companies in the market include CT, CMCC, Cuniq, Nokia, Ericsson, ZTE, Intel, Qualcomm, Vodafone Group, Telekom, Huawei.
3. What are the main segments of the Narrow Band Internet Of Things Nb Iot?
The market segments include Application, Type.
4. Can you provide details about the market size?
The market size is estimated to be USD XXX million as of 2022.
5. What are some drivers contributing to market growth?
N/A
6. What are the notable trends driving market growth?
N/A
7. Are there any restraints impacting market growth?
N/A
8. Can you provide examples of recent developments in the market?
N/A
9. What pricing options are available for accessing the report?
Pricing options include single-user, multi-user, and enterprise licenses priced at USD 2900.00, USD 4350.00, and USD 5800.00 respectively.
10. Is the market size provided in terms of value or volume?
The market size is provided in terms of value, measured in million.
11. Are there any specific market keywords associated with the report?
Yes, the market keyword associated with the report is "Narrow Band Internet Of Things Nb Iot," which aids in identifying and referencing the specific market segment covered.
12. How do I determine which pricing option suits my needs best?
The pricing options vary based on user requirements and access needs. Individual users may opt for single-user licenses, while businesses requiring broader access may choose multi-user or enterprise licenses for cost-effective access to the report.
13. Are there any additional resources or data provided in the Narrow Band Internet Of Things Nb Iot report?
While the report offers comprehensive insights, it's advisable to review the specific contents or supplementary materials provided to ascertain if additional resources or data are available.
14. How can I stay updated on further developments or reports in the Narrow Band Internet Of Things Nb Iot?
To stay informed about further developments, trends, and reports in the Narrow Band Internet Of Things Nb Iot, consider subscribing to industry newsletters, following relevant companies and organizations, or regularly checking reputable industry news sources and publications.
Methodology
Step 1 - Identification of Relevant Samples Size from Population Database


Step 2 - Approaches for Defining Global Market Size (Value, Volume* & Price*)

Note*: In applicable scenarios
Step 3 - Data Sources
Primary Research
- Web Analytics
- Survey Reports
- Research Institute
- Latest Research Reports
- Opinion Leaders
Secondary Research
- Annual Reports
- White Paper
- Latest Press Release
- Industry Association
- Paid Database
- Investor Presentations

Step 4 - Data Triangulation
Involves using different sources of information in order to increase the validity of a study
These sources are likely to be stakeholders in a program - participants, other researchers, program staff, other community members, and so on.
Then we put all data in single framework & apply various statistical tools to find out the dynamic on the market.
During the analysis stage, feedback from the stakeholder groups would be compared to determine areas of agreement as well as areas of divergence


