
Key Insights
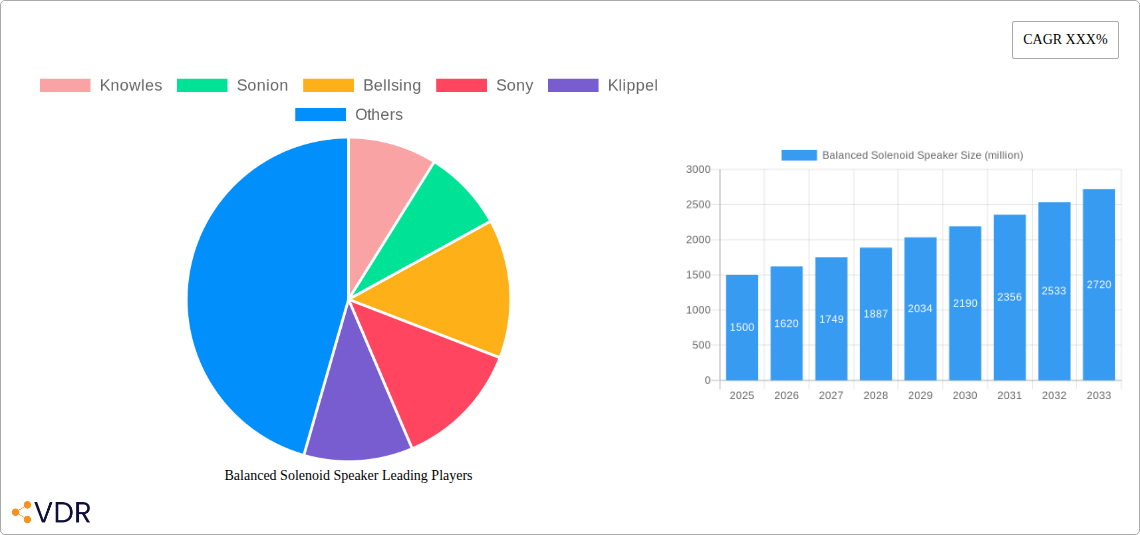
The global balanced armature speaker market is experiencing robust growth, driven by increasing demand for high-fidelity audio in consumer electronics and hearing aids. The market's steady expansion is fueled by several key factors. Miniaturization trends in electronics necessitate smaller, yet higher-performing audio components, making balanced armature speakers an ideal solution. Their superior audio quality, especially in terms of clarity and detail, at smaller sizes compared to traditional dynamic speakers is a significant advantage. Furthermore, the rising popularity of true wireless earbuds and hearables is significantly boosting market growth, as these devices require compact, energy-efficient audio solutions. The increasing adoption of advanced materials and manufacturing processes further contributes to enhanced performance and reduced costs, making balanced armature speakers more accessible across various applications. We estimate the market size to be approximately $1.5 billion in 2025, experiencing a Compound Annual Growth Rate (CAGR) of around 8% between 2025 and 2033. Key players such as Knowles, Sonion, and others continuously invest in R&D to improve speaker design, leading to innovative products with enhanced sound reproduction and durability.
Despite the strong growth trajectory, several factors could restrain market expansion. Competition from alternative technologies, like dynamic drivers and bone conduction speakers, could potentially limit market share. Moreover, price sensitivity in certain consumer segments might restrict market penetration, particularly in developing economies. However, ongoing technological advancements and the continuous demand for superior audio quality in increasingly diverse applications are expected to outweigh these challenges, ensuring sustained growth in the foreseeable future. Segmentation within the market includes different speaker sizes, application types (hearables, consumer electronics, medical devices), and geographical regions, each presenting unique growth opportunities and challenges. The market is projected to reach approximately $2.8 billion by 2033, showcasing significant potential for investment and expansion.
Balanced Solenoid Speaker Market Report: 2019-2033
This comprehensive report provides a detailed analysis of the Balanced Solenoid Speaker market, encompassing market dynamics, growth trends, regional analysis, product landscape, competitive overview, and future outlook. The study period spans from 2019 to 2033, with 2025 as the base and estimated year. The report is crucial for industry professionals, investors, and strategic decision-makers seeking a deep understanding of this evolving market. Parent market: Audio Components; Child market: Loudspeakers.
Balanced Solenoid Speaker Market Dynamics & Structure
The Balanced Solenoid Speaker market is characterized by moderate concentration, with key players like Knowles, Sonion, Bellsing, Sony, and Bosch holding significant market share. Technological innovation, driven by the demand for high-fidelity audio and miniaturization, is a key growth driver. Stringent regulatory frameworks related to audio device safety and environmental compliance also shape market dynamics. Competitive substitutes include other loudspeaker technologies, while end-user demographics primarily consist of consumer electronics manufacturers and automotive companies. M&A activity has been moderate (xx deals in the last 5 years, resulting in a xx% market share shift), with larger players seeking to expand their product portfolios and geographical reach.
- Market Concentration: Moderately concentrated, with top 5 players holding approximately xx% market share in 2025.
- Technological Innovation: Focus on improved sound quality, miniaturization, and power efficiency.
- Regulatory Landscape: Compliance with safety and environmental regulations impacting manufacturing and product design.
- Competitive Substitutes: Electrostatic speakers, piezoelectric speakers, and traditional dynamic speakers.
- End-User Demographics: Consumer electronics (60%), Automotive (25%), Professional Audio (15%).
- M&A Activity: xx deals over the period 2019-2024, leading to a xx% shift in market share.
Balanced Solenoid Speaker Growth Trends & Insights
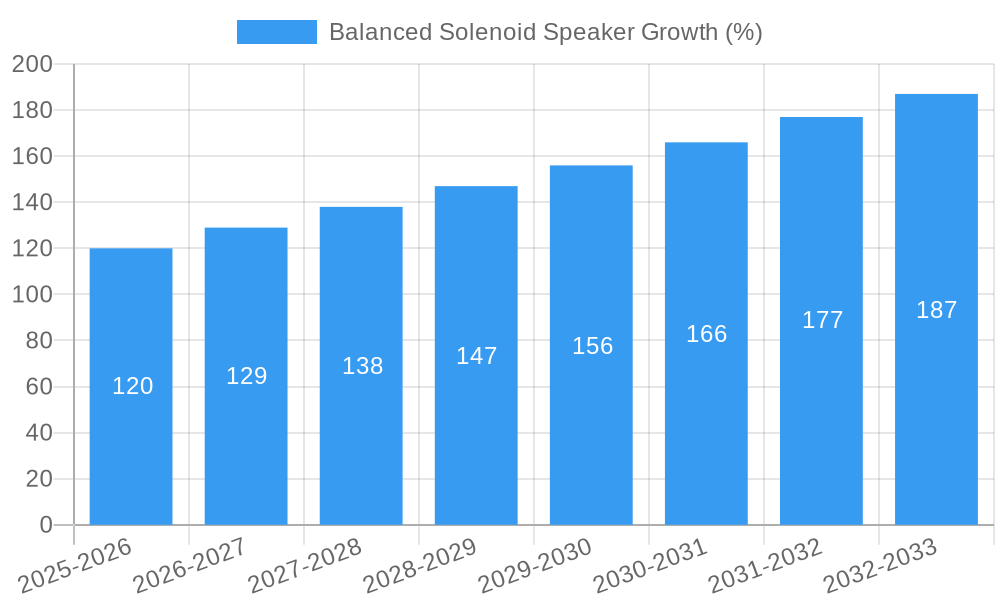
The Balanced Solenoid Speaker market witnessed robust growth during the historical period (2019-2024), expanding at a CAGR of xx%. This growth is primarily attributed to the increasing demand for high-quality audio in consumer electronics, particularly in smartphones, headphones, and wearables. The adoption rate of Balanced Solenoid Speakers is projected to increase significantly in the forecast period (2025-2033), driven by technological advancements such as improved power handling capacity and reduced distortion. Technological disruptions, including the rise of advanced materials and manufacturing processes, are further propelling market expansion. Consumer behavior shifts towards premium audio experiences are also significantly contributing to the market's upward trajectory. The market size is expected to reach xx million units by 2033, representing a CAGR of xx% during the forecast period. Market penetration in the consumer electronics segment is expected to reach xx% by 2033.
Dominant Regions, Countries, or Segments in Balanced Solenoid Speaker
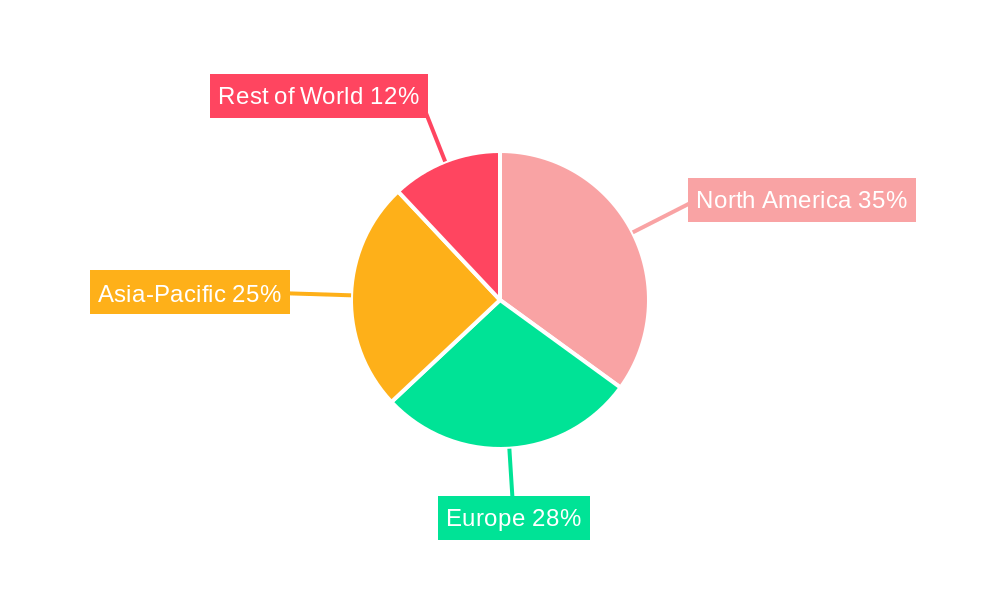
North America currently dominates the Balanced Solenoid Speaker market, holding a xx% market share in 2025, driven by strong demand from the consumer electronics industry and a well-established supply chain. Asia-Pacific is projected to exhibit the highest growth rate during the forecast period, fueled by rapid economic expansion and increasing disposable incomes in key markets like China and India.
- North America: Strong demand from consumer electronics and automotive sectors, well-established supply chain.
- Asia-Pacific: High growth potential driven by rapid economic growth and increasing consumer spending.
- Europe: Stable growth, driven by technological advancements and regulatory compliance.
Balanced Solenoid Speaker Product Landscape
Balanced Solenoid Speaker technology is characterized by its superior sound quality, compact size, and efficiency. Recent innovations focus on improved linearity, wider frequency response, and enhanced power handling capabilities. Key applications include high-fidelity headphones, in-ear monitors, and high-end audio systems. The unique selling propositions include low distortion, wide frequency response, and high-efficiency operation. Ongoing technological advancements aim to further reduce size and cost while simultaneously improving performance metrics.
Key Drivers, Barriers & Challenges in Balanced Solenoid Speaker
Key Drivers: Rising demand for high-fidelity audio in consumer electronics, technological advancements improving efficiency and sound quality, increasing adoption in automotive applications.
Challenges: High manufacturing costs, intense competition from established loudspeaker technologies, supply chain disruptions, and potential regulatory changes impacting material sourcing. These challenges could lead to a xx% reduction in market growth if not adequately addressed.
Emerging Opportunities in Balanced Solenoid Speaker
Emerging opportunities exist in the integration of Balanced Solenoid Speakers into next-generation hearables, expansion into the emerging markets of Southeast Asia and Africa, and development of customized solutions for specific audio applications.
Growth Accelerators in the Balanced Solenoid Speaker Industry
Strategic partnerships between Balanced Solenoid Speaker manufacturers and consumer electronics companies are accelerating market growth. Technological breakthroughs, such as the use of advanced materials and improved manufacturing techniques, are further enhancing product performance and reducing production costs. Market expansion into new application areas, such as automotive infotainment systems, is also contributing to the growth of the market.
Key Players Shaping the Balanced Solenoid Speaker Market
Notable Milestones in Balanced Solenoid Speaker Sector
- 2020-Q3: Knowles launches a new generation of high-efficiency Balanced Solenoid Speaker.
- 2022-Q1: Sonion acquires a smaller Balanced Solenoid Speaker manufacturer, expanding its market share.
- 2023-Q4: New industry standard for Balanced Solenoid Speaker performance metrics is established.
In-Depth Balanced Solenoid Speaker Market Outlook
The Balanced Solenoid Speaker market is poised for continued growth, driven by technological innovation, expanding applications, and rising consumer demand for high-quality audio. Strategic partnerships, innovative product development, and expansion into new geographic markets will be crucial for sustained growth in the coming years. The market presents significant opportunities for companies that can leverage technological advancements to deliver high-performance, cost-effective solutions.
Balanced Solenoid Speaker Segmentation
-
1. Application
- 1.1. Medical Health Field
- 1.2. Consumer Electronics
- 1.3. Military-Securiy
- 1.4. Others
-
2. Type
- 2.1. Dual
- 2.2. Single
- 2.3. Other
Balanced Solenoid Speaker Segmentation By Geography
-
1. North America
- 1.1. United States
- 1.2. Canada
- 1.3. Mexico
-
2. South America
- 2.1. Brazil
- 2.2. Argentina
- 2.3. Rest of South America
-
3. Europe
- 3.1. United Kingdom
- 3.2. Germany
- 3.3. France
- 3.4. Italy
- 3.5. Spain
- 3.6. Russia
- 3.7. Benelux
- 3.8. Nordics
- 3.9. Rest of Europe
-
4. Middle East & Africa
- 4.1. Turkey
- 4.2. Israel
- 4.3. GCC
- 4.4. North Africa
- 4.5. South Africa
- 4.6. Rest of Middle East & Africa
-
5. Asia Pacific
- 5.1. China
- 5.2. India
- 5.3. Japan
- 5.4. South Korea
- 5.5. ASEAN
- 5.6. Oceania
- 5.7. Rest of Asia Pacific
Balanced Solenoid Speaker REPORT HIGHLIGHTS
| Aspects | Details |
|---|---|
| Study Period | 2019-2033 |
| Base Year | 2024 |
| Estimated Year | 2025 |
| Forecast Period | 2025-2033 |
| Historical Period | 2019-2024 |
| Growth Rate | CAGR of XXX% from 2019-2033 |
| Segmentation |
|
Table of Contents
- 1. Introduction
- 1.1. Research Scope
- 1.2. Market Segmentation
- 1.3. Research Methodology
- 1.4. Definitions and Assumptions
- 2. Executive Summary
- 2.1. Introduction
- 3. Market Dynamics
- 3.1. Introduction
- 3.2. Market Drivers
- 3.3. Market Restrains
- 3.4. Market Trends
- 4. Market Factor Analysis
- 4.1. Porters Five Forces
- 4.2. Supply/Value Chain
- 4.3. PESTEL analysis
- 4.4. Market Entropy
- 4.5. Patent/Trademark Analysis
- 5. Global Balanced Solenoid Speaker Analysis, Insights and Forecast, 2019-2031
- 5.1. Market Analysis, Insights and Forecast - by Application
- 5.1.1. Medical Health Field
- 5.1.2. Consumer Electronics
- 5.1.3. Military-Securiy
- 5.1.4. Others
- 5.2. Market Analysis, Insights and Forecast - by Type
- 5.2.1. Dual
- 5.2.2. Single
- 5.2.3. Other
- 5.3. Market Analysis, Insights and Forecast - by Region
- 5.3.1. North America
- 5.3.2. South America
- 5.3.3. Europe
- 5.3.4. Middle East & Africa
- 5.3.5. Asia Pacific
- 5.1. Market Analysis, Insights and Forecast - by Application
- 6. North America Balanced Solenoid Speaker Analysis, Insights and Forecast, 2019-2031
- 6.1. Market Analysis, Insights and Forecast - by Application
- 6.1.1. Medical Health Field
- 6.1.2. Consumer Electronics
- 6.1.3. Military-Securiy
- 6.1.4. Others
- 6.2. Market Analysis, Insights and Forecast - by Type
- 6.2.1. Dual
- 6.2.2. Single
- 6.2.3. Other
- 6.1. Market Analysis, Insights and Forecast - by Application
- 7. South America Balanced Solenoid Speaker Analysis, Insights and Forecast, 2019-2031
- 7.1. Market Analysis, Insights and Forecast - by Application
- 7.1.1. Medical Health Field
- 7.1.2. Consumer Electronics
- 7.1.3. Military-Securiy
- 7.1.4. Others
- 7.2. Market Analysis, Insights and Forecast - by Type
- 7.2.1. Dual
- 7.2.2. Single
- 7.2.3. Other
- 7.1. Market Analysis, Insights and Forecast - by Application
- 8. Europe Balanced Solenoid Speaker Analysis, Insights and Forecast, 2019-2031
- 8.1. Market Analysis, Insights and Forecast - by Application
- 8.1.1. Medical Health Field
- 8.1.2. Consumer Electronics
- 8.1.3. Military-Securiy
- 8.1.4. Others
- 8.2. Market Analysis, Insights and Forecast - by Type
- 8.2.1. Dual
- 8.2.2. Single
- 8.2.3. Other
- 8.1. Market Analysis, Insights and Forecast - by Application
- 9. Middle East & Africa Balanced Solenoid Speaker Analysis, Insights and Forecast, 2019-2031
- 9.1. Market Analysis, Insights and Forecast - by Application
- 9.1.1. Medical Health Field
- 9.1.2. Consumer Electronics
- 9.1.3. Military-Securiy
- 9.1.4. Others
- 9.2. Market Analysis, Insights and Forecast - by Type
- 9.2.1. Dual
- 9.2.2. Single
- 9.2.3. Other
- 9.1. Market Analysis, Insights and Forecast - by Application
- 10. Asia Pacific Balanced Solenoid Speaker Analysis, Insights and Forecast, 2019-2031
- 10.1. Market Analysis, Insights and Forecast - by Application
- 10.1.1. Medical Health Field
- 10.1.2. Consumer Electronics
- 10.1.3. Military-Securiy
- 10.1.4. Others
- 10.2. Market Analysis, Insights and Forecast - by Type
- 10.2.1. Dual
- 10.2.2. Single
- 10.2.3. Other
- 10.1. Market Analysis, Insights and Forecast - by Application
- 11. Competitive Analysis
- 11.1. Global Market Share Analysis 2024
- 11.2. Company Profiles
- 11.2.1 Knowles
- 11.2.1.1. Overview
- 11.2.1.2. Products
- 11.2.1.3. SWOT Analysis
- 11.2.1.4. Recent Developments
- 11.2.1.5. Financials (Based on Availability)
- 11.2.2 Sonion
- 11.2.2.1. Overview
- 11.2.2.2. Products
- 11.2.2.3. SWOT Analysis
- 11.2.2.4. Recent Developments
- 11.2.2.5. Financials (Based on Availability)
- 11.2.3 Bellsing
- 11.2.3.1. Overview
- 11.2.3.2. Products
- 11.2.3.3. SWOT Analysis
- 11.2.3.4. Recent Developments
- 11.2.3.5. Financials (Based on Availability)
- 11.2.4 Sony
- 11.2.4.1. Overview
- 11.2.4.2. Products
- 11.2.4.3. SWOT Analysis
- 11.2.4.4. Recent Developments
- 11.2.4.5. Financials (Based on Availability)
- 11.2.5 Klippel
- 11.2.5.1. Overview
- 11.2.5.2. Products
- 11.2.5.3. SWOT Analysis
- 11.2.5.4. Recent Developments
- 11.2.5.5. Financials (Based on Availability)
- 11.2.6 BOSCH
- 11.2.6.1. Overview
- 11.2.6.2. Products
- 11.2.6.3. SWOT Analysis
- 11.2.6.4. Recent Developments
- 11.2.6.5. Financials (Based on Availability)
- 11.2.7 GE
- 11.2.7.1. Overview
- 11.2.7.2. Products
- 11.2.7.3. SWOT Analysis
- 11.2.7.4. Recent Developments
- 11.2.7.5. Financials (Based on Availability)
- 11.2.8 SYT Audio
- 11.2.8.1. Overview
- 11.2.8.2. Products
- 11.2.8.3. SWOT Analysis
- 11.2.8.4. Recent Developments
- 11.2.8.5. Financials (Based on Availability)
- 11.2.1 Knowles
List of Figures
- Figure 1: Global Balanced Solenoid Speaker Revenue Breakdown (million, %) by Region 2024 & 2032
- Figure 2: Global Balanced Solenoid Speaker Volume Breakdown (K, %) by Region 2024 & 2032
- Figure 3: North America Balanced Solenoid Speaker Revenue (million), by Application 2024 & 2032
- Figure 4: North America Balanced Solenoid Speaker Volume (K), by Application 2024 & 2032
- Figure 5: North America Balanced Solenoid Speaker Revenue Share (%), by Application 2024 & 2032
- Figure 6: North America Balanced Solenoid Speaker Volume Share (%), by Application 2024 & 2032
- Figure 7: North America Balanced Solenoid Speaker Revenue (million), by Type 2024 & 2032
- Figure 8: North America Balanced Solenoid Speaker Volume (K), by Type 2024 & 2032
- Figure 9: North America Balanced Solenoid Speaker Revenue Share (%), by Type 2024 & 2032
- Figure 10: North America Balanced Solenoid Speaker Volume Share (%), by Type 2024 & 2032
- Figure 11: North America Balanced Solenoid Speaker Revenue (million), by Country 2024 & 2032
- Figure 12: North America Balanced Solenoid Speaker Volume (K), by Country 2024 & 2032
- Figure 13: North America Balanced Solenoid Speaker Revenue Share (%), by Country 2024 & 2032
- Figure 14: North America Balanced Solenoid Speaker Volume Share (%), by Country 2024 & 2032
- Figure 15: South America Balanced Solenoid Speaker Revenue (million), by Application 2024 & 2032
- Figure 16: South America Balanced Solenoid Speaker Volume (K), by Application 2024 & 2032
- Figure 17: South America Balanced Solenoid Speaker Revenue Share (%), by Application 2024 & 2032
- Figure 18: South America Balanced Solenoid Speaker Volume Share (%), by Application 2024 & 2032
- Figure 19: South America Balanced Solenoid Speaker Revenue (million), by Type 2024 & 2032
- Figure 20: South America Balanced Solenoid Speaker Volume (K), by Type 2024 & 2032
- Figure 21: South America Balanced Solenoid Speaker Revenue Share (%), by Type 2024 & 2032
- Figure 22: South America Balanced Solenoid Speaker Volume Share (%), by Type 2024 & 2032
- Figure 23: South America Balanced Solenoid Speaker Revenue (million), by Country 2024 & 2032
- Figure 24: South America Balanced Solenoid Speaker Volume (K), by Country 2024 & 2032
- Figure 25: South America Balanced Solenoid Speaker Revenue Share (%), by Country 2024 & 2032
- Figure 26: South America Balanced Solenoid Speaker Volume Share (%), by Country 2024 & 2032
- Figure 27: Europe Balanced Solenoid Speaker Revenue (million), by Application 2024 & 2032
- Figure 28: Europe Balanced Solenoid Speaker Volume (K), by Application 2024 & 2032
- Figure 29: Europe Balanced Solenoid Speaker Revenue Share (%), by Application 2024 & 2032
- Figure 30: Europe Balanced Solenoid Speaker Volume Share (%), by Application 2024 & 2032
- Figure 31: Europe Balanced Solenoid Speaker Revenue (million), by Type 2024 & 2032
- Figure 32: Europe Balanced Solenoid Speaker Volume (K), by Type 2024 & 2032
- Figure 33: Europe Balanced Solenoid Speaker Revenue Share (%), by Type 2024 & 2032
- Figure 34: Europe Balanced Solenoid Speaker Volume Share (%), by Type 2024 & 2032
- Figure 35: Europe Balanced Solenoid Speaker Revenue (million), by Country 2024 & 2032
- Figure 36: Europe Balanced Solenoid Speaker Volume (K), by Country 2024 & 2032
- Figure 37: Europe Balanced Solenoid Speaker Revenue Share (%), by Country 2024 & 2032
- Figure 38: Europe Balanced Solenoid Speaker Volume Share (%), by Country 2024 & 2032
- Figure 39: Middle East & Africa Balanced Solenoid Speaker Revenue (million), by Application 2024 & 2032
- Figure 40: Middle East & Africa Balanced Solenoid Speaker Volume (K), by Application 2024 & 2032
- Figure 41: Middle East & Africa Balanced Solenoid Speaker Revenue Share (%), by Application 2024 & 2032
- Figure 42: Middle East & Africa Balanced Solenoid Speaker Volume Share (%), by Application 2024 & 2032
- Figure 43: Middle East & Africa Balanced Solenoid Speaker Revenue (million), by Type 2024 & 2032
- Figure 44: Middle East & Africa Balanced Solenoid Speaker Volume (K), by Type 2024 & 2032
- Figure 45: Middle East & Africa Balanced Solenoid Speaker Revenue Share (%), by Type 2024 & 2032
- Figure 46: Middle East & Africa Balanced Solenoid Speaker Volume Share (%), by Type 2024 & 2032
- Figure 47: Middle East & Africa Balanced Solenoid Speaker Revenue (million), by Country 2024 & 2032
- Figure 48: Middle East & Africa Balanced Solenoid Speaker Volume (K), by Country 2024 & 2032
- Figure 49: Middle East & Africa Balanced Solenoid Speaker Revenue Share (%), by Country 2024 & 2032
- Figure 50: Middle East & Africa Balanced Solenoid Speaker Volume Share (%), by Country 2024 & 2032
- Figure 51: Asia Pacific Balanced Solenoid Speaker Revenue (million), by Application 2024 & 2032
- Figure 52: Asia Pacific Balanced Solenoid Speaker Volume (K), by Application 2024 & 2032
- Figure 53: Asia Pacific Balanced Solenoid Speaker Revenue Share (%), by Application 2024 & 2032
- Figure 54: Asia Pacific Balanced Solenoid Speaker Volume Share (%), by Application 2024 & 2032
- Figure 55: Asia Pacific Balanced Solenoid Speaker Revenue (million), by Type 2024 & 2032
- Figure 56: Asia Pacific Balanced Solenoid Speaker Volume (K), by Type 2024 & 2032
- Figure 57: Asia Pacific Balanced Solenoid Speaker Revenue Share (%), by Type 2024 & 2032
- Figure 58: Asia Pacific Balanced Solenoid Speaker Volume Share (%), by Type 2024 & 2032
- Figure 59: Asia Pacific Balanced Solenoid Speaker Revenue (million), by Country 2024 & 2032
- Figure 60: Asia Pacific Balanced Solenoid Speaker Volume (K), by Country 2024 & 2032
- Figure 61: Asia Pacific Balanced Solenoid Speaker Revenue Share (%), by Country 2024 & 2032
- Figure 62: Asia Pacific Balanced Solenoid Speaker Volume Share (%), by Country 2024 & 2032
List of Tables
- Table 1: Global Balanced Solenoid Speaker Revenue million Forecast, by Region 2019 & 2032
- Table 2: Global Balanced Solenoid Speaker Volume K Forecast, by Region 2019 & 2032
- Table 3: Global Balanced Solenoid Speaker Revenue million Forecast, by Application 2019 & 2032
- Table 4: Global Balanced Solenoid Speaker Volume K Forecast, by Application 2019 & 2032
- Table 5: Global Balanced Solenoid Speaker Revenue million Forecast, by Type 2019 & 2032
- Table 6: Global Balanced Solenoid Speaker Volume K Forecast, by Type 2019 & 2032
- Table 7: Global Balanced Solenoid Speaker Revenue million Forecast, by Region 2019 & 2032
- Table 8: Global Balanced Solenoid Speaker Volume K Forecast, by Region 2019 & 2032
- Table 9: Global Balanced Solenoid Speaker Revenue million Forecast, by Application 2019 & 2032
- Table 10: Global Balanced Solenoid Speaker Volume K Forecast, by Application 2019 & 2032
- Table 11: Global Balanced Solenoid Speaker Revenue million Forecast, by Type 2019 & 2032
- Table 12: Global Balanced Solenoid Speaker Volume K Forecast, by Type 2019 & 2032
- Table 13: Global Balanced Solenoid Speaker Revenue million Forecast, by Country 2019 & 2032
- Table 14: Global Balanced Solenoid Speaker Volume K Forecast, by Country 2019 & 2032
- Table 15: United States Balanced Solenoid Speaker Revenue (million) Forecast, by Application 2019 & 2032
- Table 16: United States Balanced Solenoid Speaker Volume (K) Forecast, by Application 2019 & 2032
- Table 17: Canada Balanced Solenoid Speaker Revenue (million) Forecast, by Application 2019 & 2032
- Table 18: Canada Balanced Solenoid Speaker Volume (K) Forecast, by Application 2019 & 2032
- Table 19: Mexico Balanced Solenoid Speaker Revenue (million) Forecast, by Application 2019 & 2032
- Table 20: Mexico Balanced Solenoid Speaker Volume (K) Forecast, by Application 2019 & 2032
- Table 21: Global Balanced Solenoid Speaker Revenue million Forecast, by Application 2019 & 2032
- Table 22: Global Balanced Solenoid Speaker Volume K Forecast, by Application 2019 & 2032
- Table 23: Global Balanced Solenoid Speaker Revenue million Forecast, by Type 2019 & 2032
- Table 24: Global Balanced Solenoid Speaker Volume K Forecast, by Type 2019 & 2032
- Table 25: Global Balanced Solenoid Speaker Revenue million Forecast, by Country 2019 & 2032
- Table 26: Global Balanced Solenoid Speaker Volume K Forecast, by Country 2019 & 2032
- Table 27: Brazil Balanced Solenoid Speaker Revenue (million) Forecast, by Application 2019 & 2032
- Table 28: Brazil Balanced Solenoid Speaker Volume (K) Forecast, by Application 2019 & 2032
- Table 29: Argentina Balanced Solenoid Speaker Revenue (million) Forecast, by Application 2019 & 2032
- Table 30: Argentina Balanced Solenoid Speaker Volume (K) Forecast, by Application 2019 & 2032
- Table 31: Rest of South America Balanced Solenoid Speaker Revenue (million) Forecast, by Application 2019 & 2032
- Table 32: Rest of South America Balanced Solenoid Speaker Volume (K) Forecast, by Application 2019 & 2032
- Table 33: Global Balanced Solenoid Speaker Revenue million Forecast, by Application 2019 & 2032
- Table 34: Global Balanced Solenoid Speaker Volume K Forecast, by Application 2019 & 2032
- Table 35: Global Balanced Solenoid Speaker Revenue million Forecast, by Type 2019 & 2032
- Table 36: Global Balanced Solenoid Speaker Volume K Forecast, by Type 2019 & 2032
- Table 37: Global Balanced Solenoid Speaker Revenue million Forecast, by Country 2019 & 2032
- Table 38: Global Balanced Solenoid Speaker Volume K Forecast, by Country 2019 & 2032
- Table 39: United Kingdom Balanced Solenoid Speaker Revenue (million) Forecast, by Application 2019 & 2032
- Table 40: United Kingdom Balanced Solenoid Speaker Volume (K) Forecast, by Application 2019 & 2032
- Table 41: Germany Balanced Solenoid Speaker Revenue (million) Forecast, by Application 2019 & 2032
- Table 42: Germany Balanced Solenoid Speaker Volume (K) Forecast, by Application 2019 & 2032
- Table 43: France Balanced Solenoid Speaker Revenue (million) Forecast, by Application 2019 & 2032
- Table 44: France Balanced Solenoid Speaker Volume (K) Forecast, by Application 2019 & 2032
- Table 45: Italy Balanced Solenoid Speaker Revenue (million) Forecast, by Application 2019 & 2032
- Table 46: Italy Balanced Solenoid Speaker Volume (K) Forecast, by Application 2019 & 2032
- Table 47: Spain Balanced Solenoid Speaker Revenue (million) Forecast, by Application 2019 & 2032
- Table 48: Spain Balanced Solenoid Speaker Volume (K) Forecast, by Application 2019 & 2032
- Table 49: Russia Balanced Solenoid Speaker Revenue (million) Forecast, by Application 2019 & 2032
- Table 50: Russia Balanced Solenoid Speaker Volume (K) Forecast, by Application 2019 & 2032
- Table 51: Benelux Balanced Solenoid Speaker Revenue (million) Forecast, by Application 2019 & 2032
- Table 52: Benelux Balanced Solenoid Speaker Volume (K) Forecast, by Application 2019 & 2032
- Table 53: Nordics Balanced Solenoid Speaker Revenue (million) Forecast, by Application 2019 & 2032
- Table 54: Nordics Balanced Solenoid Speaker Volume (K) Forecast, by Application 2019 & 2032
- Table 55: Rest of Europe Balanced Solenoid Speaker Revenue (million) Forecast, by Application 2019 & 2032
- Table 56: Rest of Europe Balanced Solenoid Speaker Volume (K) Forecast, by Application 2019 & 2032
- Table 57: Global Balanced Solenoid Speaker Revenue million Forecast, by Application 2019 & 2032
- Table 58: Global Balanced Solenoid Speaker Volume K Forecast, by Application 2019 & 2032
- Table 59: Global Balanced Solenoid Speaker Revenue million Forecast, by Type 2019 & 2032
- Table 60: Global Balanced Solenoid Speaker Volume K Forecast, by Type 2019 & 2032
- Table 61: Global Balanced Solenoid Speaker Revenue million Forecast, by Country 2019 & 2032
- Table 62: Global Balanced Solenoid Speaker Volume K Forecast, by Country 2019 & 2032
- Table 63: Turkey Balanced Solenoid Speaker Revenue (million) Forecast, by Application 2019 & 2032
- Table 64: Turkey Balanced Solenoid Speaker Volume (K) Forecast, by Application 2019 & 2032
- Table 65: Israel Balanced Solenoid Speaker Revenue (million) Forecast, by Application 2019 & 2032
- Table 66: Israel Balanced Solenoid Speaker Volume (K) Forecast, by Application 2019 & 2032
- Table 67: GCC Balanced Solenoid Speaker Revenue (million) Forecast, by Application 2019 & 2032
- Table 68: GCC Balanced Solenoid Speaker Volume (K) Forecast, by Application 2019 & 2032
- Table 69: North Africa Balanced Solenoid Speaker Revenue (million) Forecast, by Application 2019 & 2032
- Table 70: North Africa Balanced Solenoid Speaker Volume (K) Forecast, by Application 2019 & 2032
- Table 71: South Africa Balanced Solenoid Speaker Revenue (million) Forecast, by Application 2019 & 2032
- Table 72: South Africa Balanced Solenoid Speaker Volume (K) Forecast, by Application 2019 & 2032
- Table 73: Rest of Middle East & Africa Balanced Solenoid Speaker Revenue (million) Forecast, by Application 2019 & 2032
- Table 74: Rest of Middle East & Africa Balanced Solenoid Speaker Volume (K) Forecast, by Application 2019 & 2032
- Table 75: Global Balanced Solenoid Speaker Revenue million Forecast, by Application 2019 & 2032
- Table 76: Global Balanced Solenoid Speaker Volume K Forecast, by Application 2019 & 2032
- Table 77: Global Balanced Solenoid Speaker Revenue million Forecast, by Type 2019 & 2032
- Table 78: Global Balanced Solenoid Speaker Volume K Forecast, by Type 2019 & 2032
- Table 79: Global Balanced Solenoid Speaker Revenue million Forecast, by Country 2019 & 2032
- Table 80: Global Balanced Solenoid Speaker Volume K Forecast, by Country 2019 & 2032
- Table 81: China Balanced Solenoid Speaker Revenue (million) Forecast, by Application 2019 & 2032
- Table 82: China Balanced Solenoid Speaker Volume (K) Forecast, by Application 2019 & 2032
- Table 83: India Balanced Solenoid Speaker Revenue (million) Forecast, by Application 2019 & 2032
- Table 84: India Balanced Solenoid Speaker Volume (K) Forecast, by Application 2019 & 2032
- Table 85: Japan Balanced Solenoid Speaker Revenue (million) Forecast, by Application 2019 & 2032
- Table 86: Japan Balanced Solenoid Speaker Volume (K) Forecast, by Application 2019 & 2032
- Table 87: South Korea Balanced Solenoid Speaker Revenue (million) Forecast, by Application 2019 & 2032
- Table 88: South Korea Balanced Solenoid Speaker Volume (K) Forecast, by Application 2019 & 2032
- Table 89: ASEAN Balanced Solenoid Speaker Revenue (million) Forecast, by Application 2019 & 2032
- Table 90: ASEAN Balanced Solenoid Speaker Volume (K) Forecast, by Application 2019 & 2032
- Table 91: Oceania Balanced Solenoid Speaker Revenue (million) Forecast, by Application 2019 & 2032
- Table 92: Oceania Balanced Solenoid Speaker Volume (K) Forecast, by Application 2019 & 2032
- Table 93: Rest of Asia Pacific Balanced Solenoid Speaker Revenue (million) Forecast, by Application 2019 & 2032
- Table 94: Rest of Asia Pacific Balanced Solenoid Speaker Volume (K) Forecast, by Application 2019 & 2032
Frequently Asked Questions
1. What is the projected Compound Annual Growth Rate (CAGR) of the Balanced Solenoid Speaker?
The projected CAGR is approximately XXX%.
2. Which companies are prominent players in the Balanced Solenoid Speaker?
Key companies in the market include Knowles, Sonion, Bellsing, Sony, Klippel, BOSCH, GE, SYT Audio.
3. What are the main segments of the Balanced Solenoid Speaker?
The market segments include Application, Type.
4. Can you provide details about the market size?
The market size is estimated to be USD XXX million as of 2022.
5. What are some drivers contributing to market growth?
N/A
6. What are the notable trends driving market growth?
N/A
7. Are there any restraints impacting market growth?
N/A
8. Can you provide examples of recent developments in the market?
N/A
9. What pricing options are available for accessing the report?
Pricing options include single-user, multi-user, and enterprise licenses priced at USD 3950.00, USD 5925.00, and USD 7900.00 respectively.
10. Is the market size provided in terms of value or volume?
The market size is provided in terms of value, measured in million and volume, measured in K.
11. Are there any specific market keywords associated with the report?
Yes, the market keyword associated with the report is "Balanced Solenoid Speaker," which aids in identifying and referencing the specific market segment covered.
12. How do I determine which pricing option suits my needs best?
The pricing options vary based on user requirements and access needs. Individual users may opt for single-user licenses, while businesses requiring broader access may choose multi-user or enterprise licenses for cost-effective access to the report.
13. Are there any additional resources or data provided in the Balanced Solenoid Speaker report?
While the report offers comprehensive insights, it's advisable to review the specific contents or supplementary materials provided to ascertain if additional resources or data are available.
14. How can I stay updated on further developments or reports in the Balanced Solenoid Speaker?
To stay informed about further developments, trends, and reports in the Balanced Solenoid Speaker, consider subscribing to industry newsletters, following relevant companies and organizations, or regularly checking reputable industry news sources and publications.
Methodology
Step 1 - Identification of Relevant Samples Size from Population Database


Step 2 - Approaches for Defining Global Market Size (Value, Volume* & Price*)

Note*: In applicable scenarios
Step 3 - Data Sources
Primary Research
- Web Analytics
- Survey Reports
- Research Institute
- Latest Research Reports
- Opinion Leaders
Secondary Research
- Annual Reports
- White Paper
- Latest Press Release
- Industry Association
- Paid Database
- Investor Presentations

Step 4 - Data Triangulation
Involves using different sources of information in order to increase the validity of a study
These sources are likely to be stakeholders in a program - participants, other researchers, program staff, other community members, and so on.
Then we put all data in single framework & apply various statistical tools to find out the dynamic on the market.
During the analysis stage, feedback from the stakeholder groups would be compared to determine areas of agreement as well as areas of divergence


