

Key Insights
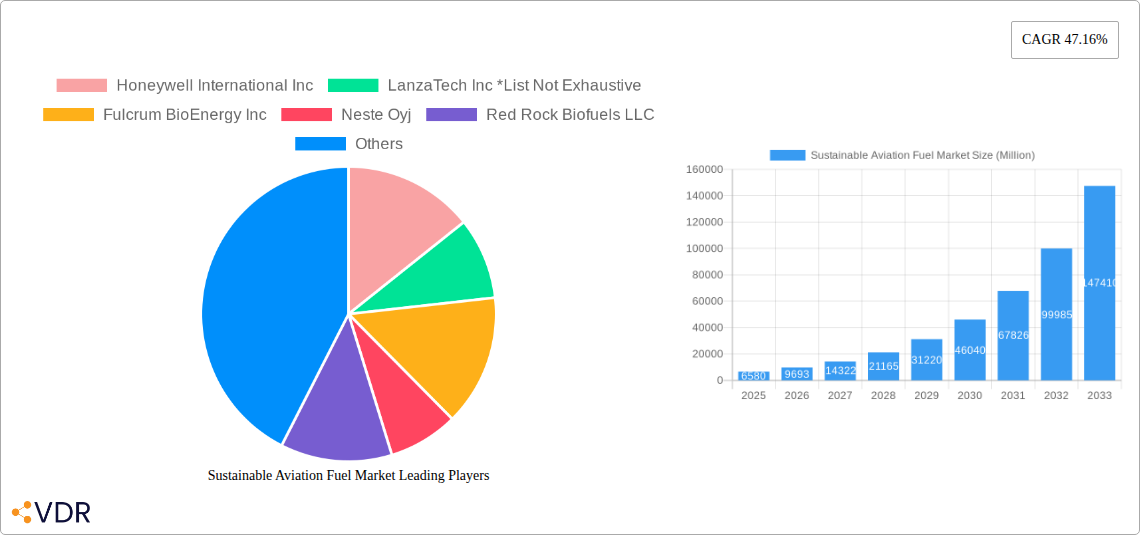
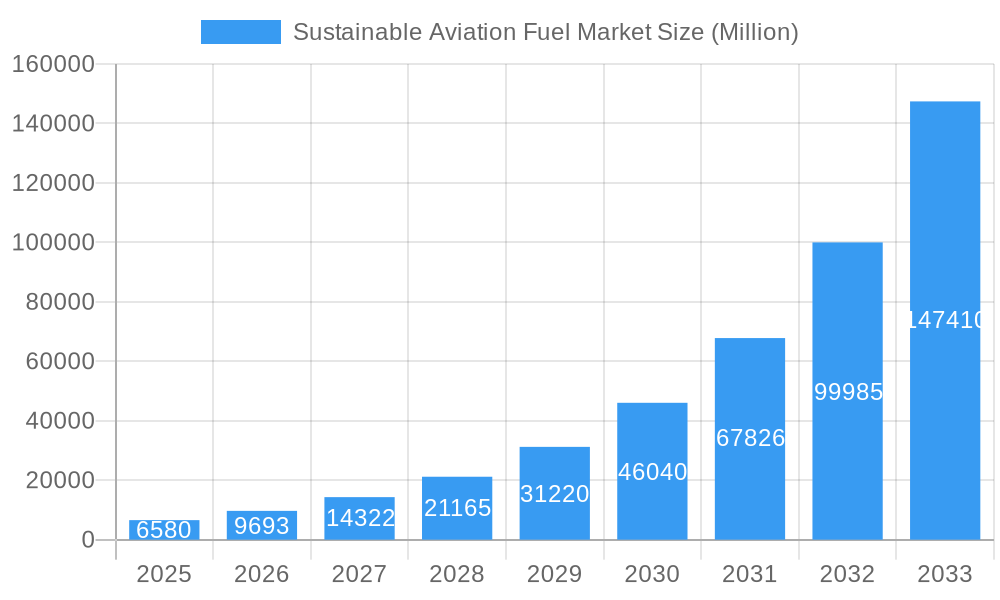
The Sustainable Aviation Fuel (SAF) market is experiencing explosive growth, projected to reach a market size of $6.58 billion in 2025, expanding at a remarkable Compound Annual Growth Rate (CAGR) of 47.16%. This surge is driven by increasing global awareness of climate change and stringent regulations aimed at reducing aviation's carbon footprint. Government mandates, coupled with a growing commitment from airlines to achieve net-zero emissions targets, are major catalysts. Technological advancements in SAF production, particularly in Fischer-Tropsch (FT) synthesis, Hydroprocessed Esters and Fatty Acids (HEFA), Synthesized Iso-Paraffinic (SIP), and Alcohol-to-Jet (AJT) technologies, are further accelerating market expansion. The commercial aviation sector currently dominates application, but the defense sector is also showing significant growth potential due to the increasing focus on sustainable practices in military operations. Key players like Honeywell International Inc., LanzaTech Inc., Neste Oyj, and others are actively investing in research and development and scaling up production capacities to meet the soaring demand. The geographic distribution reveals strong growth across North America, Europe, and Asia-Pacific, with emerging markets in South America and the Middle East and Africa also contributing to overall market expansion.
Sustainable Aviation Fuel Market Market Size (In Billion)
The market's growth trajectory is expected to remain robust through 2033. Continued innovation in feedstock utilization, including waste materials and non-food crops, will be crucial in ensuring the sustainable and scalable production of SAF. Furthermore, overcoming challenges related to infrastructure development, including the need for dedicated storage and distribution networks, and securing adequate funding for large-scale production plants, will be pivotal in sustaining this impressive growth. Competition amongst existing players and the emergence of new entrants will also shape the market landscape. The focus on cost reduction and efficiency improvements across the entire value chain will be crucial in ensuring the widespread adoption of SAF and the achievement of ambitious sustainability goals within the aviation industry.
Sustainable Aviation Fuel Market Company Market Share
Sustainable Aviation Fuel (SAF) Market Report: 2019-2033
This comprehensive report provides a detailed analysis of the Sustainable Aviation Fuel (SAF) market, encompassing market dynamics, growth trends, regional dominance, product landscapes, key players, and future outlooks. The study period spans from 2019 to 2033, with 2025 as the base and estimated year. The report is crucial for industry professionals, investors, and policymakers seeking to understand and capitalize on this rapidly evolving market. The report delves into the parent market of renewable fuels and the child market of aviation fuels specifically, providing a granular view of market segmentation and opportunities.
Sustainable Aviation Fuel Market Market Dynamics & Structure
The Sustainable Aviation Fuel (SAF) market is characterized by increasing market concentration amongst key players, driven by technological advancements and significant investments. Regulatory frameworks are evolving rapidly, incentivizing SAF adoption and shaping the competitive landscape. While traditional fossil fuels remain dominant, the increasing pressure for decarbonization fuels the substitution towards SAF.
- Market Concentration: The market is moderately concentrated, with key players holding xx% market share in 2025. This is expected to shift slightly by 2033, with larger players potentially consolidating market share through mergers and acquisitions (M&A).
- Technological Innovation: Ongoing R&D focuses on improving the efficiency and cost-effectiveness of SAF production technologies, including Fischer-Tropsch (FT), Hydroprocessed Esters and Fatty Acids (HEFA), Synthesized Iso-Paraffinic (SIP), and Alcohol-to-Jet (AJT). Barriers to innovation include high capital expenditure requirements and the need for scalable, sustainable feedstock sources.
- Regulatory Landscape: Government policies and mandates are key drivers, with many countries implementing regulations and incentives to promote SAF adoption. Carbon pricing mechanisms and sustainability standards significantly influence market growth.
- Competitive Substitutes: Currently, fossil-based jet fuel is the primary substitute, but the increasing cost of carbon emissions and environmental regulations is driving the shift towards SAF.
- End-User Demographics: The primary end-users are commercial airlines, followed by defense and potentially industrial applications. The market is segmented by these applications and their differing requirements and growth trajectories.
- M&A Trends: The number of M&A deals in the SAF sector is increasing, reflecting the consolidation of the market and the need for access to technology and feedstocks. We estimate xx M&A deals occurred between 2019 and 2024, with a predicted xx increase by 2033.
Sustainable Aviation Fuel Market Growth Trends & Insights
The SAF market is experiencing rapid growth, driven by stringent emission reduction targets and increasing environmental awareness. The market size is projected to reach xx Million by 2033, exhibiting a Compound Annual Growth Rate (CAGR) of xx% during the forecast period (2025-2033). Market penetration is also increasing, with SAF currently accounting for xx% of total aviation fuel consumption in 2025, projected to reach xx% by 2033. This growth is fueled by technological breakthroughs in production processes and a growing acceptance by airlines and other key stakeholders. The shift in consumer preference towards sustainable travel options further accelerates this growth.
Dominant Regions, Countries, or Segments in Sustainable Aviation Fuel Market
North America and Europe are currently the leading regions for SAF production and consumption, driven by robust regulatory frameworks and substantial investments in renewable energy infrastructure. However, the Asia-Pacific region shows significant growth potential due to the increasing air travel demand and government support for renewable energy initiatives.
- Technology: HEFA currently holds the largest market share in 2025, followed by FT. However, AJT and SIP technologies are anticipated to gain significant traction in the coming years due to continuous advancements and potential cost reductions.
- Application: The commercial aviation segment dominates the market, accounting for xx% of the total consumption in 2025. However, the defense and industrial sectors are expected to witness increased adoption in the coming years, driving further market expansion.
- Key Drivers:
- Supportive government policies and mandates
- Increasing demand for sustainable aviation fuels due to growing environmental concerns
- Technological advancements in SAF production and cost reduction
- Investments in renewable feedstock production
- Growing collaboration between airlines, fuel producers, and technology providers.
Sustainable Aviation Fuel Market Product Landscape
The SAF market offers a diverse range of products derived from various feedstocks, each possessing unique characteristics and applications. These products are continually being refined to enhance their performance metrics, such as energy density, stability, and compatibility with existing aviation infrastructure. Key innovations involve improving the efficiency and sustainability of the feedstock production processes, alongside advancements in refining and blending technologies to maximize the blending potential of SAF with conventional jet fuels.
Key Drivers, Barriers & Challenges in Sustainable Aviation Fuel Market
Key Drivers:
- Stringent environmental regulations and carbon emission reduction targets are the primary drivers pushing for the adoption of sustainable aviation fuel.
- Growing consumer awareness and demand for sustainable travel options is driving airlines and fuel producers to invest in SAF.
- Technological advancements are continuously improving the cost-effectiveness and efficiency of SAF production.
Key Challenges:
- High production costs, limiting the widespread adoption of SAF compared to conventional jet fuel. Current estimates indicate SAF costs xx% more than conventional fuel.
- Limited availability of sustainable feedstocks (e.g., waste oils, biomass) needed for SAF production, creating supply chain bottlenecks.
- Complexity in blending SAF with conventional jet fuel and ensuring compliance with aviation industry standards.
Emerging Opportunities in Sustainable Aviation Fuel Market
- Untapped Markets: Developing economies with growing aviation sectors present significant opportunities for SAF market expansion.
- Innovative Applications: Exploring the potential for using SAF in other sectors, such as maritime transport.
- Evolving Consumer Preferences: The increasing demand for sustainable travel is creating a strong pull for airlines to utilize SAF.
Growth Accelerators in the Sustainable Aviation Fuel Market Industry
Technological breakthroughs in SAF production are significantly reducing production costs and enhancing efficiency, making SAF a more economically viable alternative. Strategic partnerships between airlines, fuel producers, and technology providers are accelerating the development and deployment of SAF infrastructure. Furthermore, expanding the range of sustainable feedstocks used in SAF production is strengthening the resilience and sustainability of the market.
Key Players Shaping the Sustainable Aviation Fuel Market Market
- Honeywell International Inc
- LanzaTech Inc
- Fulcrum BioEnergy Inc
- Neste Oyj
- Red Rock Biofuels LLC
- Swedish Biofuels AB
- SG Preston Company
- TotalEnergies SE
- Gevo Inc
Notable Milestones in Sustainable Aviation Fuel Market Sector
- May 2023: Twelve and Etihad Airways signed an MOU to advance E-Jet® fuel.
- February 2022: Engie SA and Infinium Holdings announced a EUR 500 million project for renewable fuels.
- February 2022: Boeing announced a supply agreement for two million gallons of blended SAF with EPIC Fuels.
In-Depth Sustainable Aviation Fuel Market Market Outlook
The future of the SAF market looks promising, with continued growth driven by technological advancements, supportive government policies, and increasing consumer demand for sustainable travel. Strategic partnerships and investments in renewable feedstock production will play a crucial role in shaping the future market landscape. The market is expected to see significant expansion in the coming years, presenting lucrative opportunities for investors and industry players alike.
Sustainable Aviation Fuel Market Segmentation
-
1. Technology
- 1.1. Fischer-Tropsch (FT)
- 1.2. Hydroprocessed Esters and Fatty Acids (HEFA)
- 1.3. Synthesi
-
2. Application
- 2.1. Commercial
- 2.2. Defense
Sustainable Aviation Fuel Market Segmentation By Geography
-
1. North America
- 1.1. United States of America
- 1.2. Canada
- 1.3. Rest of the North America
-
2. Asia Pacific
- 2.1. China
- 2.2. India
- 2.3. Japan
- 2.4. Rest of the Asia Pacific
-
3. Europe
- 3.1. United Kingdom
- 3.2. France
- 3.3. Germany
- 3.4. Rest of the Europe
-
4. South America
- 4.1. Brazil
- 4.2. Argentina
- 4.3. Rest of the South America
-
5. Middle East and Africa
- 5.1. United Arab Emirates
- 5.2. Saudi Arabia
- 5.3. Qatar
- 5.4. Rest of the Middle East and Africa
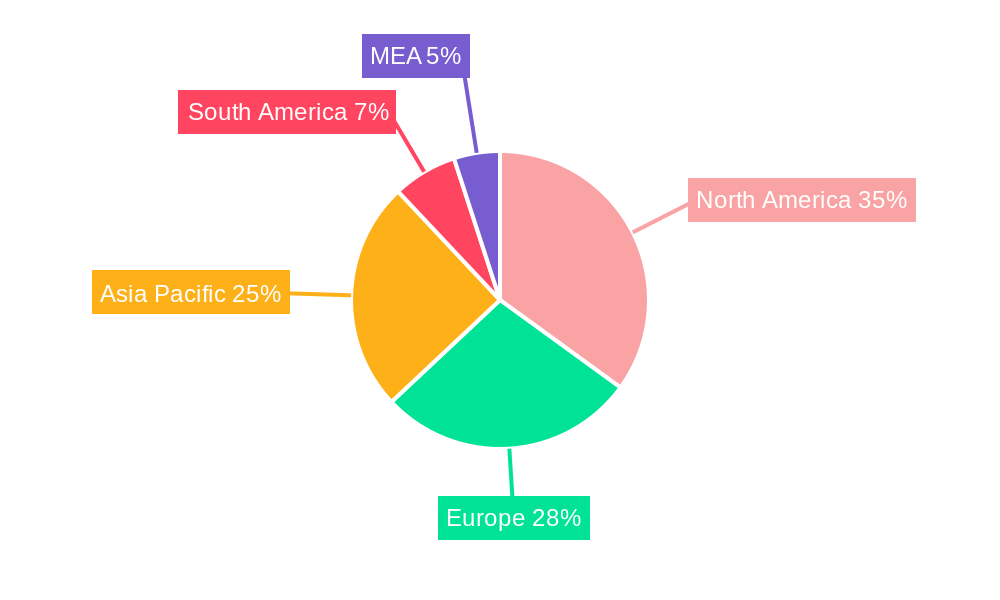
Sustainable Aviation Fuel Market Regional Market Share
Geographic Coverage of Sustainable Aviation Fuel Market
Sustainable Aviation Fuel Market REPORT HIGHLIGHTS
| Aspects | Details |
|---|---|
| Study Period | 2020-2034 |
| Base Year | 2025 |
| Estimated Year | 2026 |
| Forecast Period | 2026-2034 |
| Historical Period | 2020-2025 |
| Growth Rate | CAGR of 47.16% from 2020-2034 |
| Segmentation |
|
Table of Contents
- 1. Introduction
- 1.1. Research Scope
- 1.2. Market Segmentation
- 1.3. Research Methodology
- 1.4. Definitions and Assumptions
- 2. Executive Summary
- 2.1. Introduction
- 3. Market Dynamics
- 3.1. Introduction
- 3.2. Market Drivers
- 3.2.1. 4.; Increased Government Regulations for Greenhouse Gas Emissions 4.; Encouraging Production and Consumption of Renewable Aviation Fuel
- 3.3. Market Restrains
- 3.3.1. 4.; The High Costs of Renewable Aviation Fuel
- 3.4. Market Trends
- 3.4.1. Hydroprocessed Esters and Fatty Acids (HEFA) Technology to Dominate the Market
- 4. Market Factor Analysis
- 4.1. Porters Five Forces
- 4.2. Supply/Value Chain
- 4.3. PESTEL analysis
- 4.4. Market Entropy
- 4.5. Patent/Trademark Analysis
- 5. Global Sustainable Aviation Fuel Market Analysis, Insights and Forecast, 2020-2032
- 5.1. Market Analysis, Insights and Forecast - by Technology
- 5.1.1. Fischer-Tropsch (FT)
- 5.1.2. Hydroprocessed Esters and Fatty Acids (HEFA)
- 5.1.3. Synthesi
- 5.2. Market Analysis, Insights and Forecast - by Application
- 5.2.1. Commercial
- 5.2.2. Defense
- 5.3. Market Analysis, Insights and Forecast - by Region
- 5.3.1. North America
- 5.3.2. Asia Pacific
- 5.3.3. Europe
- 5.3.4. South America
- 5.3.5. Middle East and Africa
- 5.1. Market Analysis, Insights and Forecast - by Technology
- 6. North America Sustainable Aviation Fuel Market Analysis, Insights and Forecast, 2020-2032
- 6.1. Market Analysis, Insights and Forecast - by Technology
- 6.1.1. Fischer-Tropsch (FT)
- 6.1.2. Hydroprocessed Esters and Fatty Acids (HEFA)
- 6.1.3. Synthesi
- 6.2. Market Analysis, Insights and Forecast - by Application
- 6.2.1. Commercial
- 6.2.2. Defense
- 6.1. Market Analysis, Insights and Forecast - by Technology
- 7. Asia Pacific Sustainable Aviation Fuel Market Analysis, Insights and Forecast, 2020-2032
- 7.1. Market Analysis, Insights and Forecast - by Technology
- 7.1.1. Fischer-Tropsch (FT)
- 7.1.2. Hydroprocessed Esters and Fatty Acids (HEFA)
- 7.1.3. Synthesi
- 7.2. Market Analysis, Insights and Forecast - by Application
- 7.2.1. Commercial
- 7.2.2. Defense
- 7.1. Market Analysis, Insights and Forecast - by Technology
- 8. Europe Sustainable Aviation Fuel Market Analysis, Insights and Forecast, 2020-2032
- 8.1. Market Analysis, Insights and Forecast - by Technology
- 8.1.1. Fischer-Tropsch (FT)
- 8.1.2. Hydroprocessed Esters and Fatty Acids (HEFA)
- 8.1.3. Synthesi
- 8.2. Market Analysis, Insights and Forecast - by Application
- 8.2.1. Commercial
- 8.2.2. Defense
- 8.1. Market Analysis, Insights and Forecast - by Technology
- 9. South America Sustainable Aviation Fuel Market Analysis, Insights and Forecast, 2020-2032
- 9.1. Market Analysis, Insights and Forecast - by Technology
- 9.1.1. Fischer-Tropsch (FT)
- 9.1.2. Hydroprocessed Esters and Fatty Acids (HEFA)
- 9.1.3. Synthesi
- 9.2. Market Analysis, Insights and Forecast - by Application
- 9.2.1. Commercial
- 9.2.2. Defense
- 9.1. Market Analysis, Insights and Forecast - by Technology
- 10. Middle East and Africa Sustainable Aviation Fuel Market Analysis, Insights and Forecast, 2020-2032
- 10.1. Market Analysis, Insights and Forecast - by Technology
- 10.1.1. Fischer-Tropsch (FT)
- 10.1.2. Hydroprocessed Esters and Fatty Acids (HEFA)
- 10.1.3. Synthesi
- 10.2. Market Analysis, Insights and Forecast - by Application
- 10.2.1. Commercial
- 10.2.2. Defense
- 10.1. Market Analysis, Insights and Forecast - by Technology
- 11. Competitive Analysis
- 11.1. Global Market Share Analysis 2025
- 11.2. Company Profiles
- 11.2.1 Honeywell International Inc
- 11.2.1.1. Overview
- 11.2.1.2. Products
- 11.2.1.3. SWOT Analysis
- 11.2.1.4. Recent Developments
- 11.2.1.5. Financials (Based on Availability)
- 11.2.2 LanzaTech Inc *List Not Exhaustive
- 11.2.2.1. Overview
- 11.2.2.2. Products
- 11.2.2.3. SWOT Analysis
- 11.2.2.4. Recent Developments
- 11.2.2.5. Financials (Based on Availability)
- 11.2.3 Fulcrum BioEnergy Inc
- 11.2.3.1. Overview
- 11.2.3.2. Products
- 11.2.3.3. SWOT Analysis
- 11.2.3.4. Recent Developments
- 11.2.3.5. Financials (Based on Availability)
- 11.2.4 Neste Oyj
- 11.2.4.1. Overview
- 11.2.4.2. Products
- 11.2.4.3. SWOT Analysis
- 11.2.4.4. Recent Developments
- 11.2.4.5. Financials (Based on Availability)
- 11.2.5 Red Rock Biofuels LLC
- 11.2.5.1. Overview
- 11.2.5.2. Products
- 11.2.5.3. SWOT Analysis
- 11.2.5.4. Recent Developments
- 11.2.5.5. Financials (Based on Availability)
- 11.2.6 Swedish Biofuels AB
- 11.2.6.1. Overview
- 11.2.6.2. Products
- 11.2.6.3. SWOT Analysis
- 11.2.6.4. Recent Developments
- 11.2.6.5. Financials (Based on Availability)
- 11.2.7 SG Preston Company
- 11.2.7.1. Overview
- 11.2.7.2. Products
- 11.2.7.3. SWOT Analysis
- 11.2.7.4. Recent Developments
- 11.2.7.5. Financials (Based on Availability)
- 11.2.8 TotalEnergies SE
- 11.2.8.1. Overview
- 11.2.8.2. Products
- 11.2.8.3. SWOT Analysis
- 11.2.8.4. Recent Developments
- 11.2.8.5. Financials (Based on Availability)
- 11.2.9 Gevo Inc
- 11.2.9.1. Overview
- 11.2.9.2. Products
- 11.2.9.3. SWOT Analysis
- 11.2.9.4. Recent Developments
- 11.2.9.5. Financials (Based on Availability)
- 11.2.1 Honeywell International Inc
List of Figures
- Figure 1: Global Sustainable Aviation Fuel Market Revenue Breakdown (Million, %) by Region 2025 & 2033
- Figure 2: North America Sustainable Aviation Fuel Market Revenue (Million), by Technology 2025 & 2033
- Figure 3: North America Sustainable Aviation Fuel Market Revenue Share (%), by Technology 2025 & 2033
- Figure 4: North America Sustainable Aviation Fuel Market Revenue (Million), by Application 2025 & 2033
- Figure 5: North America Sustainable Aviation Fuel Market Revenue Share (%), by Application 2025 & 2033
- Figure 6: North America Sustainable Aviation Fuel Market Revenue (Million), by Country 2025 & 2033
- Figure 7: North America Sustainable Aviation Fuel Market Revenue Share (%), by Country 2025 & 2033
- Figure 8: Asia Pacific Sustainable Aviation Fuel Market Revenue (Million), by Technology 2025 & 2033
- Figure 9: Asia Pacific Sustainable Aviation Fuel Market Revenue Share (%), by Technology 2025 & 2033
- Figure 10: Asia Pacific Sustainable Aviation Fuel Market Revenue (Million), by Application 2025 & 2033
- Figure 11: Asia Pacific Sustainable Aviation Fuel Market Revenue Share (%), by Application 2025 & 2033
- Figure 12: Asia Pacific Sustainable Aviation Fuel Market Revenue (Million), by Country 2025 & 2033
- Figure 13: Asia Pacific Sustainable Aviation Fuel Market Revenue Share (%), by Country 2025 & 2033
- Figure 14: Europe Sustainable Aviation Fuel Market Revenue (Million), by Technology 2025 & 2033
- Figure 15: Europe Sustainable Aviation Fuel Market Revenue Share (%), by Technology 2025 & 2033
- Figure 16: Europe Sustainable Aviation Fuel Market Revenue (Million), by Application 2025 & 2033
- Figure 17: Europe Sustainable Aviation Fuel Market Revenue Share (%), by Application 2025 & 2033
- Figure 18: Europe Sustainable Aviation Fuel Market Revenue (Million), by Country 2025 & 2033
- Figure 19: Europe Sustainable Aviation Fuel Market Revenue Share (%), by Country 2025 & 2033
- Figure 20: South America Sustainable Aviation Fuel Market Revenue (Million), by Technology 2025 & 2033
- Figure 21: South America Sustainable Aviation Fuel Market Revenue Share (%), by Technology 2025 & 2033
- Figure 22: South America Sustainable Aviation Fuel Market Revenue (Million), by Application 2025 & 2033
- Figure 23: South America Sustainable Aviation Fuel Market Revenue Share (%), by Application 2025 & 2033
- Figure 24: South America Sustainable Aviation Fuel Market Revenue (Million), by Country 2025 & 2033
- Figure 25: South America Sustainable Aviation Fuel Market Revenue Share (%), by Country 2025 & 2033
- Figure 26: Middle East and Africa Sustainable Aviation Fuel Market Revenue (Million), by Technology 2025 & 2033
- Figure 27: Middle East and Africa Sustainable Aviation Fuel Market Revenue Share (%), by Technology 2025 & 2033
- Figure 28: Middle East and Africa Sustainable Aviation Fuel Market Revenue (Million), by Application 2025 & 2033
- Figure 29: Middle East and Africa Sustainable Aviation Fuel Market Revenue Share (%), by Application 2025 & 2033
- Figure 30: Middle East and Africa Sustainable Aviation Fuel Market Revenue (Million), by Country 2025 & 2033
- Figure 31: Middle East and Africa Sustainable Aviation Fuel Market Revenue Share (%), by Country 2025 & 2033
List of Tables
- Table 1: Global Sustainable Aviation Fuel Market Revenue Million Forecast, by Technology 2020 & 2033
- Table 2: Global Sustainable Aviation Fuel Market Revenue Million Forecast, by Application 2020 & 2033
- Table 3: Global Sustainable Aviation Fuel Market Revenue Million Forecast, by Region 2020 & 2033
- Table 4: Global Sustainable Aviation Fuel Market Revenue Million Forecast, by Technology 2020 & 2033
- Table 5: Global Sustainable Aviation Fuel Market Revenue Million Forecast, by Application 2020 & 2033
- Table 6: Global Sustainable Aviation Fuel Market Revenue Million Forecast, by Country 2020 & 2033
- Table 7: United States of America Sustainable Aviation Fuel Market Revenue (Million) Forecast, by Application 2020 & 2033
- Table 8: Canada Sustainable Aviation Fuel Market Revenue (Million) Forecast, by Application 2020 & 2033
- Table 9: Rest of the North America Sustainable Aviation Fuel Market Revenue (Million) Forecast, by Application 2020 & 2033
- Table 10: Global Sustainable Aviation Fuel Market Revenue Million Forecast, by Technology 2020 & 2033
- Table 11: Global Sustainable Aviation Fuel Market Revenue Million Forecast, by Application 2020 & 2033
- Table 12: Global Sustainable Aviation Fuel Market Revenue Million Forecast, by Country 2020 & 2033
- Table 13: China Sustainable Aviation Fuel Market Revenue (Million) Forecast, by Application 2020 & 2033
- Table 14: India Sustainable Aviation Fuel Market Revenue (Million) Forecast, by Application 2020 & 2033
- Table 15: Japan Sustainable Aviation Fuel Market Revenue (Million) Forecast, by Application 2020 & 2033
- Table 16: Rest of the Asia Pacific Sustainable Aviation Fuel Market Revenue (Million) Forecast, by Application 2020 & 2033
- Table 17: Global Sustainable Aviation Fuel Market Revenue Million Forecast, by Technology 2020 & 2033
- Table 18: Global Sustainable Aviation Fuel Market Revenue Million Forecast, by Application 2020 & 2033
- Table 19: Global Sustainable Aviation Fuel Market Revenue Million Forecast, by Country 2020 & 2033
- Table 20: United Kingdom Sustainable Aviation Fuel Market Revenue (Million) Forecast, by Application 2020 & 2033
- Table 21: France Sustainable Aviation Fuel Market Revenue (Million) Forecast, by Application 2020 & 2033
- Table 22: Germany Sustainable Aviation Fuel Market Revenue (Million) Forecast, by Application 2020 & 2033
- Table 23: Rest of the Europe Sustainable Aviation Fuel Market Revenue (Million) Forecast, by Application 2020 & 2033
- Table 24: Global Sustainable Aviation Fuel Market Revenue Million Forecast, by Technology 2020 & 2033
- Table 25: Global Sustainable Aviation Fuel Market Revenue Million Forecast, by Application 2020 & 2033
- Table 26: Global Sustainable Aviation Fuel Market Revenue Million Forecast, by Country 2020 & 2033
- Table 27: Brazil Sustainable Aviation Fuel Market Revenue (Million) Forecast, by Application 2020 & 2033
- Table 28: Argentina Sustainable Aviation Fuel Market Revenue (Million) Forecast, by Application 2020 & 2033
- Table 29: Rest of the South America Sustainable Aviation Fuel Market Revenue (Million) Forecast, by Application 2020 & 2033
- Table 30: Global Sustainable Aviation Fuel Market Revenue Million Forecast, by Technology 2020 & 2033
- Table 31: Global Sustainable Aviation Fuel Market Revenue Million Forecast, by Application 2020 & 2033
- Table 32: Global Sustainable Aviation Fuel Market Revenue Million Forecast, by Country 2020 & 2033
- Table 33: United Arab Emirates Sustainable Aviation Fuel Market Revenue (Million) Forecast, by Application 2020 & 2033
- Table 34: Saudi Arabia Sustainable Aviation Fuel Market Revenue (Million) Forecast, by Application 2020 & 2033
- Table 35: Qatar Sustainable Aviation Fuel Market Revenue (Million) Forecast, by Application 2020 & 2033
- Table 36: Rest of the Middle East and Africa Sustainable Aviation Fuel Market Revenue (Million) Forecast, by Application 2020 & 2033
Frequently Asked Questions
1. What is the projected Compound Annual Growth Rate (CAGR) of the Sustainable Aviation Fuel Market?
The projected CAGR is approximately 47.16%.
2. Which companies are prominent players in the Sustainable Aviation Fuel Market?
Key companies in the market include Honeywell International Inc, LanzaTech Inc *List Not Exhaustive, Fulcrum BioEnergy Inc, Neste Oyj, Red Rock Biofuels LLC, Swedish Biofuels AB, SG Preston Company, TotalEnergies SE, Gevo Inc.
3. What are the main segments of the Sustainable Aviation Fuel Market?
The market segments include Technology, Application.
4. Can you provide details about the market size?
The market size is estimated to be USD 6.58 Million as of 2022.
5. What are some drivers contributing to market growth?
4.; Increased Government Regulations for Greenhouse Gas Emissions 4.; Encouraging Production and Consumption of Renewable Aviation Fuel.
6. What are the notable trends driving market growth?
Hydroprocessed Esters and Fatty Acids (HEFA) Technology to Dominate the Market.
7. Are there any restraints impacting market growth?
4.; The High Costs of Renewable Aviation Fuel.
8. Can you provide examples of recent developments in the market?
In May 2023, Twelve and Etihad Airways, the national carrier of the United Arab Emirates, signed a Memorandum of Understanding (MOU) to collaborate on the advancement of E-Jet® fuel, Twelve's sustainable aviation fuel (SAF) made from CO2 and renewable energy, as well as plans for an international demonstration flight and a supply roadmap that will support Etihad's sustainability strategy.
9. What pricing options are available for accessing the report?
Pricing options include single-user, multi-user, and enterprise licenses priced at USD 4750, USD 5250, and USD 8750 respectively.
10. Is the market size provided in terms of value or volume?
The market size is provided in terms of value, measured in Million.
11. Are there any specific market keywords associated with the report?
Yes, the market keyword associated with the report is "Sustainable Aviation Fuel Market," which aids in identifying and referencing the specific market segment covered.
12. How do I determine which pricing option suits my needs best?
The pricing options vary based on user requirements and access needs. Individual users may opt for single-user licenses, while businesses requiring broader access may choose multi-user or enterprise licenses for cost-effective access to the report.
13. Are there any additional resources or data provided in the Sustainable Aviation Fuel Market report?
While the report offers comprehensive insights, it's advisable to review the specific contents or supplementary materials provided to ascertain if additional resources or data are available.
14. How can I stay updated on further developments or reports in the Sustainable Aviation Fuel Market?
To stay informed about further developments, trends, and reports in the Sustainable Aviation Fuel Market, consider subscribing to industry newsletters, following relevant companies and organizations, or regularly checking reputable industry news sources and publications.
Methodology
Step 1 - Identification of Relevant Samples Size from Population Database


Step 2 - Approaches for Defining Global Market Size (Value, Volume* & Price*)

Note*: In applicable scenarios
Step 3 - Data Sources
Primary Research
- Web Analytics
- Survey Reports
- Research Institute
- Latest Research Reports
- Opinion Leaders
Secondary Research
- Annual Reports
- White Paper
- Latest Press Release
- Industry Association
- Paid Database
- Investor Presentations

Step 4 - Data Triangulation
Involves using different sources of information in order to increase the validity of a study
These sources are likely to be stakeholders in a program - participants, other researchers, program staff, other community members, and so on.
Then we put all data in single framework & apply various statistical tools to find out the dynamic on the market.
During the analysis stage, feedback from the stakeholder groups would be compared to determine areas of agreement as well as areas of divergence