Key Insights
The UK offshore oil and gas decommissioning market is projected for substantial growth, fueled by aging North Sea infrastructure and stringent regulatory mandates for the responsible dismantling of offshore assets. With a current market size of 11.1 billion and a Compound Annual Growth Rate (CAGR) of 6.5%, this sector presents significant opportunities for specialized service providers. Key growth drivers include the strategic need to reclaim valuable subsea real estate, mitigate environmental risks from legacy assets, and leverage accumulated expertise in managing complex decommissioning projects. The market's expansion is further supported by the continuous demand for advanced technologies and methodologies to ensure efficient, safe, and cost-effective removal of both shallow and deepwater installations. This commitment to sustainability and operational integrity underpins a strong future outlook for UK offshore decommissioning.
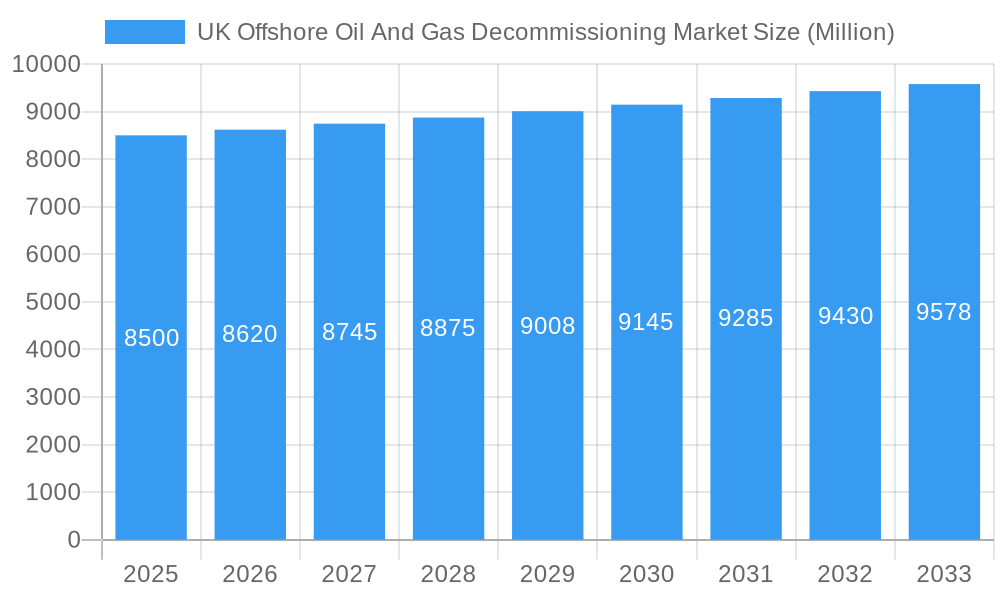
UK Offshore Oil And Gas Decommissioning Market Market Size (In Billion)
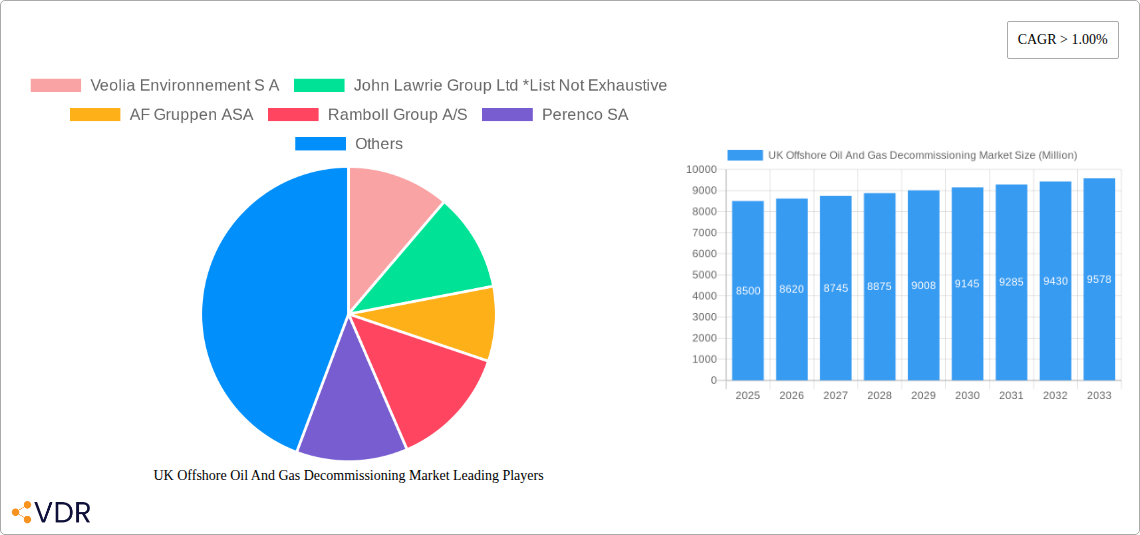
The market features a dynamic mix of established operators and emerging specialists, including notable companies such as Veolia Environnement S.A., John Lawrie Group Ltd, AF Gruppen ASA, Ramboll Group A/S, Perenco S.A., and Derrick Services (UK) Ltd. These companies offer a comprehensive range of services, from initial planning and engineering to physical dismantling and waste management. Emerging trends include the increased adoption of modular decommissioning techniques, the integration of digital technologies for enhanced project oversight, and a growing focus on the recycling and repurposing of salvaged materials. However, the market faces challenges such as high capital investment requirements for specialized equipment, the complexities of multi-jurisdictional regulatory compliance, and potential volatility in oil prices affecting decommissioning investment timelines. Despite these challenges, the aging asset base ensures sustained demand for decommissioning services across the UK.
UK Offshore Oil And Gas Decommissioning Market Company Market Share
This comprehensive report provides a critical analysis of the UK Offshore Oil and Gas Decommissioning Market, a sector poised for significant expansion driven by aging infrastructure and rigorous environmental regulations. The report covers the historical period from 2019 to 2024, with a base year of 2025, and forecasts growth through 2033, offering deep insights into market dynamics, growth catalysts, challenges, and key player strategies. Focusing on parent and child market segments, this study delivers actionable intelligence for stakeholders aiming to capitalize on the evolving UK decommissioning landscape.
UK Offshore Oil And Gas Decommissioning Market Market Dynamics & Structure
The UK Offshore Oil and Gas Decommissioning Market is characterized by a moderate level of market concentration, with several key players dominating specialized services. Technological innovation is a primary driver, focusing on cost-effective and environmentally sound decommissioning techniques, including advanced subsea cutting, robotics, and waste management solutions. Regulatory frameworks, spearheaded by authorities like the Offshore Petroleum Activities (Oil and Gas) Act, mandate responsible asset retirement, influencing project timelines and expenditure. Competitive product substitutes are limited due to the specialized nature of decommissioning, but alternative approaches to in-situ disposal versus removal are constantly being evaluated. End-user demographics include major oil and gas operators with aging North Sea assets, service companies, and regulatory bodies. Mergers and acquisitions (M&A) trends indicate consolidation among service providers to achieve economies of scale and broaden service offerings. For instance, the pursuit of integrated decommissioning solutions and early-stage engagement in asset life extension are key strategic imperatives.
- Market Concentration: Moderate, with a few dominant players in specialized niches.
- Technological Innovation: Driven by cost reduction, environmental compliance, and safety improvements.
- Regulatory Frameworks: Strict regulations compel decommissioning, creating sustained demand.
- Competitive Landscape: Focus on specialized expertise and integrated service delivery.
- M&A Trends: Consolidation to enhance capabilities and market reach.
UK Offshore Oil And Gas Decommissioning Market Growth Trends & Insights
The UK Offshore Oil and Gas Decommissioning Market is experiencing robust growth, projected to accelerate significantly over the forecast period. The substantial number of aging North Sea platforms and subsea infrastructure necessitates proactive decommissioning strategies, translating into an escalating demand for specialized services. Industry group Offshore Energies UK (OEUK) estimates that operations worth EUR 20 billion are set to be decommissioned, highlighting the immense scale of the opportunity. The adoption rate of advanced decommissioning technologies is increasing as operators seek to mitigate risks and minimize environmental impact. Technological disruptions, such as the integration of artificial intelligence for predictive maintenance and planning, are optimizing decommissioning workflows. Consumer behavior shifts are evident, with a growing emphasis on sustainability and corporate social responsibility influencing operator choices in selecting decommissioning partners. The market penetration of integrated decommissioning solutions, encompassing planning, execution, and waste management, is on an upward trajectory. The market is projected to grow at a Compound Annual Growth Rate (CAGR) of approximately 7.5% from 2025 to 2033. This growth is fueled by an increasing awareness of the long-term liabilities associated with inactive infrastructure and the proactive approach being adopted by the UK government and regulatory bodies to ensure a safe and environmentally responsible transition. The rising cost of offshore operations, coupled with the declining economic viability of older fields, further incentivizes operators to focus on decommissioning.
Dominant Regions, Countries, or Segments in UK Offshore Oil And Gas Decommissioning Market
The North Sea region is the undeniable epicenter of UK offshore oil and gas decommissioning activity, driving market growth and innovation. This dominance stems from its mature hydrocarbon basin, characterized by a significant concentration of aging platforms, subsea infrastructure, and numerous wells nearing the end of their economic lifecycle. The sheer volume of assets requiring decommissioning in this area makes it the primary market for specialized services.
- Economic Policies and Regulatory Frameworks: The UK government's commitment to energy transition and its robust regulatory framework for decommissioning, enforced by bodies like the Oil and Gas Authority (now North Sea Transition Authority), are pivotal. These policies ensure that operators are held accountable for the responsible abandonment of their assets, creating a sustained demand for decommissioning services. Tax incentives and financial support mechanisms further encourage timely decommissioning.
- Infrastructure and Supply Chain Maturity: The North Sea boasts a well-established and mature supply chain of specialized decommissioning contractors, vessel operators, and technology providers. This existing infrastructure facilitates efficient and cost-effective execution of decommissioning projects. The presence of experienced personnel and specialized equipment is a critical factor in the region's dominance.
- Market Share and Growth Potential: The North Sea accounts for over 90% of the current UK offshore decommissioning market. The projected decommissioning expenditure in the region underscores its immense growth potential. The identification of over 2,000 abandoned wells alone signifies a substantial pipeline of work for the coming years.
- Technological Advancement Hub: The challenges presented by the North Sea's complex environment have spurred significant technological advancements in decommissioning. Innovations in subsea robotics, cutting technologies, well plugging and abandonment techniques, and marine environmental monitoring are frequently developed and deployed in this region, setting global benchmarks.
Within the segments, Shallow Water decommissioning is currently the most active due to the higher concentration of older, shallower platforms and the relative ease and lower cost of access and removal. However, Deepwater and Ultra-Deep Water decommissioning presents a growing segment with increasing complexity and higher costs, demanding advanced technological solutions and specialized expertise, thereby offering significant growth potential as more assets in these environments mature. The ongoing research and development in deepwater techniques are crucial for unlocking this potential.
UK Offshore Oil And Gas Decommissioning Market Product Landscape
The product landscape in UK offshore oil and gas decommissioning is characterized by a suite of highly specialized services and technologies. These include advanced subsea cutting and removal systems, sophisticated well plugging and abandonment techniques, marine growth removal, and environmental monitoring solutions. Robotic systems for inspection and intervention are increasingly vital, minimizing human exposure to hazardous environments. Furthermore, innovative waste management and recycling technologies are crucial for handling decommissioned materials responsibly. The unique selling propositions lie in efficiency, cost-effectiveness, environmental stewardship, and unparalleled safety records. Technological advancements are focused on automation, remote operations, and materials science to tackle legacy infrastructure challenges effectively.
Key Drivers, Barriers & Challenges in UK Offshore Oil And Gas Decommissioning Market
Key Drivers: The primary forces propelling the UK Offshore Oil and Gas Decommissioning Market include the aging North Sea asset base, stringent environmental regulations mandating asset abandonment, and increasing operator focus on corporate social responsibility. Technological advancements in safer and more cost-effective decommissioning methods are also significant drivers. Furthermore, the government's commitment to energy transition and the decommissioning relief deeds play a crucial role.
Barriers & Challenges: Significant challenges include the high cost associated with decommissioning, particularly for deepwater assets, and the complexities of late-life asset management. Supply chain constraints, including the availability of specialized vessels and skilled personnel, can create bottlenecks. Regulatory uncertainty and the potential for scope creep in complex projects also pose challenges. Competitive pressures among service providers can impact pricing and profitability. The logistical complexities of operating in harsh offshore environments and the management of hazardous waste streams are ongoing hurdles.
Emerging Opportunities in UK Offshore Oil And Gas Decommissioning Market
Emerging opportunities lie in the development and deployment of novel decommissioning technologies, such as AI-driven predictive decommissioning planning and advanced robotics for autonomous operations. The growing focus on sustainability presents a significant opportunity for companies offering circular economy solutions for salvaged materials and environmentally friendly waste management practices. Untapped markets include the decommissioning of smaller, independent operator assets and the potential for international collaboration and knowledge transfer. The evolution of offshore wind infrastructure may also present integrated decommissioning synergies.
Growth Accelerators in the UK Offshore Oil And Gas Decommissioning Market Industry
Long-term growth in the UK Offshore Oil and Gas Decommissioning Market is being accelerated by technological breakthroughs in remote operations and subsea robotics, enhancing efficiency and safety. Strategic partnerships between major operators and specialized decommissioning service providers are crucial for bundled contracts and integrated solutions. Market expansion strategies, including the development of new service lines and the acquisition of complementary businesses, are also contributing to sustained growth. The increasing emphasis on decommissioning planning at the early stages of field development represents a significant growth accelerator, enabling more efficient and cost-effective execution.
Key Players Shaping the UK Offshore Oil And Gas Decommissioning Market Market
- Veolia Environnement S A
- John Lawrie Group Ltd
- AF Gruppen ASA
- Ramboll Group A/S
- Perenco SA
- Derrick Services (UK) Ltd
Notable Milestones in UK Offshore Oil And Gas Decommissioning Market Sector
- November 2022: Over 2,000 abandoned oil and gas wells in the North Sea identified for decommissioning, signaling a surge in activity with estimated operations worth EUR 20 billion. This insight from Offshore Energies UK (OEUK) underscores the significant market potential.
- September 2022: The UK's Nuclear Decommissioning Authority (NDA) and the National Decommissioning Centre (NDC) forged a three-year collaborative research agreement, marking a pioneering step in inter-industry knowledge sharing between nuclear and oil and gas decommissioning sectors.
In-Depth UK Offshore Oil And Gas Decommissioning Market Market Outlook
The UK Offshore Oil and Gas Decommissioning Market is on a robust growth trajectory, driven by a confluence of factors including an aging asset base and stringent regulatory oversight. Future market potential is substantial, with ongoing advancements in technology and a growing emphasis on sustainable practices. Strategic opportunities lie in the integration of AI and robotics for optimized decommissioning processes, as well as the development of circular economy solutions for salvaged materials. The collaborative efforts between industry bodies and research institutions will continue to foster innovation, ensuring a safe, efficient, and environmentally responsible decommissioning future for the UK's offshore sector.
UK Offshore Oil And Gas Decommissioning Market Segmentation
- 1. Shallow Water
- 2. Deepwater and Ultra-Deep Water
UK Offshore Oil And Gas Decommissioning Market Segmentation By Geography
-
1. North America
- 1.1. United States
- 1.2. Canada
- 1.3. Mexico
-
2. South America
- 2.1. Brazil
- 2.2. Argentina
- 2.3. Rest of South America
-
3. Europe
- 3.1. United Kingdom
- 3.2. Germany
- 3.3. France
- 3.4. Italy
- 3.5. Spain
- 3.6. Russia
- 3.7. Benelux
- 3.8. Nordics
- 3.9. Rest of Europe
-
4. Middle East & Africa
- 4.1. Turkey
- 4.2. Israel
- 4.3. GCC
- 4.4. North Africa
- 4.5. South Africa
- 4.6. Rest of Middle East & Africa
-
5. Asia Pacific
- 5.1. China
- 5.2. India
- 5.3. Japan
- 5.4. South Korea
- 5.5. ASEAN
- 5.6. Oceania
- 5.7. Rest of Asia Pacific
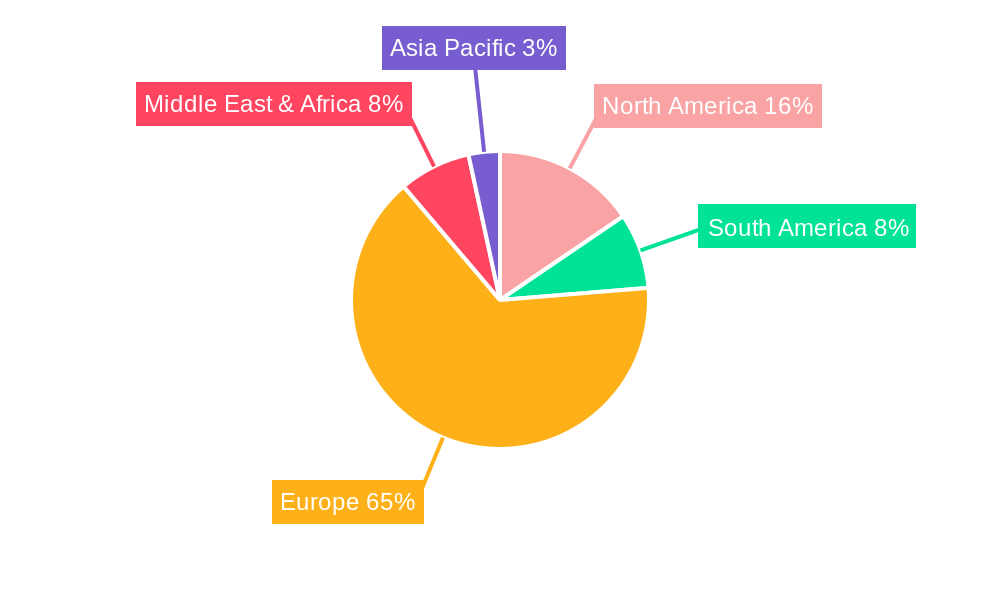
UK Offshore Oil And Gas Decommissioning Market Regional Market Share
Geographic Coverage of UK Offshore Oil And Gas Decommissioning Market
UK Offshore Oil And Gas Decommissioning Market REPORT HIGHLIGHTS
| Aspects | Details |
|---|---|
| Study Period | 2020-2034 |
| Base Year | 2025 |
| Estimated Year | 2026 |
| Forecast Period | 2026-2034 |
| Historical Period | 2020-2025 |
| Growth Rate | CAGR of 6.5% from 2020-2034 |
| Segmentation |
|
Table of Contents
- 1. Introduction
- 1.1. Research Scope
- 1.2. Market Segmentation
- 1.3. Research Objective
- 1.4. Definitions and Assumptions
- 2. Executive Summary
- 2.1. Market Snapshot
- 3. Market Dynamics
- 3.1. Market Drivers
- 3.2. Market Restrains
- 3.3. Market Trends
- 3.4. Market Opportunities
- 4. Market Factor Analysis
- 4.1. Porters Five Forces
- 4.1.1. Bargaining Power of Suppliers
- 4.1.2. Bargaining Power of Buyers
- 4.1.3. Threat of New Entrants
- 4.1.4. Threat of Substitutes
- 4.1.5. Competitive Rivalry
- 4.2. PESTEL analysis
- 4.3. BCG Analysis
- 4.3.1. Stars (High Growth, High Market Share)
- 4.3.2. Cash Cows (Low Growth, High Market Share)
- 4.3.3. Question Mark (High Growth, Low Market Share)
- 4.3.4. Dogs (Low Growth, Low Market Share)
- 4.4. Ansoff Matrix Analysis
- 4.5. Supply Chain Analysis
- 4.6. Regulatory Landscape
- 4.7. Current Market Potential and Opportunity Assessment (TAM–SAM–SOM Framework)
- 4.8. VDR Analyst Note
- 4.1. Porters Five Forces
- 5. Market Analysis, Insights and Forecast 2021-2033
- 5.1. Market Analysis, Insights and Forecast - by Shallow Water
- 5.2. Market Analysis, Insights and Forecast - by Deepwater and Ultra-Deep Water
- 5.3. Market Analysis, Insights and Forecast - by Region
- 5.3.1. North America
- 5.3.2. South America
- 5.3.3. Europe
- 5.3.4. Middle East & Africa
- 5.3.5. Asia Pacific
- 6. Global UK Offshore Oil And Gas Decommissioning Market Analysis, Insights and Forecast, 2021-2033
- 6.1. Market Analysis, Insights and Forecast - by Shallow Water
- 6.2. Market Analysis, Insights and Forecast - by Deepwater and Ultra-Deep Water
- 7. North America UK Offshore Oil And Gas Decommissioning Market Analysis, Insights and Forecast, 2021-2033
- 7.1. Market Analysis, Insights and Forecast - by Shallow Water
- 7.2. Market Analysis, Insights and Forecast - by Deepwater and Ultra-Deep Water
- 8. South America UK Offshore Oil And Gas Decommissioning Market Analysis, Insights and Forecast, 2021-2033
- 8.1. Market Analysis, Insights and Forecast - by Shallow Water
- 8.2. Market Analysis, Insights and Forecast - by Deepwater and Ultra-Deep Water
- 9. Europe UK Offshore Oil And Gas Decommissioning Market Analysis, Insights and Forecast, 2021-2033
- 9.1. Market Analysis, Insights and Forecast - by Shallow Water
- 9.2. Market Analysis, Insights and Forecast - by Deepwater and Ultra-Deep Water
- 10. Middle East & Africa UK Offshore Oil And Gas Decommissioning Market Analysis, Insights and Forecast, 2021-2033
- 10.1. Market Analysis, Insights and Forecast - by Shallow Water
- 10.2. Market Analysis, Insights and Forecast - by Deepwater and Ultra-Deep Water
- 11. Asia Pacific UK Offshore Oil And Gas Decommissioning Market Analysis, Insights and Forecast, 2021-2033
- 11.1. Market Analysis, Insights and Forecast - by Shallow Water
- 11.2. Market Analysis, Insights and Forecast - by Deepwater and Ultra-Deep Water
- 12. Competitive Analysis
- 12.1. Company Profiles
- 12.1.1 Veolia Environnement S A
- 12.1.1.1. Company Overview
- 12.1.1.2. Products
- 12.1.1.3. Company Financials
- 12.1.1.4. SWOT Analysis
- 12.1.2 John Lawrie Group Ltd *List Not Exhaustive
- 12.1.2.1. Company Overview
- 12.1.2.2. Products
- 12.1.2.3. Company Financials
- 12.1.2.4. SWOT Analysis
- 12.1.3 AF Gruppen ASA
- 12.1.3.1. Company Overview
- 12.1.3.2. Products
- 12.1.3.3. Company Financials
- 12.1.3.4. SWOT Analysis
- 12.1.4 Ramboll Group A/S
- 12.1.4.1. Company Overview
- 12.1.4.2. Products
- 12.1.4.3. Company Financials
- 12.1.4.4. SWOT Analysis
- 12.1.5 Perenco SA
- 12.1.5.1. Company Overview
- 12.1.5.2. Products
- 12.1.5.3. Company Financials
- 12.1.5.4. SWOT Analysis
- 12.1.6 Derrick Services (UK) Ltd
- 12.1.6.1. Company Overview
- 12.1.6.2. Products
- 12.1.6.3. Company Financials
- 12.1.6.4. SWOT Analysis
- 12.1.1 Veolia Environnement S A
- 12.2. Market Entropy
- 12.2.1 Company's Key Areas Served
- 12.2.2 Recent Developments
- 12.3. Company Market Share Analysis 2025
- 12.3.1 Top 5 Companies Market Share Analysis
- 12.3.2 Top 3 Companies Market Share Analysis
- 12.4. List of Potential Customers
- 13. Research Methodology
List of Figures
- Figure 1: Global UK Offshore Oil And Gas Decommissioning Market Revenue Breakdown (billion, %) by Region 2025 & 2033
- Figure 2: Global UK Offshore Oil And Gas Decommissioning Market Volume Breakdown (K Units, %) by Region 2025 & 2033
- Figure 3: North America UK Offshore Oil And Gas Decommissioning Market Revenue (billion), by Shallow Water 2025 & 2033
- Figure 4: North America UK Offshore Oil And Gas Decommissioning Market Volume (K Units), by Shallow Water 2025 & 2033
- Figure 5: North America UK Offshore Oil And Gas Decommissioning Market Revenue Share (%), by Shallow Water 2025 & 2033
- Figure 6: North America UK Offshore Oil And Gas Decommissioning Market Volume Share (%), by Shallow Water 2025 & 2033
- Figure 7: North America UK Offshore Oil And Gas Decommissioning Market Revenue (billion), by Deepwater and Ultra-Deep Water 2025 & 2033
- Figure 8: North America UK Offshore Oil And Gas Decommissioning Market Volume (K Units), by Deepwater and Ultra-Deep Water 2025 & 2033
- Figure 9: North America UK Offshore Oil And Gas Decommissioning Market Revenue Share (%), by Deepwater and Ultra-Deep Water 2025 & 2033
- Figure 10: North America UK Offshore Oil And Gas Decommissioning Market Volume Share (%), by Deepwater and Ultra-Deep Water 2025 & 2033
- Figure 11: North America UK Offshore Oil And Gas Decommissioning Market Revenue (billion), by Country 2025 & 2033
- Figure 12: North America UK Offshore Oil And Gas Decommissioning Market Volume (K Units), by Country 2025 & 2033
- Figure 13: North America UK Offshore Oil And Gas Decommissioning Market Revenue Share (%), by Country 2025 & 2033
- Figure 14: North America UK Offshore Oil And Gas Decommissioning Market Volume Share (%), by Country 2025 & 2033
- Figure 15: South America UK Offshore Oil And Gas Decommissioning Market Revenue (billion), by Shallow Water 2025 & 2033
- Figure 16: South America UK Offshore Oil And Gas Decommissioning Market Volume (K Units), by Shallow Water 2025 & 2033
- Figure 17: South America UK Offshore Oil And Gas Decommissioning Market Revenue Share (%), by Shallow Water 2025 & 2033
- Figure 18: South America UK Offshore Oil And Gas Decommissioning Market Volume Share (%), by Shallow Water 2025 & 2033
- Figure 19: South America UK Offshore Oil And Gas Decommissioning Market Revenue (billion), by Deepwater and Ultra-Deep Water 2025 & 2033
- Figure 20: South America UK Offshore Oil And Gas Decommissioning Market Volume (K Units), by Deepwater and Ultra-Deep Water 2025 & 2033
- Figure 21: South America UK Offshore Oil And Gas Decommissioning Market Revenue Share (%), by Deepwater and Ultra-Deep Water 2025 & 2033
- Figure 22: South America UK Offshore Oil And Gas Decommissioning Market Volume Share (%), by Deepwater and Ultra-Deep Water 2025 & 2033
- Figure 23: South America UK Offshore Oil And Gas Decommissioning Market Revenue (billion), by Country 2025 & 2033
- Figure 24: South America UK Offshore Oil And Gas Decommissioning Market Volume (K Units), by Country 2025 & 2033
- Figure 25: South America UK Offshore Oil And Gas Decommissioning Market Revenue Share (%), by Country 2025 & 2033
- Figure 26: South America UK Offshore Oil And Gas Decommissioning Market Volume Share (%), by Country 2025 & 2033
- Figure 27: Europe UK Offshore Oil And Gas Decommissioning Market Revenue (billion), by Shallow Water 2025 & 2033
- Figure 28: Europe UK Offshore Oil And Gas Decommissioning Market Volume (K Units), by Shallow Water 2025 & 2033
- Figure 29: Europe UK Offshore Oil And Gas Decommissioning Market Revenue Share (%), by Shallow Water 2025 & 2033
- Figure 30: Europe UK Offshore Oil And Gas Decommissioning Market Volume Share (%), by Shallow Water 2025 & 2033
- Figure 31: Europe UK Offshore Oil And Gas Decommissioning Market Revenue (billion), by Deepwater and Ultra-Deep Water 2025 & 2033
- Figure 32: Europe UK Offshore Oil And Gas Decommissioning Market Volume (K Units), by Deepwater and Ultra-Deep Water 2025 & 2033
- Figure 33: Europe UK Offshore Oil And Gas Decommissioning Market Revenue Share (%), by Deepwater and Ultra-Deep Water 2025 & 2033
- Figure 34: Europe UK Offshore Oil And Gas Decommissioning Market Volume Share (%), by Deepwater and Ultra-Deep Water 2025 & 2033
- Figure 35: Europe UK Offshore Oil And Gas Decommissioning Market Revenue (billion), by Country 2025 & 2033
- Figure 36: Europe UK Offshore Oil And Gas Decommissioning Market Volume (K Units), by Country 2025 & 2033
- Figure 37: Europe UK Offshore Oil And Gas Decommissioning Market Revenue Share (%), by Country 2025 & 2033
- Figure 38: Europe UK Offshore Oil And Gas Decommissioning Market Volume Share (%), by Country 2025 & 2033
- Figure 39: Middle East & Africa UK Offshore Oil And Gas Decommissioning Market Revenue (billion), by Shallow Water 2025 & 2033
- Figure 40: Middle East & Africa UK Offshore Oil And Gas Decommissioning Market Volume (K Units), by Shallow Water 2025 & 2033
- Figure 41: Middle East & Africa UK Offshore Oil And Gas Decommissioning Market Revenue Share (%), by Shallow Water 2025 & 2033
- Figure 42: Middle East & Africa UK Offshore Oil And Gas Decommissioning Market Volume Share (%), by Shallow Water 2025 & 2033
- Figure 43: Middle East & Africa UK Offshore Oil And Gas Decommissioning Market Revenue (billion), by Deepwater and Ultra-Deep Water 2025 & 2033
- Figure 44: Middle East & Africa UK Offshore Oil And Gas Decommissioning Market Volume (K Units), by Deepwater and Ultra-Deep Water 2025 & 2033
- Figure 45: Middle East & Africa UK Offshore Oil And Gas Decommissioning Market Revenue Share (%), by Deepwater and Ultra-Deep Water 2025 & 2033
- Figure 46: Middle East & Africa UK Offshore Oil And Gas Decommissioning Market Volume Share (%), by Deepwater and Ultra-Deep Water 2025 & 2033
- Figure 47: Middle East & Africa UK Offshore Oil And Gas Decommissioning Market Revenue (billion), by Country 2025 & 2033
- Figure 48: Middle East & Africa UK Offshore Oil And Gas Decommissioning Market Volume (K Units), by Country 2025 & 2033
- Figure 49: Middle East & Africa UK Offshore Oil And Gas Decommissioning Market Revenue Share (%), by Country 2025 & 2033
- Figure 50: Middle East & Africa UK Offshore Oil And Gas Decommissioning Market Volume Share (%), by Country 2025 & 2033
- Figure 51: Asia Pacific UK Offshore Oil And Gas Decommissioning Market Revenue (billion), by Shallow Water 2025 & 2033
- Figure 52: Asia Pacific UK Offshore Oil And Gas Decommissioning Market Volume (K Units), by Shallow Water 2025 & 2033
- Figure 53: Asia Pacific UK Offshore Oil And Gas Decommissioning Market Revenue Share (%), by Shallow Water 2025 & 2033
- Figure 54: Asia Pacific UK Offshore Oil And Gas Decommissioning Market Volume Share (%), by Shallow Water 2025 & 2033
- Figure 55: Asia Pacific UK Offshore Oil And Gas Decommissioning Market Revenue (billion), by Deepwater and Ultra-Deep Water 2025 & 2033
- Figure 56: Asia Pacific UK Offshore Oil And Gas Decommissioning Market Volume (K Units), by Deepwater and Ultra-Deep Water 2025 & 2033
- Figure 57: Asia Pacific UK Offshore Oil And Gas Decommissioning Market Revenue Share (%), by Deepwater and Ultra-Deep Water 2025 & 2033
- Figure 58: Asia Pacific UK Offshore Oil And Gas Decommissioning Market Volume Share (%), by Deepwater and Ultra-Deep Water 2025 & 2033
- Figure 59: Asia Pacific UK Offshore Oil And Gas Decommissioning Market Revenue (billion), by Country 2025 & 2033
- Figure 60: Asia Pacific UK Offshore Oil And Gas Decommissioning Market Volume (K Units), by Country 2025 & 2033
- Figure 61: Asia Pacific UK Offshore Oil And Gas Decommissioning Market Revenue Share (%), by Country 2025 & 2033
- Figure 62: Asia Pacific UK Offshore Oil And Gas Decommissioning Market Volume Share (%), by Country 2025 & 2033
List of Tables
- Table 1: Global UK Offshore Oil And Gas Decommissioning Market Revenue billion Forecast, by Shallow Water 2020 & 2033
- Table 2: Global UK Offshore Oil And Gas Decommissioning Market Volume K Units Forecast, by Shallow Water 2020 & 2033
- Table 3: Global UK Offshore Oil And Gas Decommissioning Market Revenue billion Forecast, by Deepwater and Ultra-Deep Water 2020 & 2033
- Table 4: Global UK Offshore Oil And Gas Decommissioning Market Volume K Units Forecast, by Deepwater and Ultra-Deep Water 2020 & 2033
- Table 5: Global UK Offshore Oil And Gas Decommissioning Market Revenue billion Forecast, by Region 2020 & 2033
- Table 6: Global UK Offshore Oil And Gas Decommissioning Market Volume K Units Forecast, by Region 2020 & 2033
- Table 7: Global UK Offshore Oil And Gas Decommissioning Market Revenue billion Forecast, by Shallow Water 2020 & 2033
- Table 8: Global UK Offshore Oil And Gas Decommissioning Market Volume K Units Forecast, by Shallow Water 2020 & 2033
- Table 9: Global UK Offshore Oil And Gas Decommissioning Market Revenue billion Forecast, by Deepwater and Ultra-Deep Water 2020 & 2033
- Table 10: Global UK Offshore Oil And Gas Decommissioning Market Volume K Units Forecast, by Deepwater and Ultra-Deep Water 2020 & 2033
- Table 11: Global UK Offshore Oil And Gas Decommissioning Market Revenue billion Forecast, by Country 2020 & 2033
- Table 12: Global UK Offshore Oil And Gas Decommissioning Market Volume K Units Forecast, by Country 2020 & 2033
- Table 13: United States UK Offshore Oil And Gas Decommissioning Market Revenue (billion) Forecast, by Application 2020 & 2033
- Table 14: United States UK Offshore Oil And Gas Decommissioning Market Volume (K Units) Forecast, by Application 2020 & 2033
- Table 15: Canada UK Offshore Oil And Gas Decommissioning Market Revenue (billion) Forecast, by Application 2020 & 2033
- Table 16: Canada UK Offshore Oil And Gas Decommissioning Market Volume (K Units) Forecast, by Application 2020 & 2033
- Table 17: Mexico UK Offshore Oil And Gas Decommissioning Market Revenue (billion) Forecast, by Application 2020 & 2033
- Table 18: Mexico UK Offshore Oil And Gas Decommissioning Market Volume (K Units) Forecast, by Application 2020 & 2033
- Table 19: Global UK Offshore Oil And Gas Decommissioning Market Revenue billion Forecast, by Shallow Water 2020 & 2033
- Table 20: Global UK Offshore Oil And Gas Decommissioning Market Volume K Units Forecast, by Shallow Water 2020 & 2033
- Table 21: Global UK Offshore Oil And Gas Decommissioning Market Revenue billion Forecast, by Deepwater and Ultra-Deep Water 2020 & 2033
- Table 22: Global UK Offshore Oil And Gas Decommissioning Market Volume K Units Forecast, by Deepwater and Ultra-Deep Water 2020 & 2033
- Table 23: Global UK Offshore Oil And Gas Decommissioning Market Revenue billion Forecast, by Country 2020 & 2033
- Table 24: Global UK Offshore Oil And Gas Decommissioning Market Volume K Units Forecast, by Country 2020 & 2033
- Table 25: Brazil UK Offshore Oil And Gas Decommissioning Market Revenue (billion) Forecast, by Application 2020 & 2033
- Table 26: Brazil UK Offshore Oil And Gas Decommissioning Market Volume (K Units) Forecast, by Application 2020 & 2033
- Table 27: Argentina UK Offshore Oil And Gas Decommissioning Market Revenue (billion) Forecast, by Application 2020 & 2033
- Table 28: Argentina UK Offshore Oil And Gas Decommissioning Market Volume (K Units) Forecast, by Application 2020 & 2033
- Table 29: Rest of South America UK Offshore Oil And Gas Decommissioning Market Revenue (billion) Forecast, by Application 2020 & 2033
- Table 30: Rest of South America UK Offshore Oil And Gas Decommissioning Market Volume (K Units) Forecast, by Application 2020 & 2033
- Table 31: Global UK Offshore Oil And Gas Decommissioning Market Revenue billion Forecast, by Shallow Water 2020 & 2033
- Table 32: Global UK Offshore Oil And Gas Decommissioning Market Volume K Units Forecast, by Shallow Water 2020 & 2033
- Table 33: Global UK Offshore Oil And Gas Decommissioning Market Revenue billion Forecast, by Deepwater and Ultra-Deep Water 2020 & 2033
- Table 34: Global UK Offshore Oil And Gas Decommissioning Market Volume K Units Forecast, by Deepwater and Ultra-Deep Water 2020 & 2033
- Table 35: Global UK Offshore Oil And Gas Decommissioning Market Revenue billion Forecast, by Country 2020 & 2033
- Table 36: Global UK Offshore Oil And Gas Decommissioning Market Volume K Units Forecast, by Country 2020 & 2033
- Table 37: United Kingdom UK Offshore Oil And Gas Decommissioning Market Revenue (billion) Forecast, by Application 2020 & 2033
- Table 38: United Kingdom UK Offshore Oil And Gas Decommissioning Market Volume (K Units) Forecast, by Application 2020 & 2033
- Table 39: Germany UK Offshore Oil And Gas Decommissioning Market Revenue (billion) Forecast, by Application 2020 & 2033
- Table 40: Germany UK Offshore Oil And Gas Decommissioning Market Volume (K Units) Forecast, by Application 2020 & 2033
- Table 41: France UK Offshore Oil And Gas Decommissioning Market Revenue (billion) Forecast, by Application 2020 & 2033
- Table 42: France UK Offshore Oil And Gas Decommissioning Market Volume (K Units) Forecast, by Application 2020 & 2033
- Table 43: Italy UK Offshore Oil And Gas Decommissioning Market Revenue (billion) Forecast, by Application 2020 & 2033
- Table 44: Italy UK Offshore Oil And Gas Decommissioning Market Volume (K Units) Forecast, by Application 2020 & 2033
- Table 45: Spain UK Offshore Oil And Gas Decommissioning Market Revenue (billion) Forecast, by Application 2020 & 2033
- Table 46: Spain UK Offshore Oil And Gas Decommissioning Market Volume (K Units) Forecast, by Application 2020 & 2033
- Table 47: Russia UK Offshore Oil And Gas Decommissioning Market Revenue (billion) Forecast, by Application 2020 & 2033
- Table 48: Russia UK Offshore Oil And Gas Decommissioning Market Volume (K Units) Forecast, by Application 2020 & 2033
- Table 49: Benelux UK Offshore Oil And Gas Decommissioning Market Revenue (billion) Forecast, by Application 2020 & 2033
- Table 50: Benelux UK Offshore Oil And Gas Decommissioning Market Volume (K Units) Forecast, by Application 2020 & 2033
- Table 51: Nordics UK Offshore Oil And Gas Decommissioning Market Revenue (billion) Forecast, by Application 2020 & 2033
- Table 52: Nordics UK Offshore Oil And Gas Decommissioning Market Volume (K Units) Forecast, by Application 2020 & 2033
- Table 53: Rest of Europe UK Offshore Oil And Gas Decommissioning Market Revenue (billion) Forecast, by Application 2020 & 2033
- Table 54: Rest of Europe UK Offshore Oil And Gas Decommissioning Market Volume (K Units) Forecast, by Application 2020 & 2033
- Table 55: Global UK Offshore Oil And Gas Decommissioning Market Revenue billion Forecast, by Shallow Water 2020 & 2033
- Table 56: Global UK Offshore Oil And Gas Decommissioning Market Volume K Units Forecast, by Shallow Water 2020 & 2033
- Table 57: Global UK Offshore Oil And Gas Decommissioning Market Revenue billion Forecast, by Deepwater and Ultra-Deep Water 2020 & 2033
- Table 58: Global UK Offshore Oil And Gas Decommissioning Market Volume K Units Forecast, by Deepwater and Ultra-Deep Water 2020 & 2033
- Table 59: Global UK Offshore Oil And Gas Decommissioning Market Revenue billion Forecast, by Country 2020 & 2033
- Table 60: Global UK Offshore Oil And Gas Decommissioning Market Volume K Units Forecast, by Country 2020 & 2033
- Table 61: Turkey UK Offshore Oil And Gas Decommissioning Market Revenue (billion) Forecast, by Application 2020 & 2033
- Table 62: Turkey UK Offshore Oil And Gas Decommissioning Market Volume (K Units) Forecast, by Application 2020 & 2033
- Table 63: Israel UK Offshore Oil And Gas Decommissioning Market Revenue (billion) Forecast, by Application 2020 & 2033
- Table 64: Israel UK Offshore Oil And Gas Decommissioning Market Volume (K Units) Forecast, by Application 2020 & 2033
- Table 65: GCC UK Offshore Oil And Gas Decommissioning Market Revenue (billion) Forecast, by Application 2020 & 2033
- Table 66: GCC UK Offshore Oil And Gas Decommissioning Market Volume (K Units) Forecast, by Application 2020 & 2033
- Table 67: North Africa UK Offshore Oil And Gas Decommissioning Market Revenue (billion) Forecast, by Application 2020 & 2033
- Table 68: North Africa UK Offshore Oil And Gas Decommissioning Market Volume (K Units) Forecast, by Application 2020 & 2033
- Table 69: South Africa UK Offshore Oil And Gas Decommissioning Market Revenue (billion) Forecast, by Application 2020 & 2033
- Table 70: South Africa UK Offshore Oil And Gas Decommissioning Market Volume (K Units) Forecast, by Application 2020 & 2033
- Table 71: Rest of Middle East & Africa UK Offshore Oil And Gas Decommissioning Market Revenue (billion) Forecast, by Application 2020 & 2033
- Table 72: Rest of Middle East & Africa UK Offshore Oil And Gas Decommissioning Market Volume (K Units) Forecast, by Application 2020 & 2033
- Table 73: Global UK Offshore Oil And Gas Decommissioning Market Revenue billion Forecast, by Shallow Water 2020 & 2033
- Table 74: Global UK Offshore Oil And Gas Decommissioning Market Volume K Units Forecast, by Shallow Water 2020 & 2033
- Table 75: Global UK Offshore Oil And Gas Decommissioning Market Revenue billion Forecast, by Deepwater and Ultra-Deep Water 2020 & 2033
- Table 76: Global UK Offshore Oil And Gas Decommissioning Market Volume K Units Forecast, by Deepwater and Ultra-Deep Water 2020 & 2033
- Table 77: Global UK Offshore Oil And Gas Decommissioning Market Revenue billion Forecast, by Country 2020 & 2033
- Table 78: Global UK Offshore Oil And Gas Decommissioning Market Volume K Units Forecast, by Country 2020 & 2033
- Table 79: China UK Offshore Oil And Gas Decommissioning Market Revenue (billion) Forecast, by Application 2020 & 2033
- Table 80: China UK Offshore Oil And Gas Decommissioning Market Volume (K Units) Forecast, by Application 2020 & 2033
- Table 81: India UK Offshore Oil And Gas Decommissioning Market Revenue (billion) Forecast, by Application 2020 & 2033
- Table 82: India UK Offshore Oil And Gas Decommissioning Market Volume (K Units) Forecast, by Application 2020 & 2033
- Table 83: Japan UK Offshore Oil And Gas Decommissioning Market Revenue (billion) Forecast, by Application 2020 & 2033
- Table 84: Japan UK Offshore Oil And Gas Decommissioning Market Volume (K Units) Forecast, by Application 2020 & 2033
- Table 85: South Korea UK Offshore Oil And Gas Decommissioning Market Revenue (billion) Forecast, by Application 2020 & 2033
- Table 86: South Korea UK Offshore Oil And Gas Decommissioning Market Volume (K Units) Forecast, by Application 2020 & 2033
- Table 87: ASEAN UK Offshore Oil And Gas Decommissioning Market Revenue (billion) Forecast, by Application 2020 & 2033
- Table 88: ASEAN UK Offshore Oil And Gas Decommissioning Market Volume (K Units) Forecast, by Application 2020 & 2033
- Table 89: Oceania UK Offshore Oil And Gas Decommissioning Market Revenue (billion) Forecast, by Application 2020 & 2033
- Table 90: Oceania UK Offshore Oil And Gas Decommissioning Market Volume (K Units) Forecast, by Application 2020 & 2033
- Table 91: Rest of Asia Pacific UK Offshore Oil And Gas Decommissioning Market Revenue (billion) Forecast, by Application 2020 & 2033
- Table 92: Rest of Asia Pacific UK Offshore Oil And Gas Decommissioning Market Volume (K Units) Forecast, by Application 2020 & 2033
Frequently Asked Questions
1. What is the projected Compound Annual Growth Rate (CAGR) of the UK Offshore Oil And Gas Decommissioning Market?
The projected CAGR is approximately 6.5%.
2. Which companies are prominent players in the UK Offshore Oil And Gas Decommissioning Market?
Key companies in the market include Veolia Environnement S A, John Lawrie Group Ltd *List Not Exhaustive, AF Gruppen ASA, Ramboll Group A/S, Perenco SA, Derrick Services (UK) Ltd.
3. What are the main segments of the UK Offshore Oil And Gas Decommissioning Market?
The market segments include Shallow Water, Deepwater and Ultra-Deep Water.
4. Can you provide details about the market size?
The market size is estimated to be USD 11.1 billion as of 2022.
5. What are some drivers contributing to market growth?
4.; Supportive Government Policies in Developing Solar Energy4.; Abundant Solar Resources Across the Country.
6. What are the notable trends driving market growth?
Increasing Decommissioning Projects to Drive the Market.
7. Are there any restraints impacting market growth?
4.; Competition from Conventional Energy Sources.
8. Can you provide examples of recent developments in the market?
November 2022: there were more than 2,000 abandoned oil and gas wells in the North Sea begin, The high number of abandoned wells is expected to lead to an increase in activity as operations worth EUR 20 billion are decommissioned and shut down. The research was conducted by industry group Offshore Energies UK (OEUK), formerly Oil & Gas UK, which provides fresh insight into petroleum decommissioning efforts.
9. What pricing options are available for accessing the report?
Pricing options include single-user, multi-user, and enterprise licenses priced at USD 3800, USD 4500, and USD 5800 respectively.
10. Is the market size provided in terms of value or volume?
The market size is provided in terms of value, measured in billion and volume, measured in K Units.
11. Are there any specific market keywords associated with the report?
Yes, the market keyword associated with the report is "UK Offshore Oil And Gas Decommissioning Market," which aids in identifying and referencing the specific market segment covered.
12. How do I determine which pricing option suits my needs best?
The pricing options vary based on user requirements and access needs. Individual users may opt for single-user licenses, while businesses requiring broader access may choose multi-user or enterprise licenses for cost-effective access to the report.
13. Are there any additional resources or data provided in the UK Offshore Oil And Gas Decommissioning Market report?
While the report offers comprehensive insights, it's advisable to review the specific contents or supplementary materials provided to ascertain if additional resources or data are available.
14. How can I stay updated on further developments or reports in the UK Offshore Oil And Gas Decommissioning Market?
To stay informed about further developments, trends, and reports in the UK Offshore Oil And Gas Decommissioning Market, consider subscribing to industry newsletters, following relevant companies and organizations, or regularly checking reputable industry news sources and publications.
Methodology
Step 1 - Identification of Relevant Samples Size from Population Database


Step 2 - Approaches for Defining Global Market Size (Value, Volume* & Price*)

Note*: In applicable scenarios
Step 3 - Data Sources
Primary Research
- Web Analytics
- Survey Reports
- Research Institute
- Latest Research Reports
- Opinion Leaders
Secondary Research
- Annual Reports
- White Paper
- Latest Press Release
- Industry Association
- Paid Database
- Investor Presentations

Step 4 - Data Triangulation
Involves using different sources of information in order to increase the validity of a study
These sources are likely to be stakeholders in a program - participants, other researchers, program staff, other community members, and so on.
Then we put all data in single framework & apply various statistical tools to find out the dynamic on the market.
During the analysis stage, feedback from the stakeholder groups would be compared to determine areas of agreement as well as areas of divergence

