

Key Insights
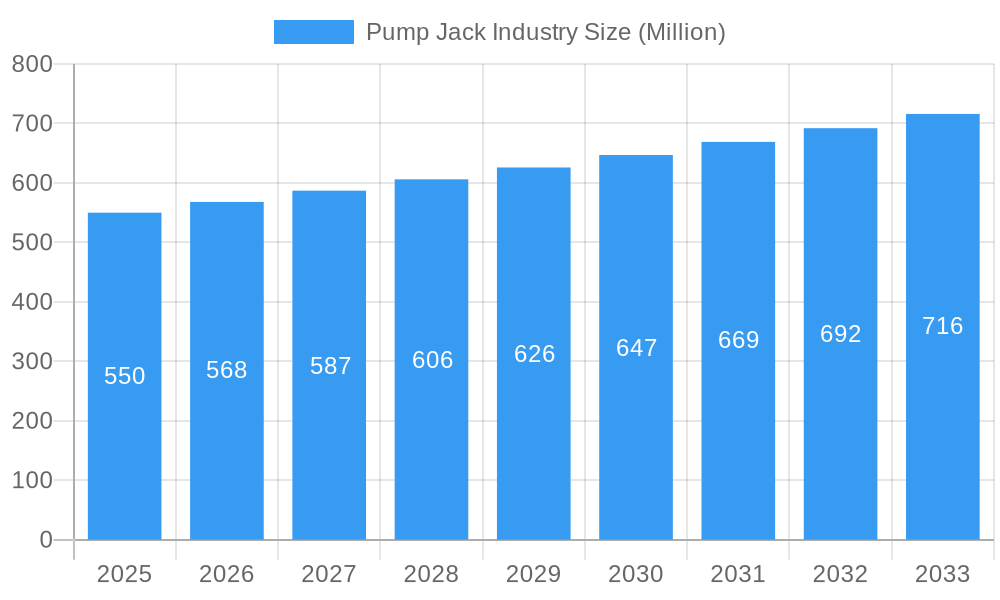
The global pump jack market is poised for steady expansion, projected to grow at a Compound Annual Growth Rate (CAGR) exceeding 3.00% from 2025 to 2033. This growth is underpinned by the persistent demand for oil and gas, driving the need for efficient artificial lift systems to maintain production from mature wells and explore new reserves. Key market drivers include the increasing complexity of reservoir characteristics, necessitating advanced pumping solutions, and the ongoing efforts to optimize production efficiency and reduce operational costs in the upstream oil and gas sector. Furthermore, technological advancements, such as the integration of smart sensors and predictive maintenance capabilities into pump jack systems, are contributing to their adoption by enhancing reliability and minimizing downtime. The market's value is estimated to be in the tens of millions, reflecting the significant investment in oilfield equipment.
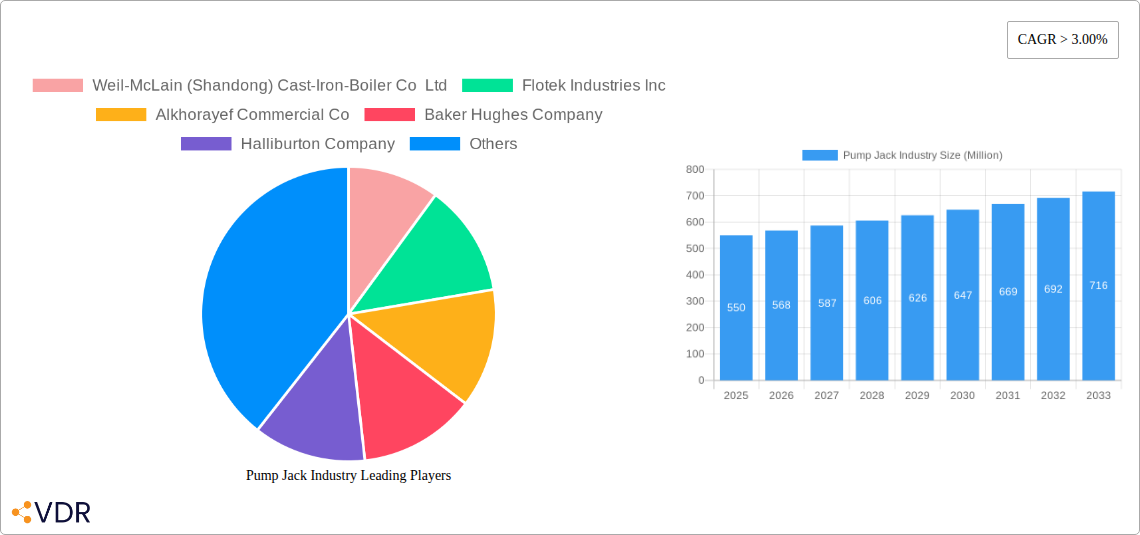
Pump Jack Industry Market Size (In Million)
Geographically, North America and the Middle East & Africa are expected to remain dominant regions due to their substantial oil reserves and ongoing exploration and production activities. Asia Pacific is anticipated to witness robust growth driven by increasing energy demands and investments in both onshore and offshore projects. The market is segmented by well type, with vertical wells representing a significant portion due to their prevalence in existing fields, and horizontal wells gaining traction for their ability to access more unconventional reserves. Offshore applications, while more capital-intensive, are crucial for accessing deepwater reserves, contributing to the market's overall value. Despite the growth, certain restraints such as fluctuating oil prices, stringent environmental regulations, and the increasing adoption of alternative energy sources could temper the market's pace. However, the fundamental need for hydrocarbon production ensures continued relevance and growth for the pump jack industry.
Pump Jack Industry Company Market Share
Pump Jack Industry Report Description
This comprehensive report delves into the global pump jack industry, providing an in-depth analysis of market dynamics, growth trends, and key players from 2019 to 2033. With a base year of 2025, this study offers an estimated market outlook for the same year and forecasts growth from 2025 to 2033. We examine vertical well and horizontal well types, alongside offshore and onshore applications, providing actionable insights for stakeholders in the oil and gas sector.
The report leverages extensive data to deliver a granular understanding of the artificial lift systems market, focusing on the critical role of pump jacks in oil extraction. We dissect the competitive landscape, identifying market leaders and emerging contenders, and explore the technological innovations and regulatory frameworks shaping the industry's future. With a focus on quantitative data and qualitative analysis, this report is an indispensable resource for oilfield equipment manufacturers, oil and gas exploration companies, and investment firms seeking to capitalize on opportunities within the downstream oil and gas equipment sector.
Report Scope:
- Study Period: 2019–2033
- Base Year: 2025
- Estimated Year: 2025
- Forecast Period: 2025–2033
- Historical Period: 2019–2024
- Market Value: All values presented in Million units.
Pump Jack Industry Market Dynamics & Structure
The pump jack industry, a vital segment of the artificial lift systems market, is characterized by a moderate to high market concentration, with a few dominant players holding significant market share. Technological innovation serves as a primary driver, with continuous advancements in energy efficiency, durability, and remote monitoring capabilities of pump jacks. Regulatory frameworks, particularly concerning environmental impact and safety standards, also play a crucial role in shaping product development and market entry. Competitive product substitutes, such as progressing cavity pumps and rod-less pumping systems, present ongoing challenges, necessitating continuous innovation and cost-effectiveness from pump jack manufacturers. End-user demographics are primarily comprised of oil and gas exploration and production companies, with a growing emphasis on enhancing recovery from mature fields. Mergers and acquisitions (M&A) trends are observed as companies seek to expand their product portfolios, geographical reach, and technological capabilities.
- Market Concentration: Dominated by a few key global players, with increasing consolidation in recent years.
- Technological Innovation Drivers: Focus on smart technologies, IoT integration for predictive maintenance, and reduced energy consumption.
- Regulatory Frameworks: Stringent safety and environmental regulations are pushing for more robust and compliant pump jack designs.
- Competitive Product Substitutes: Competition from other artificial lift methods necessitates ongoing R&D for improved pump jack efficiency and cost-effectiveness.
- End-User Demographics: Primarily large oil and gas exploration and production (E&P) companies focused on maximizing output from existing wells.
- M&A Trends: Strategic acquisitions aimed at technology integration and market expansion are prevalent.
Pump Jack Industry Growth Trends & Insights
The global pump jack industry is poised for significant growth, driven by the perpetual need for efficient oil extraction from a diverse range of reservoirs. The market size is projected to expand at a Compound Annual Growth Rate (CAGR) of xx% from the base year 2025 to 2033. Adoption rates are influenced by the lifecycle of oil fields, with higher demand in mature basins requiring enhanced oil recovery (EOR) techniques. Technological disruptions, such as the integration of artificial intelligence (AI) for optimized pump jack operation and predictive maintenance, are transforming operational efficiency and reducing downtime. Consumer behavior shifts within the oil and gas industry are increasingly prioritizing sustainability and operational cost reduction, directly impacting the demand for advanced, energy-efficient pump jack solutions. The market penetration of smart pump jack systems, equipped with real-time data analytics and remote control capabilities, is expected to surge as operators seek to maximize production and minimize operational expenditures. Furthermore, the increasing focus on extending the life of existing oil assets, rather than solely on new exploration, directly bolsters the demand for reliable and cost-effective artificial lift equipment. The development of modular and easily deployable pump jack units for various well types, including complex horizontal wells, is also a significant growth trend. The evolving global energy landscape, with its inherent price volatility, underscores the importance of optimizing production from every barrel, thus reinforcing the central role of efficient pump jack technology.
Dominant Regions, Countries, or Segments in Pump Jack Industry
The onshore application segment is currently the dominant force driving growth in the global pump jack industry, primarily propelled by its widespread use in major oil-producing regions. Countries within North America, particularly the United States, are leading this charge due to extensive shale oil production and a mature oilfield infrastructure. Economic policies supporting domestic energy production, coupled with significant investments in hydraulic fracturing and horizontal drilling technologies, have created a robust demand for reliable pump jacks for oil extraction. The extensive network of existing oil wells in these regions necessitates continuous maintenance and upgrades, further solidifying the dominance of onshore applications.
- Dominant Segment: Onshore applications represent the largest market share due to the vast number of onshore oil wells globally.
- Key Region: North America, especially the United States, is a primary growth engine owing to its substantial shale oil production.
- Driving Factors in North America:
- Prolonged investments in hydraulic fracturing and horizontal drilling.
- Governmental support for domestic oil production.
- A mature oilfield infrastructure requiring continuous pump jack services.
- Growth Potential in Other Regions: Emerging oil discoveries and increased E&P activities in regions like the Middle East and parts of Asia are expected to contribute to future growth in both onshore and offshore segments.
- Horizontal Well Advancement: The increasing prevalence of horizontal wells, while initially posing installation challenges, is now a significant driver for specialized pump jack designs and associated technologies.
Pump Jack Industry Product Landscape
The product landscape of the pump jack industry is characterized by continuous innovation focused on enhancing efficiency, reliability, and operational intelligence. Modern pump jacks are designed for optimized energy consumption, reduced wear and tear, and extended service life, even in harsh operating conditions. Product advancements include the integration of advanced materials for increased durability, variable speed drives for precise stroke control, and sophisticated telemetry systems for remote monitoring and predictive maintenance. These innovations translate into significant operational benefits for end-users, such as reduced downtime, lower maintenance costs, and improved oil recovery rates. Unique selling propositions often revolve around rugged design, ease of installation and maintenance, and the ability to adapt to diverse well conditions and fluid characteristics.
Key Drivers, Barriers & Challenges in Pump Jack Industry
Key Drivers: Technological advancements in artificial lift systems, including improved motor efficiency and remote monitoring capabilities, are paramount drivers. The ongoing need to maximize production from mature oil fields and unconventional reserves, such as shale oil, fuels demand for reliable pump jack solutions. Government incentives and favorable policies supporting domestic oil production also act as significant catalysts.
Key Barriers & Challenges: Price volatility in the crude oil market poses a significant challenge, impacting capital expenditure by oil companies and thus the demand for new pump jack installations. Supply chain disruptions and the availability of skilled labor for manufacturing and maintenance can also create hurdles. Regulatory compliance and the cost associated with meeting increasingly stringent environmental standards can further impede growth. Competitive pressures from alternative artificial lift technologies also demand continuous innovation and cost optimization.
Emerging Opportunities in Pump Jack Industry
Emerging opportunities in the pump jack industry lie in the development and adoption of smart, IoT-enabled pump jack systems that offer real-time data analytics and predictive maintenance capabilities. The increasing focus on enhancing oil recovery from mature fields presents a substantial market for upgraded and retrofitted pump jack units. Furthermore, the exploration and production of unconventional oil reserves in emerging markets offer significant untapped potential for pump jack manufacturers. The development of more energy-efficient and environmentally friendly pump jack designs, catering to growing sustainability mandates within the energy sector, also represents a key opportunity.
Growth Accelerators in the Pump Jack Industry Industry
Several factors are accelerating growth in the pump jack industry. Technological breakthroughs in materials science are leading to more durable and cost-effective pump jack components. Strategic partnerships between pump jack manufacturers and oilfield service companies are expanding market reach and facilitating the adoption of integrated solutions. Market expansion strategies, particularly into regions with growing oil production, are also key growth accelerators. The increasing investment in enhancing production from existing oil assets, rather than solely focusing on new discoveries, directly boosts the demand for efficient and reliable artificial lift systems like pump jacks.
Key Players Shaping the Pump Jack Industry Market
- Weil-McLain (Shandong) Cast-Iron-Boiler Co Ltd
- Flotek Industries Inc
- Alkhorayef Commercial Co
- Baker Hughes Company
- Halliburton Company
- National-Oilwell Varco Inc
- Borets International Ltd
- Weatherford International Ltd
- Schlumberger Limited
- Dover Corp
Notable Milestones in Pump Jack Industry Sector
- 2021: Introduction of AI-powered predictive maintenance software for pump jacks, significantly reducing unscheduled downtime.
- 2022: Development of advanced composite materials for pump jack rods, leading to increased tensile strength and corrosion resistance.
- 2023: Major oilfield service companies announce significant investments in smart pump jack technology for enhanced production optimization.
- 2024: Launch of modular and easily deployable pump jack units designed for rapid installation in remote locations.
In-Depth Pump Jack Industry Market Outlook
The future outlook for the pump jack industry remains robust, driven by sustained global energy demand and the ongoing need for efficient oil extraction. Growth accelerators, such as technological advancements in smart pump jack systems and strategic market expansions, are expected to propel the industry forward. The increasing focus on maximizing output from mature oil fields and the development of unconventional reserves will continue to fuel demand. Companies that can offer innovative, cost-effective, and environmentally compliant solutions will be best positioned to capitalize on the significant opportunities within this dynamic market. The integration of digital technologies and the pursuit of operational excellence will be key differentiators for success.
Pump Jack Industry Segmentation
-
1. Type
- 1.1. Vertical Well
- 1.2. Horizontal Well
-
2. Application
- 2.1. Offshore
- 2.2. Onshore
Pump Jack Industry Segmentation By Geography
- 1. North America
- 2. Asia Pacific
- 3. Europe
- 4. South America
- 5. Middle East and Africa
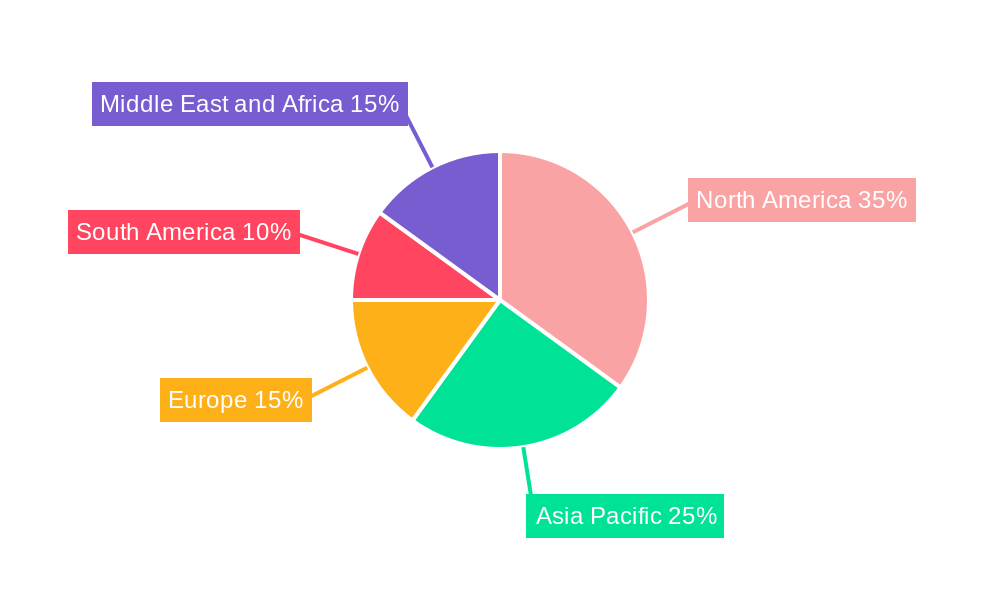
Pump Jack Industry Regional Market Share
Geographic Coverage of Pump Jack Industry
Pump Jack Industry REPORT HIGHLIGHTS
| Aspects | Details |
|---|---|
| Study Period | 2020-2034 |
| Base Year | 2025 |
| Estimated Year | 2026 |
| Forecast Period | 2026-2034 |
| Historical Period | 2020-2025 |
| Growth Rate | CAGR of 5.7% from 2020-2034 |
| Segmentation |
|
Table of Contents
- 1. Introduction
- 1.1. Research Scope
- 1.2. Market Segmentation
- 1.3. Research Objective
- 1.4. Definitions and Assumptions
- 2. Executive Summary
- 2.1. Market Snapshot
- 3. Market Dynamics
- 3.1. Market Drivers
- 3.2. Market Restrains
- 3.3. Market Trends
- 3.4. Market Opportunities
- 4. Market Factor Analysis
- 4.1. Porters Five Forces
- 4.1.1. Bargaining Power of Suppliers
- 4.1.2. Bargaining Power of Buyers
- 4.1.3. Threat of New Entrants
- 4.1.4. Threat of Substitutes
- 4.1.5. Competitive Rivalry
- 4.2. PESTEL analysis
- 4.3. BCG Analysis
- 4.3.1. Stars (High Growth, High Market Share)
- 4.3.2. Cash Cows (Low Growth, High Market Share)
- 4.3.3. Question Mark (High Growth, Low Market Share)
- 4.3.4. Dogs (Low Growth, Low Market Share)
- 4.4. Ansoff Matrix Analysis
- 4.5. Supply Chain Analysis
- 4.6. Regulatory Landscape
- 4.7. Current Market Potential and Opportunity Assessment (TAM–SAM–SOM Framework)
- 4.8. VDR Analyst Note
- 4.1. Porters Five Forces
- 5. Market Analysis, Insights and Forecast 2021-2033
- 5.1. Market Analysis, Insights and Forecast - by Type
- 5.1.1. Vertical Well
- 5.1.2. Horizontal Well
- 5.2. Market Analysis, Insights and Forecast - by Application
- 5.2.1. Offshore
- 5.2.2. Onshore
- 5.3. Market Analysis, Insights and Forecast - by Region
- 5.3.1. North America
- 5.3.2. Asia Pacific
- 5.3.3. Europe
- 5.3.4. South America
- 5.3.5. Middle East and Africa
- 5.1. Market Analysis, Insights and Forecast - by Type
- 6. Global Pump Jack Industry Analysis, Insights and Forecast, 2021-2033
- 6.1. Market Analysis, Insights and Forecast - by Type
- 6.1.1. Vertical Well
- 6.1.2. Horizontal Well
- 6.2. Market Analysis, Insights and Forecast - by Application
- 6.2.1. Offshore
- 6.2.2. Onshore
- 6.1. Market Analysis, Insights and Forecast - by Type
- 7. North America Pump Jack Industry Analysis, Insights and Forecast, 2021-2033
- 7.1. Market Analysis, Insights and Forecast - by Type
- 7.1.1. Vertical Well
- 7.1.2. Horizontal Well
- 7.2. Market Analysis, Insights and Forecast - by Application
- 7.2.1. Offshore
- 7.2.2. Onshore
- 7.1. Market Analysis, Insights and Forecast - by Type
- 8. Asia Pacific Pump Jack Industry Analysis, Insights and Forecast, 2021-2033
- 8.1. Market Analysis, Insights and Forecast - by Type
- 8.1.1. Vertical Well
- 8.1.2. Horizontal Well
- 8.2. Market Analysis, Insights and Forecast - by Application
- 8.2.1. Offshore
- 8.2.2. Onshore
- 8.1. Market Analysis, Insights and Forecast - by Type
- 9. Europe Pump Jack Industry Analysis, Insights and Forecast, 2021-2033
- 9.1. Market Analysis, Insights and Forecast - by Type
- 9.1.1. Vertical Well
- 9.1.2. Horizontal Well
- 9.2. Market Analysis, Insights and Forecast - by Application
- 9.2.1. Offshore
- 9.2.2. Onshore
- 9.1. Market Analysis, Insights and Forecast - by Type
- 10. South America Pump Jack Industry Analysis, Insights and Forecast, 2021-2033
- 10.1. Market Analysis, Insights and Forecast - by Type
- 10.1.1. Vertical Well
- 10.1.2. Horizontal Well
- 10.2. Market Analysis, Insights and Forecast - by Application
- 10.2.1. Offshore
- 10.2.2. Onshore
- 10.1. Market Analysis, Insights and Forecast - by Type
- 11. Middle East and Africa Pump Jack Industry Analysis, Insights and Forecast, 2021-2033
- 11.1. Market Analysis, Insights and Forecast - by Type
- 11.1.1. Vertical Well
- 11.1.2. Horizontal Well
- 11.2. Market Analysis, Insights and Forecast - by Application
- 11.2.1. Offshore
- 11.2.2. Onshore
- 11.1. Market Analysis, Insights and Forecast - by Type
- 12. Competitive Analysis
- 12.1. Company Profiles
- 12.1.1 Weil-McLain (Shandong) Cast-Iron-Boiler Co Ltd
- 12.1.1.1. Company Overview
- 12.1.1.2. Products
- 12.1.1.3. Company Financials
- 12.1.1.4. SWOT Analysis
- 12.1.2 Flotek Industries Inc
- 12.1.2.1. Company Overview
- 12.1.2.2. Products
- 12.1.2.3. Company Financials
- 12.1.2.4. SWOT Analysis
- 12.1.3 Alkhorayef Commercial Co
- 12.1.3.1. Company Overview
- 12.1.3.2. Products
- 12.1.3.3. Company Financials
- 12.1.3.4. SWOT Analysis
- 12.1.4 Baker Hughes Company
- 12.1.4.1. Company Overview
- 12.1.4.2. Products
- 12.1.4.3. Company Financials
- 12.1.4.4. SWOT Analysis
- 12.1.5 Halliburton Company
- 12.1.5.1. Company Overview
- 12.1.5.2. Products
- 12.1.5.3. Company Financials
- 12.1.5.4. SWOT Analysis
- 12.1.6 National-Oilwell Varco Inc
- 12.1.6.1. Company Overview
- 12.1.6.2. Products
- 12.1.6.3. Company Financials
- 12.1.6.4. SWOT Analysis
- 12.1.7 Borets International Ltd
- 12.1.7.1. Company Overview
- 12.1.7.2. Products
- 12.1.7.3. Company Financials
- 12.1.7.4. SWOT Analysis
- 12.1.8 Weatherford International Ltd
- 12.1.8.1. Company Overview
- 12.1.8.2. Products
- 12.1.8.3. Company Financials
- 12.1.8.4. SWOT Analysis
- 12.1.9 Schlumberger Limited
- 12.1.9.1. Company Overview
- 12.1.9.2. Products
- 12.1.9.3. Company Financials
- 12.1.9.4. SWOT Analysis
- 12.1.10 Dover Corp
- 12.1.10.1. Company Overview
- 12.1.10.2. Products
- 12.1.10.3. Company Financials
- 12.1.10.4. SWOT Analysis
- 12.1.1 Weil-McLain (Shandong) Cast-Iron-Boiler Co Ltd
- 12.2. Market Entropy
- 12.2.1 Company's Key Areas Served
- 12.2.2 Recent Developments
- 12.3. Company Market Share Analysis 2025
- 12.3.1 Top 5 Companies Market Share Analysis
- 12.3.2 Top 3 Companies Market Share Analysis
- 12.4. List of Potential Customers
- 13. Research Methodology
List of Figures
- Figure 1: Global Pump Jack Industry Revenue Breakdown (million, %) by Region 2025 & 2033
- Figure 2: North America Pump Jack Industry Revenue (million), by Type 2025 & 2033
- Figure 3: North America Pump Jack Industry Revenue Share (%), by Type 2025 & 2033
- Figure 4: North America Pump Jack Industry Revenue (million), by Application 2025 & 2033
- Figure 5: North America Pump Jack Industry Revenue Share (%), by Application 2025 & 2033
- Figure 6: North America Pump Jack Industry Revenue (million), by Country 2025 & 2033
- Figure 7: North America Pump Jack Industry Revenue Share (%), by Country 2025 & 2033
- Figure 8: Asia Pacific Pump Jack Industry Revenue (million), by Type 2025 & 2033
- Figure 9: Asia Pacific Pump Jack Industry Revenue Share (%), by Type 2025 & 2033
- Figure 10: Asia Pacific Pump Jack Industry Revenue (million), by Application 2025 & 2033
- Figure 11: Asia Pacific Pump Jack Industry Revenue Share (%), by Application 2025 & 2033
- Figure 12: Asia Pacific Pump Jack Industry Revenue (million), by Country 2025 & 2033
- Figure 13: Asia Pacific Pump Jack Industry Revenue Share (%), by Country 2025 & 2033
- Figure 14: Europe Pump Jack Industry Revenue (million), by Type 2025 & 2033
- Figure 15: Europe Pump Jack Industry Revenue Share (%), by Type 2025 & 2033
- Figure 16: Europe Pump Jack Industry Revenue (million), by Application 2025 & 2033
- Figure 17: Europe Pump Jack Industry Revenue Share (%), by Application 2025 & 2033
- Figure 18: Europe Pump Jack Industry Revenue (million), by Country 2025 & 2033
- Figure 19: Europe Pump Jack Industry Revenue Share (%), by Country 2025 & 2033
- Figure 20: South America Pump Jack Industry Revenue (million), by Type 2025 & 2033
- Figure 21: South America Pump Jack Industry Revenue Share (%), by Type 2025 & 2033
- Figure 22: South America Pump Jack Industry Revenue (million), by Application 2025 & 2033
- Figure 23: South America Pump Jack Industry Revenue Share (%), by Application 2025 & 2033
- Figure 24: South America Pump Jack Industry Revenue (million), by Country 2025 & 2033
- Figure 25: South America Pump Jack Industry Revenue Share (%), by Country 2025 & 2033
- Figure 26: Middle East and Africa Pump Jack Industry Revenue (million), by Type 2025 & 2033
- Figure 27: Middle East and Africa Pump Jack Industry Revenue Share (%), by Type 2025 & 2033
- Figure 28: Middle East and Africa Pump Jack Industry Revenue (million), by Application 2025 & 2033
- Figure 29: Middle East and Africa Pump Jack Industry Revenue Share (%), by Application 2025 & 2033
- Figure 30: Middle East and Africa Pump Jack Industry Revenue (million), by Country 2025 & 2033
- Figure 31: Middle East and Africa Pump Jack Industry Revenue Share (%), by Country 2025 & 2033
List of Tables
- Table 1: Global Pump Jack Industry Revenue million Forecast, by Type 2020 & 2033
- Table 2: Global Pump Jack Industry Revenue million Forecast, by Application 2020 & 2033
- Table 3: Global Pump Jack Industry Revenue million Forecast, by Region 2020 & 2033
- Table 4: Global Pump Jack Industry Revenue million Forecast, by Type 2020 & 2033
- Table 5: Global Pump Jack Industry Revenue million Forecast, by Application 2020 & 2033
- Table 6: Global Pump Jack Industry Revenue million Forecast, by Country 2020 & 2033
- Table 7: Global Pump Jack Industry Revenue million Forecast, by Type 2020 & 2033
- Table 8: Global Pump Jack Industry Revenue million Forecast, by Application 2020 & 2033
- Table 9: Global Pump Jack Industry Revenue million Forecast, by Country 2020 & 2033
- Table 10: Global Pump Jack Industry Revenue million Forecast, by Type 2020 & 2033
- Table 11: Global Pump Jack Industry Revenue million Forecast, by Application 2020 & 2033
- Table 12: Global Pump Jack Industry Revenue million Forecast, by Country 2020 & 2033
- Table 13: Global Pump Jack Industry Revenue million Forecast, by Type 2020 & 2033
- Table 14: Global Pump Jack Industry Revenue million Forecast, by Application 2020 & 2033
- Table 15: Global Pump Jack Industry Revenue million Forecast, by Country 2020 & 2033
- Table 16: Global Pump Jack Industry Revenue million Forecast, by Type 2020 & 2033
- Table 17: Global Pump Jack Industry Revenue million Forecast, by Application 2020 & 2033
- Table 18: Global Pump Jack Industry Revenue million Forecast, by Country 2020 & 2033
Frequently Asked Questions
1. What is the projected Compound Annual Growth Rate (CAGR) of the Pump Jack Industry?
The projected CAGR is approximately 5.7%.
2. Which companies are prominent players in the Pump Jack Industry?
Key companies in the market include Weil-McLain (Shandong) Cast-Iron-Boiler Co Ltd, Flotek Industries Inc, Alkhorayef Commercial Co, Baker Hughes Company, Halliburton Company, National-Oilwell Varco Inc, Borets International Ltd, Weatherford International Ltd, Schlumberger Limited, Dover Corp.
3. What are the main segments of the Pump Jack Industry?
The market segments include Type, Application.
4. Can you provide details about the market size?
The market size is estimated to be USD 3687.6 million as of 2022.
5. What are some drivers contributing to market growth?
4.; Focus On Unconventional Resources4.; Global Energy Demand And Exploration Activities.
6. What are the notable trends driving market growth?
Onshore Application to Dominate the Market.
7. Are there any restraints impacting market growth?
4.; High Implementation Costs.
8. Can you provide examples of recent developments in the market?
N/A
9. What pricing options are available for accessing the report?
Pricing options include single-user, multi-user, and enterprise licenses priced at USD 4750, USD 5250, and USD 8750 respectively.
10. Is the market size provided in terms of value or volume?
The market size is provided in terms of value, measured in million.
11. Are there any specific market keywords associated with the report?
Yes, the market keyword associated with the report is "Pump Jack Industry," which aids in identifying and referencing the specific market segment covered.
12. How do I determine which pricing option suits my needs best?
The pricing options vary based on user requirements and access needs. Individual users may opt for single-user licenses, while businesses requiring broader access may choose multi-user or enterprise licenses for cost-effective access to the report.
13. Are there any additional resources or data provided in the Pump Jack Industry report?
While the report offers comprehensive insights, it's advisable to review the specific contents or supplementary materials provided to ascertain if additional resources or data are available.
14. How can I stay updated on further developments or reports in the Pump Jack Industry?
To stay informed about further developments, trends, and reports in the Pump Jack Industry, consider subscribing to industry newsletters, following relevant companies and organizations, or regularly checking reputable industry news sources and publications.
Methodology
Step 1 - Identification of Relevant Samples Size from Population Database


Step 2 - Approaches for Defining Global Market Size (Value, Volume* & Price*)

Note*: In applicable scenarios
Step 3 - Data Sources
Primary Research
- Web Analytics
- Survey Reports
- Research Institute
- Latest Research Reports
- Opinion Leaders
Secondary Research
- Annual Reports
- White Paper
- Latest Press Release
- Industry Association
- Paid Database
- Investor Presentations

Step 4 - Data Triangulation
Involves using different sources of information in order to increase the validity of a study
These sources are likely to be stakeholders in a program - participants, other researchers, program staff, other community members, and so on.
Then we put all data in single framework & apply various statistical tools to find out the dynamic on the market.
During the analysis stage, feedback from the stakeholder groups would be compared to determine areas of agreement as well as areas of divergence