

Key Insights
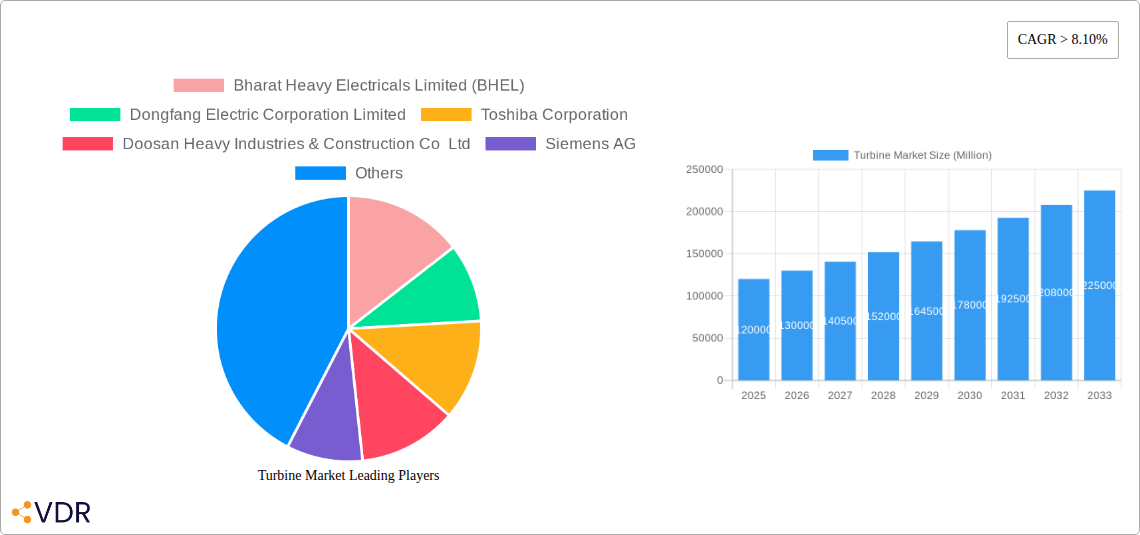
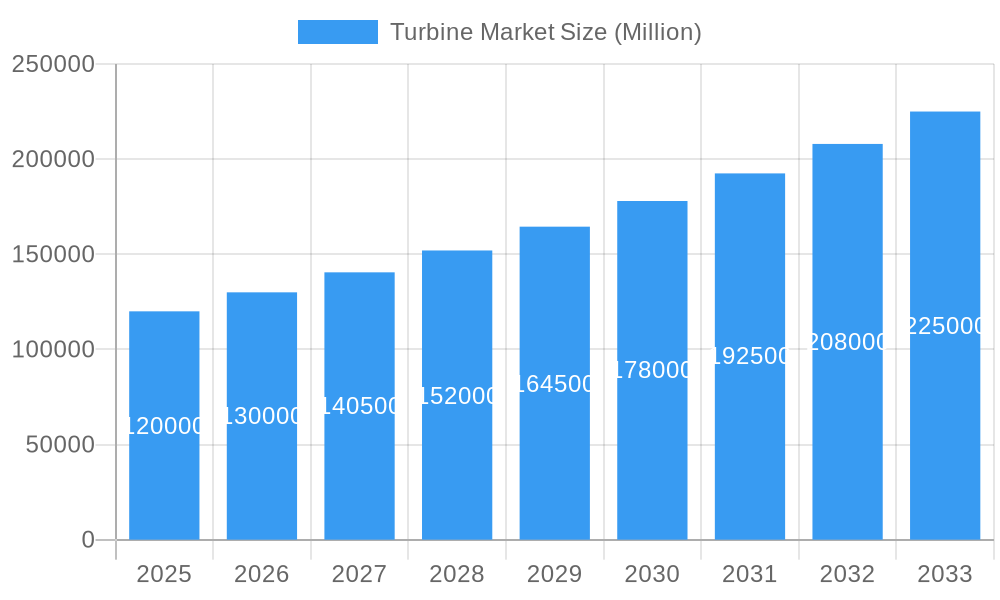
The global Turbine Market is poised for substantial expansion, projecting a market size of approximately $120,000 million by 2025, with a robust Compound Annual Growth Rate (CAGR) exceeding 8.10% during the forecast period of 2025-2033. This significant growth is primarily fueled by the escalating global demand for electricity and the imperative shift towards cleaner energy sources. Key drivers include government initiatives promoting renewable energy adoption, technological advancements enhancing turbine efficiency and reliability, and the increasing need to replace aging power generation infrastructure. The market segmentation reveals a dynamic landscape where Wind Turbines, particularly offshore installations, are expected to witness exponential growth due to their increasing viability and scale. Steam Turbines, vital for conventional power generation, will maintain a significant presence, while Gas Turbines will cater to peak demand and flexible power generation needs. Hydro Turbines, though mature, will continue to be a cornerstone of baseload power in regions with ample water resources. Major industry players like Siemens AG, Vestas Wind System A/S, and General Electric Company are heavily investing in research and development to innovate and capture market share, focusing on larger capacity turbines and integrated energy solutions.
Turbine Market Market Size (In Billion)
The projected trajectory of the Turbine Market is further shaped by evolving trends and certain restraining factors. The increasing integration of smart technologies and digital solutions, such as AI-powered predictive maintenance and advanced grid management systems, is a significant trend enhancing operational efficiency and reducing downtime across all turbine types. Furthermore, the growing emphasis on hybrid power generation models, combining different turbine technologies to optimize energy output and reliability, is gaining momentum. However, challenges such as high initial capital investment for large-scale projects, particularly in offshore wind, and complex regulatory frameworks in certain regions can pose restraints. Supply chain disruptions, raw material price volatility, and the need for skilled labor for installation and maintenance also present hurdles. Geographically, the Asia Pacific region is anticipated to lead market growth, driven by rapid industrialization, increasing energy consumption, and substantial investments in both renewable and conventional power generation. North America and Europe are also expected to show strong performance, propelled by aggressive renewable energy targets and technological innovation.
Turbine Market Company Market Share
This in-depth report provides a definitive analysis of the global Turbine Market, encompassing wind, steam, gas, and hydro turbines. It delves into intricate market dynamics, growth trajectories, regional dominance, product landscapes, key drivers, emerging opportunities, and the competitive strategies of major players. With a study period spanning from 2019 to 2033, and a base year of 2025, this report offers unparalleled insights and actionable intelligence for stakeholders navigating this vital energy sector.
Turbine Market Market Dynamics & Structure
The global Turbine Market is characterized by a moderately concentrated structure, with key players like Siemens AG, General Electric Company, and Vestas Wind System A/S holding significant market shares. Technological innovation is the primary driver, fueled by the relentless pursuit of higher efficiency, reduced emissions, and enhanced reliability across all turbine types. Regulatory frameworks, particularly those promoting renewable energy adoption and stringent environmental standards, significantly influence market growth and investment. While competitive product substitutes exist within each turbine category (e.g., advancements in solar PV impacting some gas turbine applications), the fundamental demand for large-scale power generation ensures sustained relevance for turbines. End-user demographics are shifting towards utilities and independent power producers prioritizing sustainable and cost-effective energy solutions, alongside industrial clients seeking to optimize their energy consumption. Mergers & Acquisitions (M&A) activity is present, driven by consolidation and strategic expansion into new markets or technologies.
- Market Concentration: Dominated by a few key global manufacturers, with regional players also holding niche market positions.
- Technological Innovation Drivers: Focus on increasing power output, improving energy conversion efficiency, reducing maintenance costs, and integrating smart technologies for predictive analytics and grid management.
- Regulatory Frameworks: Government incentives for renewable energy, carbon emission reduction targets, and grid modernization policies are key influencers.
- Competitive Product Substitutes: While alternatives exist in specific energy generation niches, the core demand for large-scale power remains robust.
- End-User Demographics: Increasing demand from utility-scale power generation, industrial co-generation, and off-grid power solutions.
- M&A Trends: Strategic acquisitions aimed at broadening product portfolios, expanding geographic reach, and securing technological advancements.
Turbine Market Growth Trends & Insights
The global Turbine Market is poised for robust growth, driven by the escalating demand for electricity and the global imperative to transition towards cleaner energy sources. The market size is projected to expand significantly from its historical figures in the 2019-2024 period, reaching an estimated value in millions of units by 2025 and continuing on an upward trajectory through the forecast period of 2025–2033. This expansion is underpinned by increasing adoption rates of renewable energy technologies, particularly wind and hydro power, alongside the continued reliance on steam and gas turbines for baseload and peak power generation. Technological disruptions are playing a pivotal role, with advancements in materials science, aerodynamic design, and digital control systems leading to turbines that are more efficient, reliable, and cost-effective. Consumer behavior shifts are also contributing, as governments, corporations, and individuals increasingly prioritize sustainability and energy security, leading to greater investment in turbine-based power generation. The CAGR (Compound Annual Growth Rate) is expected to be substantial, reflecting the dynamic nature of the energy sector and the critical role turbines play. Market penetration of advanced turbine technologies is steadily increasing, especially in developing economies eager to meet their growing energy needs sustainably. The integration of smart grid technologies and the growing demand for decentralized power generation solutions further amplify these positive growth trends. Furthermore, the increasing focus on hybrid energy systems, where turbines are integrated with other renewable sources like solar and battery storage, presents a significant avenue for market expansion and innovation. The continuous efforts to optimize operational efficiency and reduce the levelized cost of energy (LCOE) for all turbine types will further accelerate adoption and market growth across diverse geographical regions. The evolving energy landscape, with its emphasis on decarbonization and energy independence, solidifies the long-term positive outlook for the turbine market.
Dominant Regions, Countries, or Segments in Turbine Market
The global Turbine Market exhibits distinct regional and segmental leadership, with Asia-Pacific emerging as the dominant region, driven by China's massive investments in renewable energy and ongoing industrialization. Within this region, China stands out as a single country with unparalleled market share and growth potential across all turbine segments. The demand for wind turbines, both onshore and offshore, is exceptionally high, fueled by ambitious renewable energy targets and significant government support. Steam turbines, particularly in combined cycle configurations, remain crucial for meeting baseload power demands, while gas turbines are essential for grid flexibility and peak shaving. Hydro turbines also play a significant role, with numerous large-scale projects contributing to the region's power mix.
Key drivers of dominance in this region include:
- Economic Policies: Proactive government policies supporting renewable energy deployment, including subsidies, tax incentives, and feed-in tariffs.
- Infrastructure Development: Extensive investments in grid infrastructure to accommodate large-scale power generation and transmission.
- Industrialization and Urbanization: Rapid industrial growth and burgeoning urban populations create a sustained and escalating demand for electricity.
- Technological Advancements: Leading domestic manufacturers, such as Dongfang Electric Corporation Limited and Harbin Electric Company Limited, are continuously innovating and producing advanced turbine technologies.
- Cost Competitiveness: The region offers a competitive manufacturing base, leading to cost-effective turbine solutions.
While Asia-Pacific leads, other regions like Europe (with a strong focus on offshore wind) and North America (with significant investments in gas and wind power) also exhibit substantial market activity. Within segments, Wind Turbines (both onshore and offshore) are experiencing the most rapid growth and are increasingly capturing market share due to global decarbonization efforts. However, Steam Turbines continue to be a foundational segment for baseload power, and Gas Turbines are indispensable for grid stability and transitioning energy systems.
Turbine Market Product Landscape
The Turbine Market product landscape is characterized by continuous innovation aimed at enhancing efficiency, reducing environmental impact, and increasing power output. Wind Turbines are seeing larger rotor diameters and higher tower heights, boosting energy capture, with offshore turbines evolving into massive powerhouses. Steam Turbines are optimized for higher thermal efficiency in combined cycle power plants and improved reliability in steam cycle applications. Gas Turbines are advancing with higher operating temperatures and advanced combustion technologies for reduced emissions. Hydro Turbines, both reaction and impulse types, are being designed for greater efficiency across a wider range of flow conditions and are crucial for grid stability.
Key Drivers, Barriers & Challenges in Turbine Market
Key Drivers: The primary forces propelling the Turbine Market include the global push for decarbonization and renewable energy integration, leading to substantial investments in wind and hydro power. Favorable government policies, such as tax incentives and renewable portfolio standards, are critical catalysts. The increasing demand for energy security and grid stability drives the need for both renewable and efficient conventional turbines. Technological advancements leading to higher efficiency and lower operational costs further stimulate demand.
Barriers & Challenges: Significant supply chain disruptions and rising raw material costs present ongoing challenges. Regulatory hurdles and lengthy permitting processes can delay project development. Intense competitive pressures among global manufacturers can impact profit margins. Furthermore, the intermittency of renewable sources necessitates advancements in energy storage and grid management solutions, which are still evolving. The high upfront capital investment for turbine installations also poses a barrier for some markets.
Emerging Opportunities in Turbine Market
Emerging opportunities in the Turbine Market lie in the expansion of offshore wind energy, particularly in new geographic markets and with floating offshore wind technologies. The growing demand for hybrid power solutions, integrating turbines with solar and battery storage, presents a significant untapped market. Advancements in digitalization and AI-powered predictive maintenance offer opportunities to enhance turbine lifespan and reduce operational costs. The development of green hydrogen production, often powered by renewable energy from turbines, is another promising avenue. Furthermore, the increasing need for decentralized power generation in remote or developing regions opens up new application areas for smaller-scale turbine solutions.
Growth Accelerators in the Turbine Market Industry
Growth accelerators in the Turbine Market are primarily driven by technological breakthroughs in areas like advanced aerodynamics, materials science, and digital control systems, leading to more efficient and reliable turbines. Strategic partnerships between turbine manufacturers, energy developers, and technology providers are crucial for scaling up deployments and accessing new markets. Market expansion strategies, particularly into emerging economies with rapidly growing energy demands, are vital for long-term growth. The continuous drive towards cost reduction for renewable energy technologies, making turbines increasingly competitive with traditional power sources, also acts as a significant accelerator.
Key Players Shaping the Turbine Market Market
- Bharat Heavy Electricals Limited (BHEL)
- Dongfang Electric Corporation Limited
- Toshiba Corporation
- Doosan Heavy Industries & Construction Co Ltd
- Siemens AG
- Vestas Wind System A/S
- Mitsubishi Hitachi Power Systems Ltd (MHPS)
- General Electric Company
- Enercon GmbH
- Harbin Electric Company Limited
Notable Milestones in Turbine Market Sector
- 2022: Siemens Gamesa launches its next-generation offshore wind turbine, further increasing power output and efficiency.
- 2023: Vestas achieves a significant milestone in installed onshore wind capacity globally.
- 2024: General Electric announces advancements in gas turbine technology, achieving record-breaking efficiency.
- 2025 (Estimated): Increased deployment of floating offshore wind turbines in European waters.
- 2026-2030: Continued growth in hybrid renewable energy projects incorporating turbines and energy storage.
- 2031-2033: Anticipated significant advancements in turbine materials and designs leading to further efficiency gains and cost reductions.
In-Depth Turbine Market Market Outlook
The Turbine Market is set for sustained and robust growth, driven by the undeniable global transition towards sustainable energy. Key growth accelerators include ongoing technological innovations that enhance efficiency and reduce costs, alongside supportive government policies and increasing corporate commitments to renewable energy. Strategic partnerships and aggressive market expansion into high-demand regions will further fuel this growth. The market's future is intrinsically linked to its ability to provide reliable, cost-effective, and environmentally responsible power generation solutions, solidifying its indispensable role in the global energy landscape. Opportunities abound in emerging technologies and geographies, promising a dynamic and evolving market for years to come.
Turbine Market Segmentation
-
1. Type
-
1.1. Wind Turbines
- 1.1.1. Onshore
- 1.1.2. Offshore
-
1.2. Steam Turbines
- 1.2.1. Combined Cycle
- 1.2.2. Steam Cycle
-
1.3. Gas Turbines
- 1.3.1. Open Cycle
-
1.4. Hydro Turbines
- 1.4.1. Reaction
- 1.4.2. Impulse
-
1.1. Wind Turbines
Turbine Market Segmentation By Geography
- 1. North America
- 2. Europe
- 3. Asia Pacific
- 4. South America
- 5. Middle East and Africa
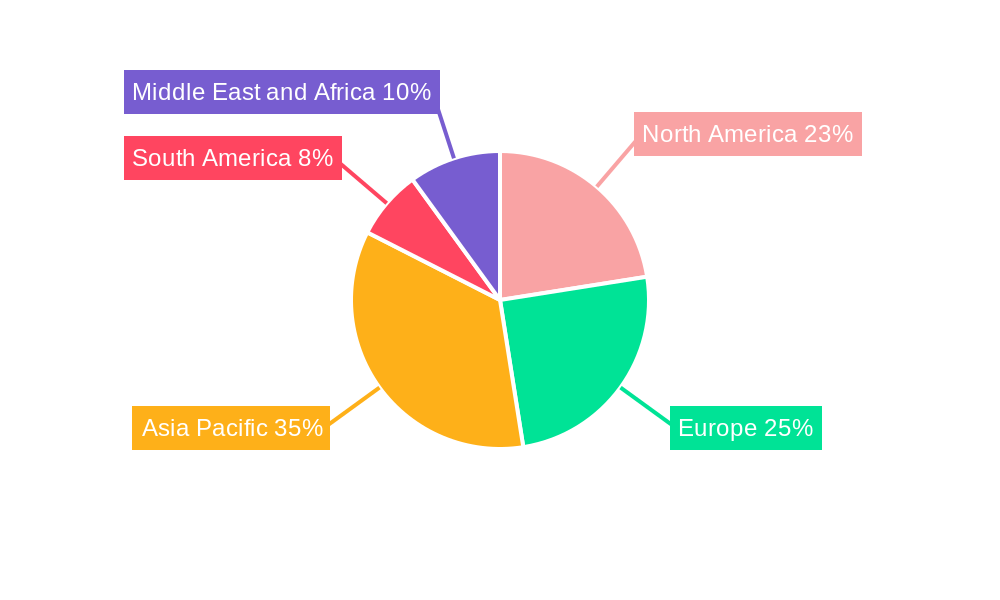
Turbine Market Regional Market Share
Geographic Coverage of Turbine Market
Turbine Market REPORT HIGHLIGHTS
| Aspects | Details |
|---|---|
| Study Period | 2020-2034 |
| Base Year | 2025 |
| Estimated Year | 2026 |
| Forecast Period | 2026-2034 |
| Historical Period | 2020-2025 |
| Growth Rate | CAGR of 6.7% from 2020-2034 |
| Segmentation |
|
Table of Contents
- 1. Introduction
- 1.1. Research Scope
- 1.2. Market Segmentation
- 1.3. Research Objective
- 1.4. Definitions and Assumptions
- 2. Executive Summary
- 2.1. Market Snapshot
- 3. Market Dynamics
- 3.1. Market Drivers
- 3.2. Market Restrains
- 3.3. Market Trends
- 3.4. Market Opportunities
- 4. Market Factor Analysis
- 4.1. Porters Five Forces
- 4.1.1. Bargaining Power of Suppliers
- 4.1.2. Bargaining Power of Buyers
- 4.1.3. Threat of New Entrants
- 4.1.4. Threat of Substitutes
- 4.1.5. Competitive Rivalry
- 4.2. PESTEL analysis
- 4.3. BCG Analysis
- 4.3.1. Stars (High Growth, High Market Share)
- 4.3.2. Cash Cows (Low Growth, High Market Share)
- 4.3.3. Question Mark (High Growth, Low Market Share)
- 4.3.4. Dogs (Low Growth, Low Market Share)
- 4.4. Ansoff Matrix Analysis
- 4.5. Supply Chain Analysis
- 4.6. Regulatory Landscape
- 4.7. Current Market Potential and Opportunity Assessment (TAM–SAM–SOM Framework)
- 4.8. VDR Analyst Note
- 4.1. Porters Five Forces
- 5. Market Analysis, Insights and Forecast 2021-2033
- 5.1. Market Analysis, Insights and Forecast - by Type
- 5.1.1. Wind Turbines
- 5.1.1.1. Onshore
- 5.1.1.2. Offshore
- 5.1.2. Steam Turbines
- 5.1.2.1. Combined Cycle
- 5.1.2.2. Steam Cycle
- 5.1.3. Gas Turbines
- 5.1.3.1. Open Cycle
- 5.1.4. Hydro Turbines
- 5.1.4.1. Reaction
- 5.1.4.2. Impulse
- 5.1.1. Wind Turbines
- 5.2. Market Analysis, Insights and Forecast - by Region
- 5.2.1. North America
- 5.2.2. Europe
- 5.2.3. Asia Pacific
- 5.2.4. South America
- 5.2.5. Middle East and Africa
- 5.1. Market Analysis, Insights and Forecast - by Type
- 6. Global Turbine Market Analysis, Insights and Forecast, 2021-2033
- 6.1. Market Analysis, Insights and Forecast - by Type
- 6.1.1. Wind Turbines
- 6.1.1.1. Onshore
- 6.1.1.2. Offshore
- 6.1.2. Steam Turbines
- 6.1.2.1. Combined Cycle
- 6.1.2.2. Steam Cycle
- 6.1.3. Gas Turbines
- 6.1.3.1. Open Cycle
- 6.1.4. Hydro Turbines
- 6.1.4.1. Reaction
- 6.1.4.2. Impulse
- 6.1.1. Wind Turbines
- 6.1. Market Analysis, Insights and Forecast - by Type
- 7. North America Turbine Market Analysis, Insights and Forecast, 2021-2033
- 7.1. Market Analysis, Insights and Forecast - by Type
- 7.1.1. Wind Turbines
- 7.1.1.1. Onshore
- 7.1.1.2. Offshore
- 7.1.2. Steam Turbines
- 7.1.2.1. Combined Cycle
- 7.1.2.2. Steam Cycle
- 7.1.3. Gas Turbines
- 7.1.3.1. Open Cycle
- 7.1.4. Hydro Turbines
- 7.1.4.1. Reaction
- 7.1.4.2. Impulse
- 7.1.1. Wind Turbines
- 7.1. Market Analysis, Insights and Forecast - by Type
- 8. Europe Turbine Market Analysis, Insights and Forecast, 2021-2033
- 8.1. Market Analysis, Insights and Forecast - by Type
- 8.1.1. Wind Turbines
- 8.1.1.1. Onshore
- 8.1.1.2. Offshore
- 8.1.2. Steam Turbines
- 8.1.2.1. Combined Cycle
- 8.1.2.2. Steam Cycle
- 8.1.3. Gas Turbines
- 8.1.3.1. Open Cycle
- 8.1.4. Hydro Turbines
- 8.1.4.1. Reaction
- 8.1.4.2. Impulse
- 8.1.1. Wind Turbines
- 8.1. Market Analysis, Insights and Forecast - by Type
- 9. Asia Pacific Turbine Market Analysis, Insights and Forecast, 2021-2033
- 9.1. Market Analysis, Insights and Forecast - by Type
- 9.1.1. Wind Turbines
- 9.1.1.1. Onshore
- 9.1.1.2. Offshore
- 9.1.2. Steam Turbines
- 9.1.2.1. Combined Cycle
- 9.1.2.2. Steam Cycle
- 9.1.3. Gas Turbines
- 9.1.3.1. Open Cycle
- 9.1.4. Hydro Turbines
- 9.1.4.1. Reaction
- 9.1.4.2. Impulse
- 9.1.1. Wind Turbines
- 9.1. Market Analysis, Insights and Forecast - by Type
- 10. South America Turbine Market Analysis, Insights and Forecast, 2021-2033
- 10.1. Market Analysis, Insights and Forecast - by Type
- 10.1.1. Wind Turbines
- 10.1.1.1. Onshore
- 10.1.1.2. Offshore
- 10.1.2. Steam Turbines
- 10.1.2.1. Combined Cycle
- 10.1.2.2. Steam Cycle
- 10.1.3. Gas Turbines
- 10.1.3.1. Open Cycle
- 10.1.4. Hydro Turbines
- 10.1.4.1. Reaction
- 10.1.4.2. Impulse
- 10.1.1. Wind Turbines
- 10.1. Market Analysis, Insights and Forecast - by Type
- 11. Middle East and Africa Turbine Market Analysis, Insights and Forecast, 2021-2033
- 11.1. Market Analysis, Insights and Forecast - by Type
- 11.1.1. Wind Turbines
- 11.1.1.1. Onshore
- 11.1.1.2. Offshore
- 11.1.2. Steam Turbines
- 11.1.2.1. Combined Cycle
- 11.1.2.2. Steam Cycle
- 11.1.3. Gas Turbines
- 11.1.3.1. Open Cycle
- 11.1.4. Hydro Turbines
- 11.1.4.1. Reaction
- 11.1.4.2. Impulse
- 11.1.1. Wind Turbines
- 11.1. Market Analysis, Insights and Forecast - by Type
- 12. Competitive Analysis
- 12.1. Company Profiles
- 12.1.1 Bharat Heavy Electricals Limited (BHEL)
- 12.1.1.1. Company Overview
- 12.1.1.2. Products
- 12.1.1.3. Company Financials
- 12.1.1.4. SWOT Analysis
- 12.1.2 Dongfang Electric Corporation Limited
- 12.1.2.1. Company Overview
- 12.1.2.2. Products
- 12.1.2.3. Company Financials
- 12.1.2.4. SWOT Analysis
- 12.1.3 Toshiba Corporation
- 12.1.3.1. Company Overview
- 12.1.3.2. Products
- 12.1.3.3. Company Financials
- 12.1.3.4. SWOT Analysis
- 12.1.4 Doosan Heavy Industries & Construction Co Ltd
- 12.1.4.1. Company Overview
- 12.1.4.2. Products
- 12.1.4.3. Company Financials
- 12.1.4.4. SWOT Analysis
- 12.1.5 Siemens AG
- 12.1.5.1. Company Overview
- 12.1.5.2. Products
- 12.1.5.3. Company Financials
- 12.1.5.4. SWOT Analysis
- 12.1.6 Vestas Wind System A/S*List Not Exhaustive
- 12.1.6.1. Company Overview
- 12.1.6.2. Products
- 12.1.6.3. Company Financials
- 12.1.6.4. SWOT Analysis
- 12.1.7 Mitsubishi Hitachi Power Systems Ltd (MHPS)
- 12.1.7.1. Company Overview
- 12.1.7.2. Products
- 12.1.7.3. Company Financials
- 12.1.7.4. SWOT Analysis
- 12.1.8 General Electric Company
- 12.1.8.1. Company Overview
- 12.1.8.2. Products
- 12.1.8.3. Company Financials
- 12.1.8.4. SWOT Analysis
- 12.1.9 Enercon GmbH
- 12.1.9.1. Company Overview
- 12.1.9.2. Products
- 12.1.9.3. Company Financials
- 12.1.9.4. SWOT Analysis
- 12.1.10 Harbin Electric Company Limited
- 12.1.10.1. Company Overview
- 12.1.10.2. Products
- 12.1.10.3. Company Financials
- 12.1.10.4. SWOT Analysis
- 12.1.1 Bharat Heavy Electricals Limited (BHEL)
- 12.2. Market Entropy
- 12.2.1 Company's Key Areas Served
- 12.2.2 Recent Developments
- 12.3. Company Market Share Analysis 2025
- 12.3.1 Top 5 Companies Market Share Analysis
- 12.3.2 Top 3 Companies Market Share Analysis
- 12.4. List of Potential Customers
- 13. Research Methodology
List of Figures
- Figure 1: Global Turbine Market Revenue Breakdown (billion, %) by Region 2025 & 2033
- Figure 2: Global Turbine Market Volume Breakdown (Megawatt, %) by Region 2025 & 2033
- Figure 3: North America Turbine Market Revenue (billion), by Type 2025 & 2033
- Figure 4: North America Turbine Market Volume (Megawatt), by Type 2025 & 2033
- Figure 5: North America Turbine Market Revenue Share (%), by Type 2025 & 2033
- Figure 6: North America Turbine Market Volume Share (%), by Type 2025 & 2033
- Figure 7: North America Turbine Market Revenue (billion), by Country 2025 & 2033
- Figure 8: North America Turbine Market Volume (Megawatt), by Country 2025 & 2033
- Figure 9: North America Turbine Market Revenue Share (%), by Country 2025 & 2033
- Figure 10: North America Turbine Market Volume Share (%), by Country 2025 & 2033
- Figure 11: Europe Turbine Market Revenue (billion), by Type 2025 & 2033
- Figure 12: Europe Turbine Market Volume (Megawatt), by Type 2025 & 2033
- Figure 13: Europe Turbine Market Revenue Share (%), by Type 2025 & 2033
- Figure 14: Europe Turbine Market Volume Share (%), by Type 2025 & 2033
- Figure 15: Europe Turbine Market Revenue (billion), by Country 2025 & 2033
- Figure 16: Europe Turbine Market Volume (Megawatt), by Country 2025 & 2033
- Figure 17: Europe Turbine Market Revenue Share (%), by Country 2025 & 2033
- Figure 18: Europe Turbine Market Volume Share (%), by Country 2025 & 2033
- Figure 19: Asia Pacific Turbine Market Revenue (billion), by Type 2025 & 2033
- Figure 20: Asia Pacific Turbine Market Volume (Megawatt), by Type 2025 & 2033
- Figure 21: Asia Pacific Turbine Market Revenue Share (%), by Type 2025 & 2033
- Figure 22: Asia Pacific Turbine Market Volume Share (%), by Type 2025 & 2033
- Figure 23: Asia Pacific Turbine Market Revenue (billion), by Country 2025 & 2033
- Figure 24: Asia Pacific Turbine Market Volume (Megawatt), by Country 2025 & 2033
- Figure 25: Asia Pacific Turbine Market Revenue Share (%), by Country 2025 & 2033
- Figure 26: Asia Pacific Turbine Market Volume Share (%), by Country 2025 & 2033
- Figure 27: South America Turbine Market Revenue (billion), by Type 2025 & 2033
- Figure 28: South America Turbine Market Volume (Megawatt), by Type 2025 & 2033
- Figure 29: South America Turbine Market Revenue Share (%), by Type 2025 & 2033
- Figure 30: South America Turbine Market Volume Share (%), by Type 2025 & 2033
- Figure 31: South America Turbine Market Revenue (billion), by Country 2025 & 2033
- Figure 32: South America Turbine Market Volume (Megawatt), by Country 2025 & 2033
- Figure 33: South America Turbine Market Revenue Share (%), by Country 2025 & 2033
- Figure 34: South America Turbine Market Volume Share (%), by Country 2025 & 2033
- Figure 35: Middle East and Africa Turbine Market Revenue (billion), by Type 2025 & 2033
- Figure 36: Middle East and Africa Turbine Market Volume (Megawatt), by Type 2025 & 2033
- Figure 37: Middle East and Africa Turbine Market Revenue Share (%), by Type 2025 & 2033
- Figure 38: Middle East and Africa Turbine Market Volume Share (%), by Type 2025 & 2033
- Figure 39: Middle East and Africa Turbine Market Revenue (billion), by Country 2025 & 2033
- Figure 40: Middle East and Africa Turbine Market Volume (Megawatt), by Country 2025 & 2033
- Figure 41: Middle East and Africa Turbine Market Revenue Share (%), by Country 2025 & 2033
- Figure 42: Middle East and Africa Turbine Market Volume Share (%), by Country 2025 & 2033
List of Tables
- Table 1: Global Turbine Market Revenue billion Forecast, by Type 2020 & 2033
- Table 2: Global Turbine Market Volume Megawatt Forecast, by Type 2020 & 2033
- Table 3: Global Turbine Market Revenue billion Forecast, by Region 2020 & 2033
- Table 4: Global Turbine Market Volume Megawatt Forecast, by Region 2020 & 2033
- Table 5: Global Turbine Market Revenue billion Forecast, by Type 2020 & 2033
- Table 6: Global Turbine Market Volume Megawatt Forecast, by Type 2020 & 2033
- Table 7: Global Turbine Market Revenue billion Forecast, by Country 2020 & 2033
- Table 8: Global Turbine Market Volume Megawatt Forecast, by Country 2020 & 2033
- Table 9: Global Turbine Market Revenue billion Forecast, by Type 2020 & 2033
- Table 10: Global Turbine Market Volume Megawatt Forecast, by Type 2020 & 2033
- Table 11: Global Turbine Market Revenue billion Forecast, by Country 2020 & 2033
- Table 12: Global Turbine Market Volume Megawatt Forecast, by Country 2020 & 2033
- Table 13: Global Turbine Market Revenue billion Forecast, by Type 2020 & 2033
- Table 14: Global Turbine Market Volume Megawatt Forecast, by Type 2020 & 2033
- Table 15: Global Turbine Market Revenue billion Forecast, by Country 2020 & 2033
- Table 16: Global Turbine Market Volume Megawatt Forecast, by Country 2020 & 2033
- Table 17: Global Turbine Market Revenue billion Forecast, by Type 2020 & 2033
- Table 18: Global Turbine Market Volume Megawatt Forecast, by Type 2020 & 2033
- Table 19: Global Turbine Market Revenue billion Forecast, by Country 2020 & 2033
- Table 20: Global Turbine Market Volume Megawatt Forecast, by Country 2020 & 2033
- Table 21: Global Turbine Market Revenue billion Forecast, by Type 2020 & 2033
- Table 22: Global Turbine Market Volume Megawatt Forecast, by Type 2020 & 2033
- Table 23: Global Turbine Market Revenue billion Forecast, by Country 2020 & 2033
- Table 24: Global Turbine Market Volume Megawatt Forecast, by Country 2020 & 2033
Frequently Asked Questions
1. What is the projected Compound Annual Growth Rate (CAGR) of the Turbine Market?
The projected CAGR is approximately 6.7%.
2. Which companies are prominent players in the Turbine Market?
Key companies in the market include Bharat Heavy Electricals Limited (BHEL), Dongfang Electric Corporation Limited, Toshiba Corporation, Doosan Heavy Industries & Construction Co Ltd, Siemens AG, Vestas Wind System A/S*List Not Exhaustive, Mitsubishi Hitachi Power Systems Ltd (MHPS), General Electric Company, Enercon GmbH, Harbin Electric Company Limited.
3. What are the main segments of the Turbine Market?
The market segments include Type.
4. Can you provide details about the market size?
The market size is estimated to be USD 185 billion as of 2022.
5. What are some drivers contributing to market growth?
Declining Costs of Solar Technologies4.; Demand for Decentralized Solar Energy Systems.
6. What are the notable trends driving market growth?
Wind Turbine Segment to Grow at the Fastest Rate.
7. Are there any restraints impacting market growth?
Absence of Any New Initiatives in the Country.
8. Can you provide examples of recent developments in the market?
N/A
9. What pricing options are available for accessing the report?
Pricing options include single-user, multi-user, and enterprise licenses priced at USD 4750, USD 5250, and USD 8750 respectively.
10. Is the market size provided in terms of value or volume?
The market size is provided in terms of value, measured in billion and volume, measured in Megawatt.
11. Are there any specific market keywords associated with the report?
Yes, the market keyword associated with the report is "Turbine Market," which aids in identifying and referencing the specific market segment covered.
12. How do I determine which pricing option suits my needs best?
The pricing options vary based on user requirements and access needs. Individual users may opt for single-user licenses, while businesses requiring broader access may choose multi-user or enterprise licenses for cost-effective access to the report.
13. Are there any additional resources or data provided in the Turbine Market report?
While the report offers comprehensive insights, it's advisable to review the specific contents or supplementary materials provided to ascertain if additional resources or data are available.
14. How can I stay updated on further developments or reports in the Turbine Market?
To stay informed about further developments, trends, and reports in the Turbine Market, consider subscribing to industry newsletters, following relevant companies and organizations, or regularly checking reputable industry news sources and publications.
Methodology
Step 1 - Identification of Relevant Samples Size from Population Database


Step 2 - Approaches for Defining Global Market Size (Value, Volume* & Price*)

Note*: In applicable scenarios
Step 3 - Data Sources
Primary Research
- Web Analytics
- Survey Reports
- Research Institute
- Latest Research Reports
- Opinion Leaders
Secondary Research
- Annual Reports
- White Paper
- Latest Press Release
- Industry Association
- Paid Database
- Investor Presentations

Step 4 - Data Triangulation
Involves using different sources of information in order to increase the validity of a study
These sources are likely to be stakeholders in a program - participants, other researchers, program staff, other community members, and so on.
Then we put all data in single framework & apply various statistical tools to find out the dynamic on the market.
During the analysis stage, feedback from the stakeholder groups would be compared to determine areas of agreement as well as areas of divergence