

Key Insights
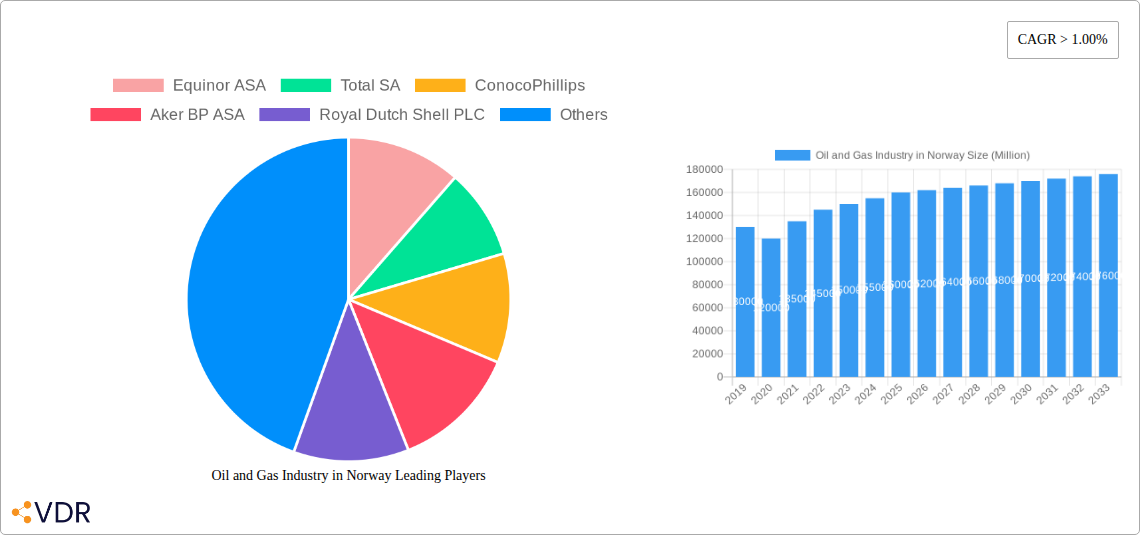
The Norwegian Oil and Gas industry is projected to experience steady growth, with an estimated market size of $70.2 billion in 2024, and a projected Compound Annual Growth Rate (CAGR) of 4.5% from 2024 to 2033. This expansion is underpinned by Norway's vast offshore hydrocarbon reserves, its established expertise in exploration and production, and ongoing technological advancements. Key growth drivers include the continued development of mature fields, the strategic exploitation of new discoveries, and robust demand for natural gas, particularly from European markets. Significant investments in advanced extraction technologies and a focus on operational efficiency are expected to boost production and revenue, solidifying Norway's position as a leading global energy supplier.
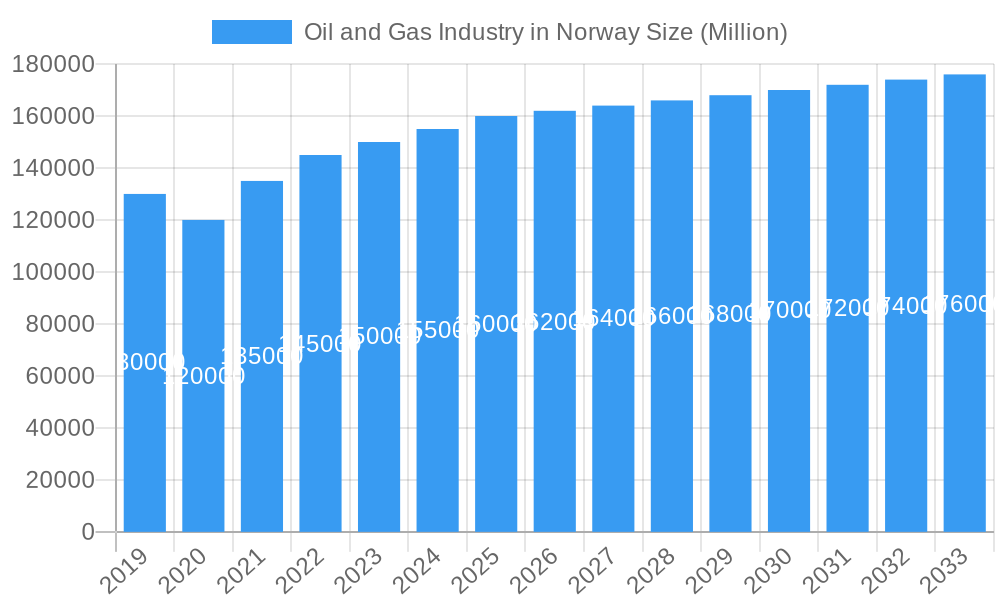
Oil and Gas Industry in Norway Market Size (In Billion)
While the market outlook is positive, several factors present potential challenges. Shifting global energy policies and the accelerating drive towards decarbonization pose a long-term threat to fossil fuel demand. Increasingly stringent environmental regulations and rising operational costs, including decommissioning liabilities, also exert pressure. In response, Norway is making substantial investments in Carbon Capture, Utilization, and Storage (CCUS) technologies and exploring renewable energy integration within its existing infrastructure. This strategic dual focus—optimizing hydrocarbon production while diversifying into cleaner energy—is essential for navigating the evolving energy landscape and ensuring the sector's long-term sustainability.
Oil and Gas Industry in Norway Company Market Share
This comprehensive report offers an in-depth analysis of the Norwegian Oil and Gas market. It provides critical insights into market dynamics, growth trajectories, regional influence, product segmentation, key drivers, challenges, and emerging opportunities. Covering the forecast period from 2019 to 2033, with 2024 as the base year, this research is invaluable for industry professionals, investors, and policymakers aiming to gain a strategic edge in this vital global energy market. All market values are presented in billions of USD.
Oil and Gas Industry in Norway Market Dynamics & Structure
The Norwegian oil and gas industry is characterized by a mature yet dynamic market structure, heavily influenced by technological innovation, stringent regulatory frameworks, and significant foreign investment. Market concentration remains high, with key players like Equinor ASA, Total SA, ConocoPhillips, Aker BP ASA, Royal Dutch Shell PLC, and Vår Energi AS commanding substantial market shares. Technological innovation is driven by the pursuit of enhanced oil recovery, efficient exploration in challenging environments, and the development of sustainable offshore practices. The regulatory environment, primarily governed by the Norwegian Petroleum Directorate, emphasizes safety, environmental protection, and equitable resource management, fostering a stable yet demanding operational landscape. Competitive product substitutes are gradually emerging, particularly in the renewable energy sector, prompting a strategic shift towards energy transition initiatives within established oil and gas companies. End-user demographics are largely industrial and international, driven by global energy demand. Mergers and acquisitions (M&A) trends continue to shape the landscape, with strategic consolidation aimed at optimizing operations and expanding portfolios. For instance, anticipated M&A deal volumes are projected to remain robust, reflecting the industry's ongoing maturation and the pursuit of operational synergies. Barriers to innovation include high capital expenditure requirements for frontier exploration and the inherent complexities of offshore operations, necessitating significant technological advancements and risk mitigation strategies.
Oil and Gas Industry in Norway Growth Trends & Insights
The Norwegian oil and gas industry is poised for sustained, albeit evolving, growth, driven by a combination of established production capabilities and increasing investment in new exploration and development projects. Over the historical period (2019-2024), the market has demonstrated resilience, with market size evolution influenced by fluctuating global energy prices and production volumes. Adoption rates of advanced technologies, such as digitalization and automation in offshore operations, are steadily increasing, contributing to efficiency gains and cost reductions. Technological disruptions are manifesting in the form of enhanced seismic imaging, improved drilling techniques, and the development of carbon capture and storage (CCS) solutions, signaling a move towards more sustainable energy production. Consumer behavior shifts, driven by global climate change awareness, are influencing policy decisions and encouraging a diversification of Norway's energy portfolio, though the demand for oil and gas remains substantial. The projected Compound Annual Growth Rate (CAGR) for the forecast period (2025-2033) is expected to be driven by the continued development of offshore fields and the optimization of existing infrastructure. Market penetration of new exploration technologies is high, reflecting Norway's commitment to maximizing its hydrocarbon resources while exploring lower-emission production methods. The base year (2025) estimates indicate a robust production output, with consumption analysis revealing a steady domestic and international demand.
Dominant Regions, Countries, or Segments in Oil and Gas Industry in Norway
The dominance within the Norwegian oil and gas industry is primarily driven by the Export Market Analysis (Value & Volume). Norway's strategic location, extensive offshore infrastructure, and significant proven reserves make it a leading global supplier of crude oil and natural gas. The North Sea and the Barents Sea regions are the focal points of production, with extensive infrastructure supporting extraction and transportation. Economic policies, such as licensing rounds and fiscal incentives, consistently encourage exploration and development, further solidifying Norway's export prowess. Infrastructure development, including subsea pipelines and floating production storage and offloading (FPSO) units, plays a crucial role in facilitating the efficient export of hydrocarbons. The market share in global energy exports is substantial, driven by the consistent demand from European countries. The growth potential for Norwegian exports remains high, supported by ongoing discoveries and the continuous optimization of production from existing fields.
- Export Market Dominance:
- Primary recipient markets include the European Union, with countries like the UK, Germany, and France being major importers.
- The value and volume of exports are directly correlated with global energy demand and price fluctuations.
- Norway's commitment to reliable supply chains enhances its attractiveness as an export partner.
- Production Hubs:
- The Norwegian Continental Shelf (NCS) is divided into the North Sea, Norwegian Sea, and Barents Sea, each contributing significantly to production.
- The development of fields like Johan Sverdrup and Troll continue to be major contributors to overall output.
- Infrastructure Advantage:
- Extensive network of subsea pipelines connecting offshore fields to onshore processing facilities and export terminals.
- Advanced offshore technologies, including floating production, storage, and offloading (FPSO) vessels, enable production in deepwater and harsh environments.
Oil and Gas Industry in Norway Product Landscape
The product landscape in the Norwegian oil and gas industry is dominated by the extraction and export of crude oil and natural gas. Innovations focus on optimizing production efficiency, reducing environmental impact, and enhancing safety in offshore operations. Technologies like advanced seismic imaging, sophisticated drilling techniques, and the implementation of digital twin solutions for asset management are key advancements. Performance metrics are centered around production output, recovery rates, and operational uptime. Unique selling propositions for Norwegian producers include high-quality crude oil and a reliable supply of natural gas, backed by a robust regulatory framework and advanced technological capabilities.
Key Drivers, Barriers & Challenges in Oil and Gas Industry in Norway
Key Drivers:
- Significant Proven Reserves: Norway possesses vast reserves of oil and natural gas, ensuring sustained production capacity.
- Advanced Technological Expertise: Continuous investment in R&D and the adoption of cutting-edge technologies drive efficiency and innovation.
- Strategic Global Position: Proximity to major European energy markets facilitates strong export demand.
- Supportive Regulatory Framework: A stable and predictable regulatory environment encourages investment and exploration.
Barriers & Challenges:
- Environmental Regulations and Climate Change Pressures: Increasing global focus on decarbonization necessitates adaptation and investment in cleaner energy solutions.
- High Operational Costs: Offshore exploration and production in challenging environments involve substantial capital expenditure and operational expenses.
- Geopolitical Volatility: Global energy market fluctuations and geopolitical tensions can impact prices and demand.
- Supply Chain Disruptions: Global events can lead to logistical challenges and increased costs for equipment and services. The estimated impact of potential supply chain disruptions on project timelines can be as high as 15%.
Emerging Opportunities in Oil and Gas Industry in Norway
Emerging opportunities in the Norwegian oil and gas industry lie in the strategic transition towards lower-carbon energy solutions. This includes the development and scaling of carbon capture and storage (CCS) technologies, which can leverage existing offshore infrastructure and geological formations. Furthermore, the exploration and production of smaller, more marginal fields, previously deemed uneconomical, are becoming viable with advancements in subsea technology and cost optimization strategies. The potential for developing offshore wind energy, integrated with existing oil and gas platforms, presents another significant opportunity, creating synergies and accelerating the energy transition.
Growth Accelerators in the Oil and Gas Industry in Norway Industry
Long-term growth in the Norwegian oil and gas industry will be accelerated by continued technological breakthroughs in areas such as artificial intelligence for reservoir management and predictive maintenance. Strategic partnerships between established players and technology providers will be crucial for the rapid deployment of innovative solutions. Market expansion strategies will likely involve further exploration in frontier areas and the optimization of existing assets to maximize recovery rates. The government's continued commitment to licensing rounds for exploration and development, coupled with a focus on sustainable energy practices, will act as a significant catalyst for future growth.
Key Players Shaping the Oil and Gas Industry in Norway Market
- Equinor ASA
- Total SA
- ConocoPhillips
- Aker BP ASA
- Royal Dutch Shell PLC
- Vår Energi AS
Notable Milestones in Oil and Gas Industry in Norway Sector
- March 2020: The Skogul field, operated by Aker BP, commenced production in the central Norwegian North Sea. Estimated recoverable resources: 1.5 million standard cubic meters of oil (9.4 million bbls).
- December 2020: ConocoPhillips Skandinavia AS announced a new oil discovery (wildcat well 6507/5-10 S) on the Slagugle prospect in the Norwegian Sea. Estimated recoverable oil equivalent: 12 to 32 million standard cubic meters (Sm3).
- February 2021: Equinor discovered hydrocarbons near the Troll field in the North Sea (wells 31/1-2 S and 31/1-2 A). Estimated recoverable oil equivalent: 7 to 11 million Sm3.
In-Depth Oil and Gas Industry in Norway Market Outlook
The future market potential for the Norwegian oil and gas industry is shaped by a dual focus: optimizing existing hydrocarbon production while proactively investing in the energy transition. Growth accelerators will include the successful implementation of large-scale carbon capture and storage (CCS) projects, such as Northern Lights, which are expected to significantly reduce the carbon footprint of offshore operations. Continued investment in digitalization and automation will enhance efficiency and reduce operational costs, making even marginal fields economically viable. Strategic partnerships and the development of integrated energy solutions, including offshore wind power, will further solidify Norway's position as a leader in sustainable energy production and supply.
Oil and Gas Industry in Norway Segmentation
- 1. Production Analysis
- 2. Consumption Analysis
- 3. Import Market Analysis (Value & Volume)
- 4. Export Market Analysis (Value & Volume)
- 5. Price Trend Analysis
Oil and Gas Industry in Norway Segmentation By Geography
-
1. North America
- 1.1. United States
- 1.2. Canada
- 1.3. Mexico
-
2. South America
- 2.1. Brazil
- 2.2. Argentina
- 2.3. Rest of South America
-
3. Europe
- 3.1. United Kingdom
- 3.2. Germany
- 3.3. France
- 3.4. Italy
- 3.5. Spain
- 3.6. Russia
- 3.7. Benelux
- 3.8. Nordics
- 3.9. Rest of Europe
-
4. Middle East & Africa
- 4.1. Turkey
- 4.2. Israel
- 4.3. GCC
- 4.4. North Africa
- 4.5. South Africa
- 4.6. Rest of Middle East & Africa
-
5. Asia Pacific
- 5.1. China
- 5.2. India
- 5.3. Japan
- 5.4. South Korea
- 5.5. ASEAN
- 5.6. Oceania
- 5.7. Rest of Asia Pacific
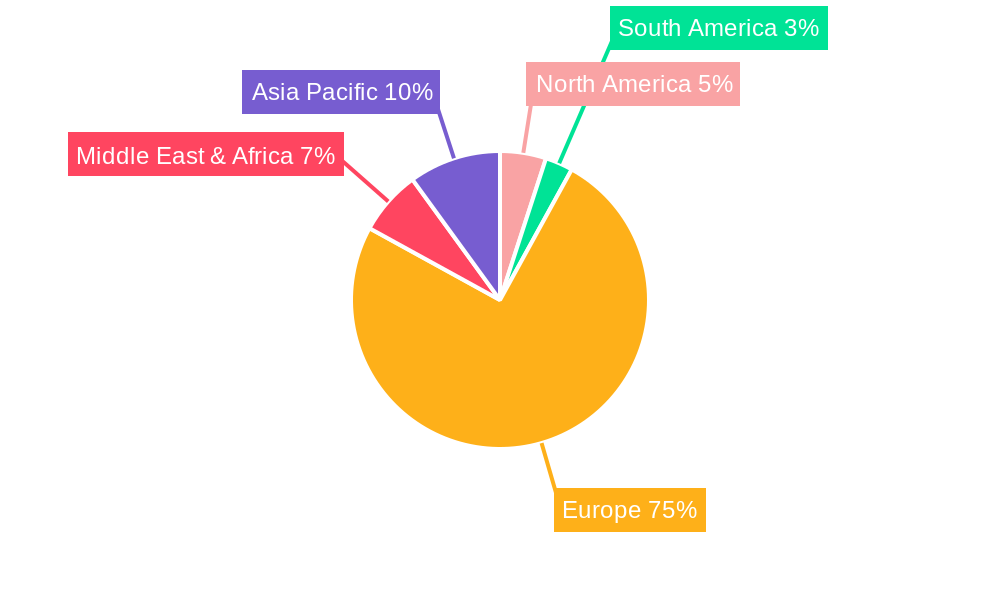
Oil and Gas Industry in Norway Regional Market Share
Geographic Coverage of Oil and Gas Industry in Norway
Oil and Gas Industry in Norway REPORT HIGHLIGHTS
| Aspects | Details |
|---|---|
| Study Period | 2020-2034 |
| Base Year | 2025 |
| Estimated Year | 2026 |
| Forecast Period | 2026-2034 |
| Historical Period | 2020-2025 |
| Growth Rate | CAGR of 4.5% from 2020-2034 |
| Segmentation |
|
Table of Contents
- 1. Introduction
- 1.1. Research Scope
- 1.2. Market Segmentation
- 1.3. Research Objective
- 1.4. Definitions and Assumptions
- 2. Executive Summary
- 2.1. Market Snapshot
- 3. Market Dynamics
- 3.1. Market Drivers
- 3.2. Market Restrains
- 3.3. Market Trends
- 3.4. Market Opportunities
- 4. Market Factor Analysis
- 4.1. Porters Five Forces
- 4.1.1. Bargaining Power of Suppliers
- 4.1.2. Bargaining Power of Buyers
- 4.1.3. Threat of New Entrants
- 4.1.4. Threat of Substitutes
- 4.1.5. Competitive Rivalry
- 4.2. PESTEL analysis
- 4.3. BCG Analysis
- 4.3.1. Stars (High Growth, High Market Share)
- 4.3.2. Cash Cows (Low Growth, High Market Share)
- 4.3.3. Question Mark (High Growth, Low Market Share)
- 4.3.4. Dogs (Low Growth, Low Market Share)
- 4.4. Ansoff Matrix Analysis
- 4.5. Supply Chain Analysis
- 4.6. Regulatory Landscape
- 4.7. Current Market Potential and Opportunity Assessment (TAM–SAM–SOM Framework)
- 4.8. VDR Analyst Note
- 4.1. Porters Five Forces
- 5. Market Analysis, Insights and Forecast 2021-2033
- 5.1. Market Analysis, Insights and Forecast - by Production Analysis
- 5.2. Market Analysis, Insights and Forecast - by Consumption Analysis
- 5.3. Market Analysis, Insights and Forecast - by Import Market Analysis (Value & Volume)
- 5.4. Market Analysis, Insights and Forecast - by Export Market Analysis (Value & Volume)
- 5.5. Market Analysis, Insights and Forecast - by Price Trend Analysis
- 5.6. Market Analysis, Insights and Forecast - by Region
- 5.6.1. North America
- 5.6.2. South America
- 5.6.3. Europe
- 5.6.4. Middle East & Africa
- 5.6.5. Asia Pacific
- 6. Global Oil and Gas Industry in Norway Analysis, Insights and Forecast, 2021-2033
- 6.1. Market Analysis, Insights and Forecast - by Production Analysis
- 6.2. Market Analysis, Insights and Forecast - by Consumption Analysis
- 6.3. Market Analysis, Insights and Forecast - by Import Market Analysis (Value & Volume)
- 6.4. Market Analysis, Insights and Forecast - by Export Market Analysis (Value & Volume)
- 6.5. Market Analysis, Insights and Forecast - by Price Trend Analysis
- 7. North America Oil and Gas Industry in Norway Analysis, Insights and Forecast, 2021-2033
- 7.1. Market Analysis, Insights and Forecast - by Production Analysis
- 7.2. Market Analysis, Insights and Forecast - by Consumption Analysis
- 7.3. Market Analysis, Insights and Forecast - by Import Market Analysis (Value & Volume)
- 7.4. Market Analysis, Insights and Forecast - by Export Market Analysis (Value & Volume)
- 7.5. Market Analysis, Insights and Forecast - by Price Trend Analysis
- 8. South America Oil and Gas Industry in Norway Analysis, Insights and Forecast, 2021-2033
- 8.1. Market Analysis, Insights and Forecast - by Production Analysis
- 8.2. Market Analysis, Insights and Forecast - by Consumption Analysis
- 8.3. Market Analysis, Insights and Forecast - by Import Market Analysis (Value & Volume)
- 8.4. Market Analysis, Insights and Forecast - by Export Market Analysis (Value & Volume)
- 8.5. Market Analysis, Insights and Forecast - by Price Trend Analysis
- 9. Europe Oil and Gas Industry in Norway Analysis, Insights and Forecast, 2021-2033
- 9.1. Market Analysis, Insights and Forecast - by Production Analysis
- 9.2. Market Analysis, Insights and Forecast - by Consumption Analysis
- 9.3. Market Analysis, Insights and Forecast - by Import Market Analysis (Value & Volume)
- 9.4. Market Analysis, Insights and Forecast - by Export Market Analysis (Value & Volume)
- 9.5. Market Analysis, Insights and Forecast - by Price Trend Analysis
- 10. Middle East & Africa Oil and Gas Industry in Norway Analysis, Insights and Forecast, 2021-2033
- 10.1. Market Analysis, Insights and Forecast - by Production Analysis
- 10.2. Market Analysis, Insights and Forecast - by Consumption Analysis
- 10.3. Market Analysis, Insights and Forecast - by Import Market Analysis (Value & Volume)
- 10.4. Market Analysis, Insights and Forecast - by Export Market Analysis (Value & Volume)
- 10.5. Market Analysis, Insights and Forecast - by Price Trend Analysis
- 11. Asia Pacific Oil and Gas Industry in Norway Analysis, Insights and Forecast, 2021-2033
- 11.1. Market Analysis, Insights and Forecast - by Production Analysis
- 11.2. Market Analysis, Insights and Forecast - by Consumption Analysis
- 11.3. Market Analysis, Insights and Forecast - by Import Market Analysis (Value & Volume)
- 11.4. Market Analysis, Insights and Forecast - by Export Market Analysis (Value & Volume)
- 11.5. Market Analysis, Insights and Forecast - by Price Trend Analysis
- 12. Competitive Analysis
- 12.1. Company Profiles
- 12.1.1 Equinor ASA
- 12.1.1.1. Company Overview
- 12.1.1.2. Products
- 12.1.1.3. Company Financials
- 12.1.1.4. SWOT Analysis
- 12.1.2 Total SA
- 12.1.2.1. Company Overview
- 12.1.2.2. Products
- 12.1.2.3. Company Financials
- 12.1.2.4. SWOT Analysis
- 12.1.3 ConocoPhillips
- 12.1.3.1. Company Overview
- 12.1.3.2. Products
- 12.1.3.3. Company Financials
- 12.1.3.4. SWOT Analysis
- 12.1.4 Aker BP ASA
- 12.1.4.1. Company Overview
- 12.1.4.2. Products
- 12.1.4.3. Company Financials
- 12.1.4.4. SWOT Analysis
- 12.1.5 Royal Dutch Shell PLC
- 12.1.5.1. Company Overview
- 12.1.5.2. Products
- 12.1.5.3. Company Financials
- 12.1.5.4. SWOT Analysis
- 12.1.6 Vår Energi AS*List Not Exhaustive
- 12.1.6.1. Company Overview
- 12.1.6.2. Products
- 12.1.6.3. Company Financials
- 12.1.6.4. SWOT Analysis
- 12.1.1 Equinor ASA
- 12.2. Market Entropy
- 12.2.1 Company's Key Areas Served
- 12.2.2 Recent Developments
- 12.3. Company Market Share Analysis 2025
- 12.3.1 Top 5 Companies Market Share Analysis
- 12.3.2 Top 3 Companies Market Share Analysis
- 12.4. List of Potential Customers
- 13. Research Methodology
List of Figures
- Figure 1: Global Oil and Gas Industry in Norway Revenue Breakdown (billion, %) by Region 2025 & 2033
- Figure 2: Global Oil and Gas Industry in Norway Volume Breakdown (Tonnes, %) by Region 2025 & 2033
- Figure 3: North America Oil and Gas Industry in Norway Revenue (billion), by Production Analysis 2025 & 2033
- Figure 4: North America Oil and Gas Industry in Norway Volume (Tonnes), by Production Analysis 2025 & 2033
- Figure 5: North America Oil and Gas Industry in Norway Revenue Share (%), by Production Analysis 2025 & 2033
- Figure 6: North America Oil and Gas Industry in Norway Volume Share (%), by Production Analysis 2025 & 2033
- Figure 7: North America Oil and Gas Industry in Norway Revenue (billion), by Consumption Analysis 2025 & 2033
- Figure 8: North America Oil and Gas Industry in Norway Volume (Tonnes), by Consumption Analysis 2025 & 2033
- Figure 9: North America Oil and Gas Industry in Norway Revenue Share (%), by Consumption Analysis 2025 & 2033
- Figure 10: North America Oil and Gas Industry in Norway Volume Share (%), by Consumption Analysis 2025 & 2033
- Figure 11: North America Oil and Gas Industry in Norway Revenue (billion), by Import Market Analysis (Value & Volume) 2025 & 2033
- Figure 12: North America Oil and Gas Industry in Norway Volume (Tonnes), by Import Market Analysis (Value & Volume) 2025 & 2033
- Figure 13: North America Oil and Gas Industry in Norway Revenue Share (%), by Import Market Analysis (Value & Volume) 2025 & 2033
- Figure 14: North America Oil and Gas Industry in Norway Volume Share (%), by Import Market Analysis (Value & Volume) 2025 & 2033
- Figure 15: North America Oil and Gas Industry in Norway Revenue (billion), by Export Market Analysis (Value & Volume) 2025 & 2033
- Figure 16: North America Oil and Gas Industry in Norway Volume (Tonnes), by Export Market Analysis (Value & Volume) 2025 & 2033
- Figure 17: North America Oil and Gas Industry in Norway Revenue Share (%), by Export Market Analysis (Value & Volume) 2025 & 2033
- Figure 18: North America Oil and Gas Industry in Norway Volume Share (%), by Export Market Analysis (Value & Volume) 2025 & 2033
- Figure 19: North America Oil and Gas Industry in Norway Revenue (billion), by Price Trend Analysis 2025 & 2033
- Figure 20: North America Oil and Gas Industry in Norway Volume (Tonnes), by Price Trend Analysis 2025 & 2033
- Figure 21: North America Oil and Gas Industry in Norway Revenue Share (%), by Price Trend Analysis 2025 & 2033
- Figure 22: North America Oil and Gas Industry in Norway Volume Share (%), by Price Trend Analysis 2025 & 2033
- Figure 23: North America Oil and Gas Industry in Norway Revenue (billion), by Country 2025 & 2033
- Figure 24: North America Oil and Gas Industry in Norway Volume (Tonnes), by Country 2025 & 2033
- Figure 25: North America Oil and Gas Industry in Norway Revenue Share (%), by Country 2025 & 2033
- Figure 26: North America Oil and Gas Industry in Norway Volume Share (%), by Country 2025 & 2033
- Figure 27: South America Oil and Gas Industry in Norway Revenue (billion), by Production Analysis 2025 & 2033
- Figure 28: South America Oil and Gas Industry in Norway Volume (Tonnes), by Production Analysis 2025 & 2033
- Figure 29: South America Oil and Gas Industry in Norway Revenue Share (%), by Production Analysis 2025 & 2033
- Figure 30: South America Oil and Gas Industry in Norway Volume Share (%), by Production Analysis 2025 & 2033
- Figure 31: South America Oil and Gas Industry in Norway Revenue (billion), by Consumption Analysis 2025 & 2033
- Figure 32: South America Oil and Gas Industry in Norway Volume (Tonnes), by Consumption Analysis 2025 & 2033
- Figure 33: South America Oil and Gas Industry in Norway Revenue Share (%), by Consumption Analysis 2025 & 2033
- Figure 34: South America Oil and Gas Industry in Norway Volume Share (%), by Consumption Analysis 2025 & 2033
- Figure 35: South America Oil and Gas Industry in Norway Revenue (billion), by Import Market Analysis (Value & Volume) 2025 & 2033
- Figure 36: South America Oil and Gas Industry in Norway Volume (Tonnes), by Import Market Analysis (Value & Volume) 2025 & 2033
- Figure 37: South America Oil and Gas Industry in Norway Revenue Share (%), by Import Market Analysis (Value & Volume) 2025 & 2033
- Figure 38: South America Oil and Gas Industry in Norway Volume Share (%), by Import Market Analysis (Value & Volume) 2025 & 2033
- Figure 39: South America Oil and Gas Industry in Norway Revenue (billion), by Export Market Analysis (Value & Volume) 2025 & 2033
- Figure 40: South America Oil and Gas Industry in Norway Volume (Tonnes), by Export Market Analysis (Value & Volume) 2025 & 2033
- Figure 41: South America Oil and Gas Industry in Norway Revenue Share (%), by Export Market Analysis (Value & Volume) 2025 & 2033
- Figure 42: South America Oil and Gas Industry in Norway Volume Share (%), by Export Market Analysis (Value & Volume) 2025 & 2033
- Figure 43: South America Oil and Gas Industry in Norway Revenue (billion), by Price Trend Analysis 2025 & 2033
- Figure 44: South America Oil and Gas Industry in Norway Volume (Tonnes), by Price Trend Analysis 2025 & 2033
- Figure 45: South America Oil and Gas Industry in Norway Revenue Share (%), by Price Trend Analysis 2025 & 2033
- Figure 46: South America Oil and Gas Industry in Norway Volume Share (%), by Price Trend Analysis 2025 & 2033
- Figure 47: South America Oil and Gas Industry in Norway Revenue (billion), by Country 2025 & 2033
- Figure 48: South America Oil and Gas Industry in Norway Volume (Tonnes), by Country 2025 & 2033
- Figure 49: South America Oil and Gas Industry in Norway Revenue Share (%), by Country 2025 & 2033
- Figure 50: South America Oil and Gas Industry in Norway Volume Share (%), by Country 2025 & 2033
- Figure 51: Europe Oil and Gas Industry in Norway Revenue (billion), by Production Analysis 2025 & 2033
- Figure 52: Europe Oil and Gas Industry in Norway Volume (Tonnes), by Production Analysis 2025 & 2033
- Figure 53: Europe Oil and Gas Industry in Norway Revenue Share (%), by Production Analysis 2025 & 2033
- Figure 54: Europe Oil and Gas Industry in Norway Volume Share (%), by Production Analysis 2025 & 2033
- Figure 55: Europe Oil and Gas Industry in Norway Revenue (billion), by Consumption Analysis 2025 & 2033
- Figure 56: Europe Oil and Gas Industry in Norway Volume (Tonnes), by Consumption Analysis 2025 & 2033
- Figure 57: Europe Oil and Gas Industry in Norway Revenue Share (%), by Consumption Analysis 2025 & 2033
- Figure 58: Europe Oil and Gas Industry in Norway Volume Share (%), by Consumption Analysis 2025 & 2033
- Figure 59: Europe Oil and Gas Industry in Norway Revenue (billion), by Import Market Analysis (Value & Volume) 2025 & 2033
- Figure 60: Europe Oil and Gas Industry in Norway Volume (Tonnes), by Import Market Analysis (Value & Volume) 2025 & 2033
- Figure 61: Europe Oil and Gas Industry in Norway Revenue Share (%), by Import Market Analysis (Value & Volume) 2025 & 2033
- Figure 62: Europe Oil and Gas Industry in Norway Volume Share (%), by Import Market Analysis (Value & Volume) 2025 & 2033
- Figure 63: Europe Oil and Gas Industry in Norway Revenue (billion), by Export Market Analysis (Value & Volume) 2025 & 2033
- Figure 64: Europe Oil and Gas Industry in Norway Volume (Tonnes), by Export Market Analysis (Value & Volume) 2025 & 2033
- Figure 65: Europe Oil and Gas Industry in Norway Revenue Share (%), by Export Market Analysis (Value & Volume) 2025 & 2033
- Figure 66: Europe Oil and Gas Industry in Norway Volume Share (%), by Export Market Analysis (Value & Volume) 2025 & 2033
- Figure 67: Europe Oil and Gas Industry in Norway Revenue (billion), by Price Trend Analysis 2025 & 2033
- Figure 68: Europe Oil and Gas Industry in Norway Volume (Tonnes), by Price Trend Analysis 2025 & 2033
- Figure 69: Europe Oil and Gas Industry in Norway Revenue Share (%), by Price Trend Analysis 2025 & 2033
- Figure 70: Europe Oil and Gas Industry in Norway Volume Share (%), by Price Trend Analysis 2025 & 2033
- Figure 71: Europe Oil and Gas Industry in Norway Revenue (billion), by Country 2025 & 2033
- Figure 72: Europe Oil and Gas Industry in Norway Volume (Tonnes), by Country 2025 & 2033
- Figure 73: Europe Oil and Gas Industry in Norway Revenue Share (%), by Country 2025 & 2033
- Figure 74: Europe Oil and Gas Industry in Norway Volume Share (%), by Country 2025 & 2033
- Figure 75: Middle East & Africa Oil and Gas Industry in Norway Revenue (billion), by Production Analysis 2025 & 2033
- Figure 76: Middle East & Africa Oil and Gas Industry in Norway Volume (Tonnes), by Production Analysis 2025 & 2033
- Figure 77: Middle East & Africa Oil and Gas Industry in Norway Revenue Share (%), by Production Analysis 2025 & 2033
- Figure 78: Middle East & Africa Oil and Gas Industry in Norway Volume Share (%), by Production Analysis 2025 & 2033
- Figure 79: Middle East & Africa Oil and Gas Industry in Norway Revenue (billion), by Consumption Analysis 2025 & 2033
- Figure 80: Middle East & Africa Oil and Gas Industry in Norway Volume (Tonnes), by Consumption Analysis 2025 & 2033
- Figure 81: Middle East & Africa Oil and Gas Industry in Norway Revenue Share (%), by Consumption Analysis 2025 & 2033
- Figure 82: Middle East & Africa Oil and Gas Industry in Norway Volume Share (%), by Consumption Analysis 2025 & 2033
- Figure 83: Middle East & Africa Oil and Gas Industry in Norway Revenue (billion), by Import Market Analysis (Value & Volume) 2025 & 2033
- Figure 84: Middle East & Africa Oil and Gas Industry in Norway Volume (Tonnes), by Import Market Analysis (Value & Volume) 2025 & 2033
- Figure 85: Middle East & Africa Oil and Gas Industry in Norway Revenue Share (%), by Import Market Analysis (Value & Volume) 2025 & 2033
- Figure 86: Middle East & Africa Oil and Gas Industry in Norway Volume Share (%), by Import Market Analysis (Value & Volume) 2025 & 2033
- Figure 87: Middle East & Africa Oil and Gas Industry in Norway Revenue (billion), by Export Market Analysis (Value & Volume) 2025 & 2033
- Figure 88: Middle East & Africa Oil and Gas Industry in Norway Volume (Tonnes), by Export Market Analysis (Value & Volume) 2025 & 2033
- Figure 89: Middle East & Africa Oil and Gas Industry in Norway Revenue Share (%), by Export Market Analysis (Value & Volume) 2025 & 2033
- Figure 90: Middle East & Africa Oil and Gas Industry in Norway Volume Share (%), by Export Market Analysis (Value & Volume) 2025 & 2033
- Figure 91: Middle East & Africa Oil and Gas Industry in Norway Revenue (billion), by Price Trend Analysis 2025 & 2033
- Figure 92: Middle East & Africa Oil and Gas Industry in Norway Volume (Tonnes), by Price Trend Analysis 2025 & 2033
- Figure 93: Middle East & Africa Oil and Gas Industry in Norway Revenue Share (%), by Price Trend Analysis 2025 & 2033
- Figure 94: Middle East & Africa Oil and Gas Industry in Norway Volume Share (%), by Price Trend Analysis 2025 & 2033
- Figure 95: Middle East & Africa Oil and Gas Industry in Norway Revenue (billion), by Country 2025 & 2033
- Figure 96: Middle East & Africa Oil and Gas Industry in Norway Volume (Tonnes), by Country 2025 & 2033
- Figure 97: Middle East & Africa Oil and Gas Industry in Norway Revenue Share (%), by Country 2025 & 2033
- Figure 98: Middle East & Africa Oil and Gas Industry in Norway Volume Share (%), by Country 2025 & 2033
- Figure 99: Asia Pacific Oil and Gas Industry in Norway Revenue (billion), by Production Analysis 2025 & 2033
- Figure 100: Asia Pacific Oil and Gas Industry in Norway Volume (Tonnes), by Production Analysis 2025 & 2033
- Figure 101: Asia Pacific Oil and Gas Industry in Norway Revenue Share (%), by Production Analysis 2025 & 2033
- Figure 102: Asia Pacific Oil and Gas Industry in Norway Volume Share (%), by Production Analysis 2025 & 2033
- Figure 103: Asia Pacific Oil and Gas Industry in Norway Revenue (billion), by Consumption Analysis 2025 & 2033
- Figure 104: Asia Pacific Oil and Gas Industry in Norway Volume (Tonnes), by Consumption Analysis 2025 & 2033
- Figure 105: Asia Pacific Oil and Gas Industry in Norway Revenue Share (%), by Consumption Analysis 2025 & 2033
- Figure 106: Asia Pacific Oil and Gas Industry in Norway Volume Share (%), by Consumption Analysis 2025 & 2033
- Figure 107: Asia Pacific Oil and Gas Industry in Norway Revenue (billion), by Import Market Analysis (Value & Volume) 2025 & 2033
- Figure 108: Asia Pacific Oil and Gas Industry in Norway Volume (Tonnes), by Import Market Analysis (Value & Volume) 2025 & 2033
- Figure 109: Asia Pacific Oil and Gas Industry in Norway Revenue Share (%), by Import Market Analysis (Value & Volume) 2025 & 2033
- Figure 110: Asia Pacific Oil and Gas Industry in Norway Volume Share (%), by Import Market Analysis (Value & Volume) 2025 & 2033
- Figure 111: Asia Pacific Oil and Gas Industry in Norway Revenue (billion), by Export Market Analysis (Value & Volume) 2025 & 2033
- Figure 112: Asia Pacific Oil and Gas Industry in Norway Volume (Tonnes), by Export Market Analysis (Value & Volume) 2025 & 2033
- Figure 113: Asia Pacific Oil and Gas Industry in Norway Revenue Share (%), by Export Market Analysis (Value & Volume) 2025 & 2033
- Figure 114: Asia Pacific Oil and Gas Industry in Norway Volume Share (%), by Export Market Analysis (Value & Volume) 2025 & 2033
- Figure 115: Asia Pacific Oil and Gas Industry in Norway Revenue (billion), by Price Trend Analysis 2025 & 2033
- Figure 116: Asia Pacific Oil and Gas Industry in Norway Volume (Tonnes), by Price Trend Analysis 2025 & 2033
- Figure 117: Asia Pacific Oil and Gas Industry in Norway Revenue Share (%), by Price Trend Analysis 2025 & 2033
- Figure 118: Asia Pacific Oil and Gas Industry in Norway Volume Share (%), by Price Trend Analysis 2025 & 2033
- Figure 119: Asia Pacific Oil and Gas Industry in Norway Revenue (billion), by Country 2025 & 2033
- Figure 120: Asia Pacific Oil and Gas Industry in Norway Volume (Tonnes), by Country 2025 & 2033
- Figure 121: Asia Pacific Oil and Gas Industry in Norway Revenue Share (%), by Country 2025 & 2033
- Figure 122: Asia Pacific Oil and Gas Industry in Norway Volume Share (%), by Country 2025 & 2033
List of Tables
- Table 1: Global Oil and Gas Industry in Norway Revenue billion Forecast, by Production Analysis 2020 & 2033
- Table 2: Global Oil and Gas Industry in Norway Volume Tonnes Forecast, by Production Analysis 2020 & 2033
- Table 3: Global Oil and Gas Industry in Norway Revenue billion Forecast, by Consumption Analysis 2020 & 2033
- Table 4: Global Oil and Gas Industry in Norway Volume Tonnes Forecast, by Consumption Analysis 2020 & 2033
- Table 5: Global Oil and Gas Industry in Norway Revenue billion Forecast, by Import Market Analysis (Value & Volume) 2020 & 2033
- Table 6: Global Oil and Gas Industry in Norway Volume Tonnes Forecast, by Import Market Analysis (Value & Volume) 2020 & 2033
- Table 7: Global Oil and Gas Industry in Norway Revenue billion Forecast, by Export Market Analysis (Value & Volume) 2020 & 2033
- Table 8: Global Oil and Gas Industry in Norway Volume Tonnes Forecast, by Export Market Analysis (Value & Volume) 2020 & 2033
- Table 9: Global Oil and Gas Industry in Norway Revenue billion Forecast, by Price Trend Analysis 2020 & 2033
- Table 10: Global Oil and Gas Industry in Norway Volume Tonnes Forecast, by Price Trend Analysis 2020 & 2033
- Table 11: Global Oil and Gas Industry in Norway Revenue billion Forecast, by Region 2020 & 2033
- Table 12: Global Oil and Gas Industry in Norway Volume Tonnes Forecast, by Region 2020 & 2033
- Table 13: Global Oil and Gas Industry in Norway Revenue billion Forecast, by Production Analysis 2020 & 2033
- Table 14: Global Oil and Gas Industry in Norway Volume Tonnes Forecast, by Production Analysis 2020 & 2033
- Table 15: Global Oil and Gas Industry in Norway Revenue billion Forecast, by Consumption Analysis 2020 & 2033
- Table 16: Global Oil and Gas Industry in Norway Volume Tonnes Forecast, by Consumption Analysis 2020 & 2033
- Table 17: Global Oil and Gas Industry in Norway Revenue billion Forecast, by Import Market Analysis (Value & Volume) 2020 & 2033
- Table 18: Global Oil and Gas Industry in Norway Volume Tonnes Forecast, by Import Market Analysis (Value & Volume) 2020 & 2033
- Table 19: Global Oil and Gas Industry in Norway Revenue billion Forecast, by Export Market Analysis (Value & Volume) 2020 & 2033
- Table 20: Global Oil and Gas Industry in Norway Volume Tonnes Forecast, by Export Market Analysis (Value & Volume) 2020 & 2033
- Table 21: Global Oil and Gas Industry in Norway Revenue billion Forecast, by Price Trend Analysis 2020 & 2033
- Table 22: Global Oil and Gas Industry in Norway Volume Tonnes Forecast, by Price Trend Analysis 2020 & 2033
- Table 23: Global Oil and Gas Industry in Norway Revenue billion Forecast, by Country 2020 & 2033
- Table 24: Global Oil and Gas Industry in Norway Volume Tonnes Forecast, by Country 2020 & 2033
- Table 25: United States Oil and Gas Industry in Norway Revenue (billion) Forecast, by Application 2020 & 2033
- Table 26: United States Oil and Gas Industry in Norway Volume (Tonnes) Forecast, by Application 2020 & 2033
- Table 27: Canada Oil and Gas Industry in Norway Revenue (billion) Forecast, by Application 2020 & 2033
- Table 28: Canada Oil and Gas Industry in Norway Volume (Tonnes) Forecast, by Application 2020 & 2033
- Table 29: Mexico Oil and Gas Industry in Norway Revenue (billion) Forecast, by Application 2020 & 2033
- Table 30: Mexico Oil and Gas Industry in Norway Volume (Tonnes) Forecast, by Application 2020 & 2033
- Table 31: Global Oil and Gas Industry in Norway Revenue billion Forecast, by Production Analysis 2020 & 2033
- Table 32: Global Oil and Gas Industry in Norway Volume Tonnes Forecast, by Production Analysis 2020 & 2033
- Table 33: Global Oil and Gas Industry in Norway Revenue billion Forecast, by Consumption Analysis 2020 & 2033
- Table 34: Global Oil and Gas Industry in Norway Volume Tonnes Forecast, by Consumption Analysis 2020 & 2033
- Table 35: Global Oil and Gas Industry in Norway Revenue billion Forecast, by Import Market Analysis (Value & Volume) 2020 & 2033
- Table 36: Global Oil and Gas Industry in Norway Volume Tonnes Forecast, by Import Market Analysis (Value & Volume) 2020 & 2033
- Table 37: Global Oil and Gas Industry in Norway Revenue billion Forecast, by Export Market Analysis (Value & Volume) 2020 & 2033
- Table 38: Global Oil and Gas Industry in Norway Volume Tonnes Forecast, by Export Market Analysis (Value & Volume) 2020 & 2033
- Table 39: Global Oil and Gas Industry in Norway Revenue billion Forecast, by Price Trend Analysis 2020 & 2033
- Table 40: Global Oil and Gas Industry in Norway Volume Tonnes Forecast, by Price Trend Analysis 2020 & 2033
- Table 41: Global Oil and Gas Industry in Norway Revenue billion Forecast, by Country 2020 & 2033
- Table 42: Global Oil and Gas Industry in Norway Volume Tonnes Forecast, by Country 2020 & 2033
- Table 43: Brazil Oil and Gas Industry in Norway Revenue (billion) Forecast, by Application 2020 & 2033
- Table 44: Brazil Oil and Gas Industry in Norway Volume (Tonnes) Forecast, by Application 2020 & 2033
- Table 45: Argentina Oil and Gas Industry in Norway Revenue (billion) Forecast, by Application 2020 & 2033
- Table 46: Argentina Oil and Gas Industry in Norway Volume (Tonnes) Forecast, by Application 2020 & 2033
- Table 47: Rest of South America Oil and Gas Industry in Norway Revenue (billion) Forecast, by Application 2020 & 2033
- Table 48: Rest of South America Oil and Gas Industry in Norway Volume (Tonnes) Forecast, by Application 2020 & 2033
- Table 49: Global Oil and Gas Industry in Norway Revenue billion Forecast, by Production Analysis 2020 & 2033
- Table 50: Global Oil and Gas Industry in Norway Volume Tonnes Forecast, by Production Analysis 2020 & 2033
- Table 51: Global Oil and Gas Industry in Norway Revenue billion Forecast, by Consumption Analysis 2020 & 2033
- Table 52: Global Oil and Gas Industry in Norway Volume Tonnes Forecast, by Consumption Analysis 2020 & 2033
- Table 53: Global Oil and Gas Industry in Norway Revenue billion Forecast, by Import Market Analysis (Value & Volume) 2020 & 2033
- Table 54: Global Oil and Gas Industry in Norway Volume Tonnes Forecast, by Import Market Analysis (Value & Volume) 2020 & 2033
- Table 55: Global Oil and Gas Industry in Norway Revenue billion Forecast, by Export Market Analysis (Value & Volume) 2020 & 2033
- Table 56: Global Oil and Gas Industry in Norway Volume Tonnes Forecast, by Export Market Analysis (Value & Volume) 2020 & 2033
- Table 57: Global Oil and Gas Industry in Norway Revenue billion Forecast, by Price Trend Analysis 2020 & 2033
- Table 58: Global Oil and Gas Industry in Norway Volume Tonnes Forecast, by Price Trend Analysis 2020 & 2033
- Table 59: Global Oil and Gas Industry in Norway Revenue billion Forecast, by Country 2020 & 2033
- Table 60: Global Oil and Gas Industry in Norway Volume Tonnes Forecast, by Country 2020 & 2033
- Table 61: United Kingdom Oil and Gas Industry in Norway Revenue (billion) Forecast, by Application 2020 & 2033
- Table 62: United Kingdom Oil and Gas Industry in Norway Volume (Tonnes) Forecast, by Application 2020 & 2033
- Table 63: Germany Oil and Gas Industry in Norway Revenue (billion) Forecast, by Application 2020 & 2033
- Table 64: Germany Oil and Gas Industry in Norway Volume (Tonnes) Forecast, by Application 2020 & 2033
- Table 65: France Oil and Gas Industry in Norway Revenue (billion) Forecast, by Application 2020 & 2033
- Table 66: France Oil and Gas Industry in Norway Volume (Tonnes) Forecast, by Application 2020 & 2033
- Table 67: Italy Oil and Gas Industry in Norway Revenue (billion) Forecast, by Application 2020 & 2033
- Table 68: Italy Oil and Gas Industry in Norway Volume (Tonnes) Forecast, by Application 2020 & 2033
- Table 69: Spain Oil and Gas Industry in Norway Revenue (billion) Forecast, by Application 2020 & 2033
- Table 70: Spain Oil and Gas Industry in Norway Volume (Tonnes) Forecast, by Application 2020 & 2033
- Table 71: Russia Oil and Gas Industry in Norway Revenue (billion) Forecast, by Application 2020 & 2033
- Table 72: Russia Oil and Gas Industry in Norway Volume (Tonnes) Forecast, by Application 2020 & 2033
- Table 73: Benelux Oil and Gas Industry in Norway Revenue (billion) Forecast, by Application 2020 & 2033
- Table 74: Benelux Oil and Gas Industry in Norway Volume (Tonnes) Forecast, by Application 2020 & 2033
- Table 75: Nordics Oil and Gas Industry in Norway Revenue (billion) Forecast, by Application 2020 & 2033
- Table 76: Nordics Oil and Gas Industry in Norway Volume (Tonnes) Forecast, by Application 2020 & 2033
- Table 77: Rest of Europe Oil and Gas Industry in Norway Revenue (billion) Forecast, by Application 2020 & 2033
- Table 78: Rest of Europe Oil and Gas Industry in Norway Volume (Tonnes) Forecast, by Application 2020 & 2033
- Table 79: Global Oil and Gas Industry in Norway Revenue billion Forecast, by Production Analysis 2020 & 2033
- Table 80: Global Oil and Gas Industry in Norway Volume Tonnes Forecast, by Production Analysis 2020 & 2033
- Table 81: Global Oil and Gas Industry in Norway Revenue billion Forecast, by Consumption Analysis 2020 & 2033
- Table 82: Global Oil and Gas Industry in Norway Volume Tonnes Forecast, by Consumption Analysis 2020 & 2033
- Table 83: Global Oil and Gas Industry in Norway Revenue billion Forecast, by Import Market Analysis (Value & Volume) 2020 & 2033
- Table 84: Global Oil and Gas Industry in Norway Volume Tonnes Forecast, by Import Market Analysis (Value & Volume) 2020 & 2033
- Table 85: Global Oil and Gas Industry in Norway Revenue billion Forecast, by Export Market Analysis (Value & Volume) 2020 & 2033
- Table 86: Global Oil and Gas Industry in Norway Volume Tonnes Forecast, by Export Market Analysis (Value & Volume) 2020 & 2033
- Table 87: Global Oil and Gas Industry in Norway Revenue billion Forecast, by Price Trend Analysis 2020 & 2033
- Table 88: Global Oil and Gas Industry in Norway Volume Tonnes Forecast, by Price Trend Analysis 2020 & 2033
- Table 89: Global Oil and Gas Industry in Norway Revenue billion Forecast, by Country 2020 & 2033
- Table 90: Global Oil and Gas Industry in Norway Volume Tonnes Forecast, by Country 2020 & 2033
- Table 91: Turkey Oil and Gas Industry in Norway Revenue (billion) Forecast, by Application 2020 & 2033
- Table 92: Turkey Oil and Gas Industry in Norway Volume (Tonnes) Forecast, by Application 2020 & 2033
- Table 93: Israel Oil and Gas Industry in Norway Revenue (billion) Forecast, by Application 2020 & 2033
- Table 94: Israel Oil and Gas Industry in Norway Volume (Tonnes) Forecast, by Application 2020 & 2033
- Table 95: GCC Oil and Gas Industry in Norway Revenue (billion) Forecast, by Application 2020 & 2033
- Table 96: GCC Oil and Gas Industry in Norway Volume (Tonnes) Forecast, by Application 2020 & 2033
- Table 97: North Africa Oil and Gas Industry in Norway Revenue (billion) Forecast, by Application 2020 & 2033
- Table 98: North Africa Oil and Gas Industry in Norway Volume (Tonnes) Forecast, by Application 2020 & 2033
- Table 99: South Africa Oil and Gas Industry in Norway Revenue (billion) Forecast, by Application 2020 & 2033
- Table 100: South Africa Oil and Gas Industry in Norway Volume (Tonnes) Forecast, by Application 2020 & 2033
- Table 101: Rest of Middle East & Africa Oil and Gas Industry in Norway Revenue (billion) Forecast, by Application 2020 & 2033
- Table 102: Rest of Middle East & Africa Oil and Gas Industry in Norway Volume (Tonnes) Forecast, by Application 2020 & 2033
- Table 103: Global Oil and Gas Industry in Norway Revenue billion Forecast, by Production Analysis 2020 & 2033
- Table 104: Global Oil and Gas Industry in Norway Volume Tonnes Forecast, by Production Analysis 2020 & 2033
- Table 105: Global Oil and Gas Industry in Norway Revenue billion Forecast, by Consumption Analysis 2020 & 2033
- Table 106: Global Oil and Gas Industry in Norway Volume Tonnes Forecast, by Consumption Analysis 2020 & 2033
- Table 107: Global Oil and Gas Industry in Norway Revenue billion Forecast, by Import Market Analysis (Value & Volume) 2020 & 2033
- Table 108: Global Oil and Gas Industry in Norway Volume Tonnes Forecast, by Import Market Analysis (Value & Volume) 2020 & 2033
- Table 109: Global Oil and Gas Industry in Norway Revenue billion Forecast, by Export Market Analysis (Value & Volume) 2020 & 2033
- Table 110: Global Oil and Gas Industry in Norway Volume Tonnes Forecast, by Export Market Analysis (Value & Volume) 2020 & 2033
- Table 111: Global Oil and Gas Industry in Norway Revenue billion Forecast, by Price Trend Analysis 2020 & 2033
- Table 112: Global Oil and Gas Industry in Norway Volume Tonnes Forecast, by Price Trend Analysis 2020 & 2033
- Table 113: Global Oil and Gas Industry in Norway Revenue billion Forecast, by Country 2020 & 2033
- Table 114: Global Oil and Gas Industry in Norway Volume Tonnes Forecast, by Country 2020 & 2033
- Table 115: China Oil and Gas Industry in Norway Revenue (billion) Forecast, by Application 2020 & 2033
- Table 116: China Oil and Gas Industry in Norway Volume (Tonnes) Forecast, by Application 2020 & 2033
- Table 117: India Oil and Gas Industry in Norway Revenue (billion) Forecast, by Application 2020 & 2033
- Table 118: India Oil and Gas Industry in Norway Volume (Tonnes) Forecast, by Application 2020 & 2033
- Table 119: Japan Oil and Gas Industry in Norway Revenue (billion) Forecast, by Application 2020 & 2033
- Table 120: Japan Oil and Gas Industry in Norway Volume (Tonnes) Forecast, by Application 2020 & 2033
- Table 121: South Korea Oil and Gas Industry in Norway Revenue (billion) Forecast, by Application 2020 & 2033
- Table 122: South Korea Oil and Gas Industry in Norway Volume (Tonnes) Forecast, by Application 2020 & 2033
- Table 123: ASEAN Oil and Gas Industry in Norway Revenue (billion) Forecast, by Application 2020 & 2033
- Table 124: ASEAN Oil and Gas Industry in Norway Volume (Tonnes) Forecast, by Application 2020 & 2033
- Table 125: Oceania Oil and Gas Industry in Norway Revenue (billion) Forecast, by Application 2020 & 2033
- Table 126: Oceania Oil and Gas Industry in Norway Volume (Tonnes) Forecast, by Application 2020 & 2033
- Table 127: Rest of Asia Pacific Oil and Gas Industry in Norway Revenue (billion) Forecast, by Application 2020 & 2033
- Table 128: Rest of Asia Pacific Oil and Gas Industry in Norway Volume (Tonnes) Forecast, by Application 2020 & 2033
Frequently Asked Questions
1. What is the projected Compound Annual Growth Rate (CAGR) of the Oil and Gas Industry in Norway?
The projected CAGR is approximately 4.5%.
2. Which companies are prominent players in the Oil and Gas Industry in Norway?
Key companies in the market include Equinor ASA, Total SA, ConocoPhillips, Aker BP ASA, Royal Dutch Shell PLC, Vår Energi AS*List Not Exhaustive.
3. What are the main segments of the Oil and Gas Industry in Norway?
The market segments include Production Analysis, Consumption Analysis, Import Market Analysis (Value & Volume), Export Market Analysis (Value & Volume), Price Trend Analysis.
4. Can you provide details about the market size?
The market size is estimated to be USD 70.2 billion as of 2022.
5. What are some drivers contributing to market growth?
4.; Increasing Demand for Wood Pellets in Clean Energy Generation4.; Growing Wood Pellet Manufacturing Infrastructure.
6. What are the notable trends driving market growth?
Development of New Oilfields to Drive the Market.
7. Are there any restraints impacting market growth?
4.; The Adoption and Increasing Deployment of Alternative Renewable Energy.
8. Can you provide examples of recent developments in the market?
In March 2020, the Skogul field located in the central part of the Norwegian North Sea, operated by Aker BP had started production. The field is estimated to contain recoverable resources of 1.5 million standard cubic meters of oil (9.4 million bbls).
9. What pricing options are available for accessing the report?
Pricing options include single-user, multi-user, and enterprise licenses priced at USD 3800, USD 4500, and USD 5800 respectively.
10. Is the market size provided in terms of value or volume?
The market size is provided in terms of value, measured in billion and volume, measured in Tonnes.
11. Are there any specific market keywords associated with the report?
Yes, the market keyword associated with the report is "Oil and Gas Industry in Norway," which aids in identifying and referencing the specific market segment covered.
12. How do I determine which pricing option suits my needs best?
The pricing options vary based on user requirements and access needs. Individual users may opt for single-user licenses, while businesses requiring broader access may choose multi-user or enterprise licenses for cost-effective access to the report.
13. Are there any additional resources or data provided in the Oil and Gas Industry in Norway report?
While the report offers comprehensive insights, it's advisable to review the specific contents or supplementary materials provided to ascertain if additional resources or data are available.
14. How can I stay updated on further developments or reports in the Oil and Gas Industry in Norway?
To stay informed about further developments, trends, and reports in the Oil and Gas Industry in Norway, consider subscribing to industry newsletters, following relevant companies and organizations, or regularly checking reputable industry news sources and publications.
Methodology
Step 1 - Identification of Relevant Samples Size from Population Database


Step 2 - Approaches for Defining Global Market Size (Value, Volume* & Price*)

Note*: In applicable scenarios
Step 3 - Data Sources
Primary Research
- Web Analytics
- Survey Reports
- Research Institute
- Latest Research Reports
- Opinion Leaders
Secondary Research
- Annual Reports
- White Paper
- Latest Press Release
- Industry Association
- Paid Database
- Investor Presentations

Step 4 - Data Triangulation
Involves using different sources of information in order to increase the validity of a study
These sources are likely to be stakeholders in a program - participants, other researchers, program staff, other community members, and so on.
Then we put all data in single framework & apply various statistical tools to find out the dynamic on the market.
During the analysis stage, feedback from the stakeholder groups would be compared to determine areas of agreement as well as areas of divergence