

Key Insights
The global Oil & Gas Pump Market is poised for substantial growth, propelled by escalating energy demand and sustained investment in upstream exploration and production. The market is projected to reach $14.27 billion by 2025, with a Compound Annual Growth Rate (CAGR) of 8.8% from 2025 to 2033. This expansion is fundamentally driven by the indispensable role of pumps across the entire oil and gas lifecycle, encompassing extraction (upstream), transportation (midstream), and refining (downstream). Key growth catalysts include the necessity for efficient fluid handling in demanding operational settings, the replacement of aging infrastructure, and ongoing innovations in pump design for enhanced energy efficiency and operational reliability. The market is bifurcated into Dynamic Pumps, vital for high-volume, continuous fluid transfer, and Positive Displacement Pumps, critical for precise metering and handling of viscous substances.
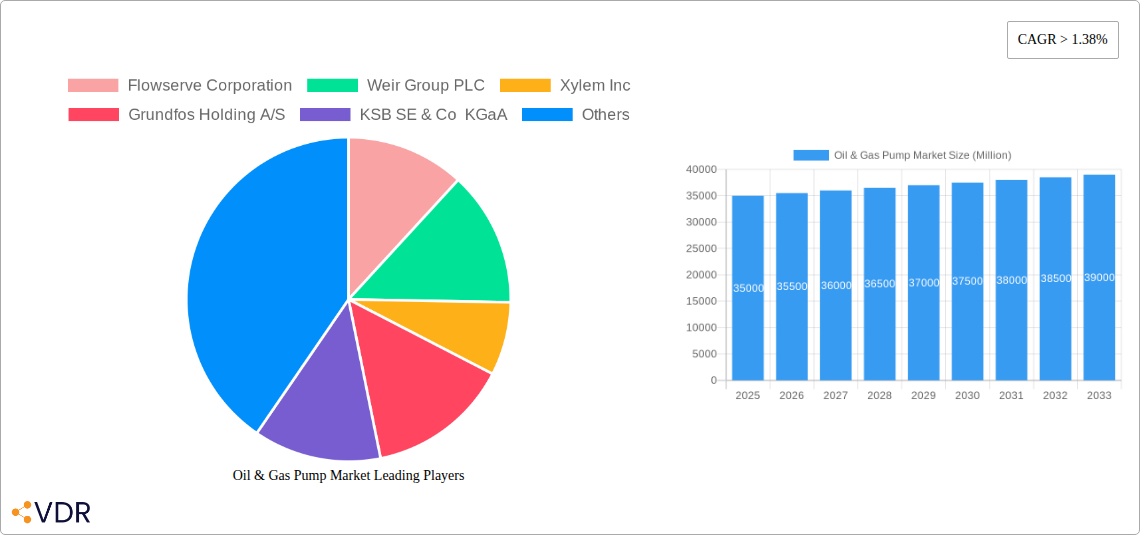
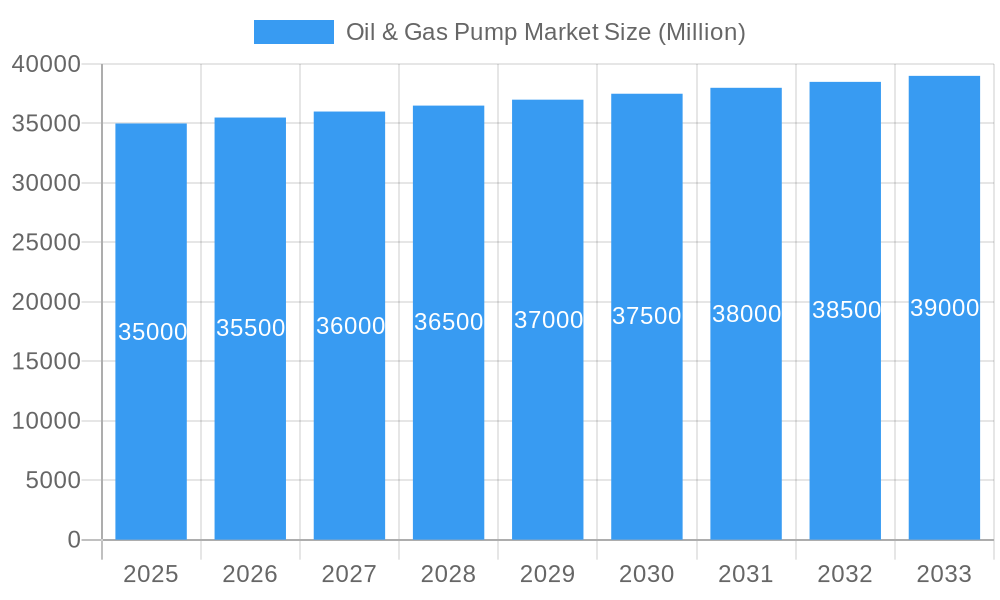
Oil & Gas Pump Market Market Size (In Billion)
Emerging trends, such as the integration of smart pumps with IoT functionalities for predictive maintenance and operational enhancement, are actively reshaping the market. Moreover, a heightened focus on environmental compliance and the imperative for leak-free operations are spurring manufacturers to develop more durable and sustainable pumping solutions. While demand remains robust, potential market constraints may arise from volatile oil prices, geopolitical uncertainties, and the increasing competition from renewable energy sources, which could influence long-term growth trajectories. Leading industry players, including Flowserve Corporation, Weir Group PLC, Xylem Inc., Grundfos Holding A/S, and KSB SE & Co KGaA, are strategically investing in research and development to launch innovative products and broaden their global footprint, thereby capitalizing on the market's potential. North America and the Middle East & Africa are anticipated to maintain their positions as key markets, owing to established oil and gas infrastructure and continuous exploration initiatives.
Oil & Gas Pump Market Company Market Share
Oil & Gas Pump Market: Comprehensive Market Insights 2019-2033
This in-depth report provides an exhaustive analysis of the global Oil & Gas Pump market, encompassing its intricate dynamics, growth trajectories, and future outlook. With a comprehensive study period from 2019 to 2033, and a base year of 2025, this report leverages extensive data to deliver actionable insights for industry stakeholders. We explore parent and child market segments to offer a granular understanding of market drivers and opportunities, presenting all quantitative values in Million units.
Oil & Gas Pump Market Market Dynamics & Structure
The Oil & Gas Pump market exhibits a moderately consolidated structure, with key players like Flowserve Corporation, Weir Group PLC, and Xylem Inc. dominating market share. Technological innovation, particularly in areas like energy efficiency, predictive maintenance, and smart pumping solutions, serves as a significant driver. Regulatory frameworks, including environmental standards and safety mandates, also play a crucial role in shaping product development and market entry. The presence of competitive product substitutes, such as alternative energy sources and process optimization techniques, influences demand for traditional pumping solutions. End-user demographics are shifting towards a greater emphasis on sustainability and operational efficiency, impacting purchasing decisions. Mergers and acquisitions (M&A) activity remains a strategic tool for companies to expand their product portfolios, geographical reach, and technological capabilities. For instance, the historical period saw approximately 7 significant M&A deals contributing to market consolidation.
- Market Concentration: Moderate to high, with top 5 players holding an estimated 55% of the market share in 2025.
- Technological Innovation: Focus on IoT integration for remote monitoring, AI-driven predictive maintenance, and development of pumps for harsh environments.
- Regulatory Frameworks: Stringent environmental regulations impacting emissions and energy consumption, driving demand for more efficient pump designs.
- Competitive Product Substitutes: Rise of renewable energy integration and upstream process optimization technologies.
- End-User Demographics: Increasing demand for lifecycle cost optimization and reduced operational downtime.
- M&A Trends: Strategic acquisitions targeting specialized pump technologies and service capabilities.
Oil & Gas Pump Market Growth Trends & Insights
The global Oil & Gas Pump market is poised for robust growth, driven by increasing energy demand and ongoing exploration and production activities worldwide. The market size is projected to expand from an estimated $xx,xxx million units in 2025 to $xx,xxx million units by 2033, demonstrating a Compound Annual Growth Rate (CAGR) of approximately 5.2% during the forecast period (2025-2033). Adoption rates for advanced pumping technologies, including those with enhanced energy efficiency and digital integration, are steadily increasing as companies seek to optimize operational costs and minimize environmental impact. Technological disruptions are primarily centered around the integration of Artificial Intelligence (AI) and the Internet of Things (IoT) for predictive maintenance and real-time performance monitoring, significantly reducing unscheduled downtime. Consumer behavior shifts are evident in the growing preference for pumps that offer a lower total cost of ownership, considering energy consumption, maintenance requirements, and operational lifespan. The upstream segment, driven by exploration and extraction activities in challenging environments, is a key contributor to market growth. Midstream infrastructure development, including pipelines and storage facilities, also fuels demand for reliable pumping solutions. Downstream refining and petrochemical operations continue to represent a significant market share, with a constant need for efficient and high-performance pumps. The increasing focus on operational efficiency and the need to maintain production levels in mature fields are key factors influencing market penetration of various pump types. The report highlights that the adoption of variable frequency drives (VFDs) in conjunction with pumps is expected to see a substantial increase, contributing to energy savings and operational flexibility. Furthermore, the development of specialized pumps designed for handling corrosive or abrasive fluids is crucial for maintaining production in diverse geological formations.
Dominant Regions, Countries, or Segments in Oil & Gas Pump Market
The Upstream segment, encompassing exploration, drilling, and production, is anticipated to be the dominant force driving growth in the global Oil & Gas Pump market. This dominance is fueled by continuous investments in unconventional resource extraction, such as shale oil and gas, and the exploration of deep-sea reserves. Developing economies, particularly in the Middle East and North America, are spearheading this growth. The Middle East, with its vast proven oil reserves and ongoing expansion projects, represents a significant market for various pump types. North America, driven by its extensive shale plays and advanced technological adoption, also showcases strong demand.
- Dominant Segment (Application): Upstream
- Key Drivers: Increased global energy demand, exploration in challenging environments (deep-water, unconventional resources), ongoing development of new oil and gas fields.
- Market Share (Estimated 2025): Approximately 45% of the total market value.
- Growth Potential: High, driven by continued investment in E&P activities.
- Dominant Region: North America
- Key Drivers: Extensive shale oil and gas production, technological advancements in drilling and extraction, supportive government policies for energy production.
- Market Share (Estimated 2025): Approximately 30% of the global market.
- Growth Potential: Strong, with ongoing innovation and sustained production levels.
- Dominant Segment (Type): Dynamic Pumps
- Key Drivers: High flow rate capabilities, efficiency in large-scale fluid transfer operations, wide applicability in upstream and midstream applications.
- Market Share (Estimated 2025): Approximately 60% of the pump type market.
- Growth Potential: Steady, driven by the scale of operations in the oil and gas industry.
The dominance of the Upstream application segment is intricately linked to the infrastructure and technological capabilities present in regions like North America. The sheer volume of fluids that need to be extracted, processed, and transported in these areas necessitates high-performance and reliable pumping systems. Dynamic pumps, such as centrifugal pumps, are favored for their ability to handle large volumes of liquids efficiently, making them indispensable in upstream operations.
Oil & Gas Pump Market Product Landscape
The Oil & Gas Pump market is characterized by a diverse product landscape catering to a wide array of operational needs. Innovations are focused on enhancing efficiency, reliability, and safety. Dynamic pumps, including centrifugal and vertical turbine pumps, continue to be prevalent due to their high flow rates, essential for upstream and midstream applications. Positive displacement pumps, such as screw pumps and diaphragm pumps, are critical for precise fluid transfer and handling viscous or abrasive media in downstream processes. Key product developments include the integration of advanced materials for corrosion and wear resistance, smart sensing technologies for predictive maintenance, and modular designs for easier installation and servicing. Performance metrics are increasingly evaluated based on energy efficiency, operational lifespan, and uptime, with manufacturers offering customized solutions to meet specific project requirements.
Key Drivers, Barriers & Challenges in Oil & Gas Pump Market
Key Drivers:
- Growing Global Energy Demand: Sustained need for oil and gas fuels upstream, midstream, and downstream activities, requiring efficient pumping solutions.
- Technological Advancements: Innovations in energy-efficient designs, IoT integration for predictive maintenance, and material science for enhanced durability.
- Infrastructure Development: Expansion and maintenance of pipelines, refineries, and processing facilities drive demand for new and replacement pumps.
- Exploration in Challenging Environments: Deep-sea and unconventional resource extraction necessitate specialized, high-performance pumps.
Barriers & Challenges:
- Volatile Oil Prices: Fluctuations in crude oil prices can impact investment in new projects and consequently, pump demand.
- Stringent Environmental Regulations: Increasing focus on emissions reduction and water management necessitates compliance and can increase manufacturing costs.
- Supply Chain Disruptions: Global events can impact the availability of raw materials and components, leading to delays and increased costs.
- Competition from Alternative Energy Sources: The long-term shift towards renewables may temper growth in certain segments of the fossil fuel industry.
- Skilled Labor Shortage: A lack of trained personnel for installation, maintenance, and operation of complex pumping systems.
Emerging Opportunities in Oil & Gas Pump Market
Emerging opportunities lie in the development of highly specialized pumps for emerging unconventional resources and in enhanced oil recovery (EOR) techniques. The growing emphasis on digitalization and automation presents a significant avenue for growth, with demand for smart pumps offering remote monitoring, diagnostics, and predictive maintenance capabilities. The circular economy principles are also influencing the market, with opportunities in developing pumps that can efficiently handle recycled materials or by-products in downstream operations. Furthermore, the expansion of liquefied natural gas (LNG) infrastructure globally creates a niche market for cryogenic pumps and specialized handling systems.
Growth Accelerators in the Oil & Gas Pump Market Industry
Several factors are accelerating growth within the Oil & Gas Pump industry. The increasing adoption of digital technologies, such as AI and IoT, is enhancing operational efficiency and reducing downtime, making pumping systems more attractive. Strategic partnerships between pump manufacturers and oilfield service companies are leading to the development of integrated solutions that address specific industry challenges. Market expansion strategies, including the penetration of emerging economies and the development of pumps for niche applications like carbon capture and storage (CCS), are further fueling growth. Investment in research and development for more sustainable and energy-efficient pump technologies is also a significant growth accelerator.
Key Players Shaping the Oil & Gas Pump Market Market
- Flowserve Corporation
- Weir Group PLC
- Xylem Inc.
- Grundfos Holding A/S
- KSB SE & Co KGaA
- ITT Inc.
- Baker Hughes Co.
- Sulzer AG
- Alfa Laval AB
- Gardner Denver Holdings Inc.
Notable Milestones in Oil & Gas Pump Market Sector
- 2019: Launch of advanced AI-powered predictive maintenance solutions for centrifugal pumps by leading manufacturers.
- 2020: Significant investments in R&D for energy-efficient pump designs to meet stricter environmental regulations.
- 2021: Several key acquisitions aimed at consolidating market share and expanding technological portfolios.
- 2022: Increased demand for high-pressure pumps for deep-water exploration projects.
- 2023: Rollout of new pump models with enhanced resistance to corrosive and abrasive fluids.
- 2024: Growing integration of IoT sensors and digital twins for real-time pump performance monitoring.
In-Depth Oil & Gas Pump Market Market Outlook
The future outlook for the Oil & Gas Pump market remains positive, driven by a confluence of factors. Continued global energy demand, coupled with ongoing upstream exploration and production, will sustain the need for reliable pumping solutions. Technological breakthroughs in areas like advanced materials, smart sensing, and energy efficiency will further enhance the competitiveness of the market. Strategic partnerships and collaborations are expected to foster innovation and drive market expansion into new geographical regions and application areas. The increasing focus on operational efficiency, reduced environmental impact, and total cost of ownership will guide the development and adoption of next-generation pumping technologies, ensuring sustained growth and profitability for market players.
Oil & Gas Pump Market Segmentation
-
1. Type
- 1.1. Dynamic Pumps
- 1.2. Positive Displacement Pumps
-
2. Application
- 2.1. Upstream
- 2.2. Midstream
- 2.3. Downstream
Oil & Gas Pump Market Segmentation By Geography
- 1. North America
- 2. Europe
- 3. Asia Pacific
- 4. South America
- 5. Middle East and Africa
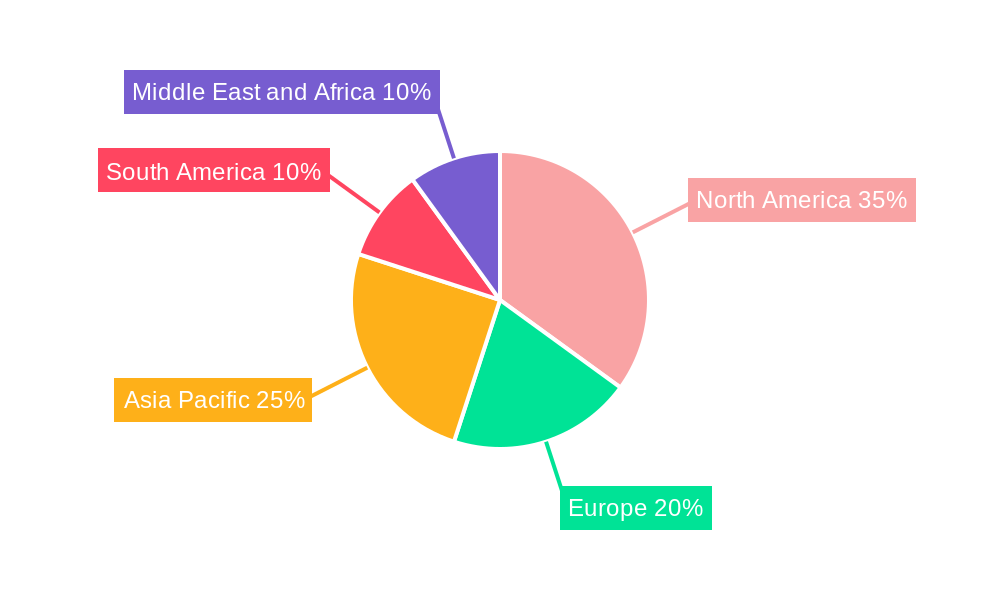
Oil & Gas Pump Market Regional Market Share
Geographic Coverage of Oil & Gas Pump Market
Oil & Gas Pump Market REPORT HIGHLIGHTS
| Aspects | Details |
|---|---|
| Study Period | 2020-2034 |
| Base Year | 2025 |
| Estimated Year | 2026 |
| Forecast Period | 2026-2034 |
| Historical Period | 2020-2025 |
| Growth Rate | CAGR of 8.8% from 2020-2034 |
| Segmentation |
|
Table of Contents
- 1. Introduction
- 1.1. Research Scope
- 1.2. Market Segmentation
- 1.3. Research Objective
- 1.4. Definitions and Assumptions
- 2. Executive Summary
- 2.1. Market Snapshot
- 3. Market Dynamics
- 3.1. Market Drivers
- 3.2. Market Restrains
- 3.3. Market Trends
- 3.4. Market Opportunities
- 4. Market Factor Analysis
- 4.1. Porters Five Forces
- 4.1.1. Bargaining Power of Suppliers
- 4.1.2. Bargaining Power of Buyers
- 4.1.3. Threat of New Entrants
- 4.1.4. Threat of Substitutes
- 4.1.5. Competitive Rivalry
- 4.2. PESTEL analysis
- 4.3. BCG Analysis
- 4.3.1. Stars (High Growth, High Market Share)
- 4.3.2. Cash Cows (Low Growth, High Market Share)
- 4.3.3. Question Mark (High Growth, Low Market Share)
- 4.3.4. Dogs (Low Growth, Low Market Share)
- 4.4. Ansoff Matrix Analysis
- 4.5. Supply Chain Analysis
- 4.6. Regulatory Landscape
- 4.7. Current Market Potential and Opportunity Assessment (TAM–SAM–SOM Framework)
- 4.8. VDR Analyst Note
- 4.1. Porters Five Forces
- 5. Market Analysis, Insights and Forecast 2021-2033
- 5.1. Market Analysis, Insights and Forecast - by Type
- 5.1.1. Dynamic Pumps
- 5.1.2. Positive Displacement Pumps
- 5.2. Market Analysis, Insights and Forecast - by Application
- 5.2.1. Upstream
- 5.2.2. Midstream
- 5.2.3. Downstream
- 5.3. Market Analysis, Insights and Forecast - by Region
- 5.3.1. North America
- 5.3.2. Europe
- 5.3.3. Asia Pacific
- 5.3.4. South America
- 5.3.5. Middle East and Africa
- 5.1. Market Analysis, Insights and Forecast - by Type
- 6. Global Oil & Gas Pump Market Analysis, Insights and Forecast, 2021-2033
- 6.1. Market Analysis, Insights and Forecast - by Type
- 6.1.1. Dynamic Pumps
- 6.1.2. Positive Displacement Pumps
- 6.2. Market Analysis, Insights and Forecast - by Application
- 6.2.1. Upstream
- 6.2.2. Midstream
- 6.2.3. Downstream
- 6.1. Market Analysis, Insights and Forecast - by Type
- 7. North America Oil & Gas Pump Market Analysis, Insights and Forecast, 2021-2033
- 7.1. Market Analysis, Insights and Forecast - by Type
- 7.1.1. Dynamic Pumps
- 7.1.2. Positive Displacement Pumps
- 7.2. Market Analysis, Insights and Forecast - by Application
- 7.2.1. Upstream
- 7.2.2. Midstream
- 7.2.3. Downstream
- 7.1. Market Analysis, Insights and Forecast - by Type
- 8. Europe Oil & Gas Pump Market Analysis, Insights and Forecast, 2021-2033
- 8.1. Market Analysis, Insights and Forecast - by Type
- 8.1.1. Dynamic Pumps
- 8.1.2. Positive Displacement Pumps
- 8.2. Market Analysis, Insights and Forecast - by Application
- 8.2.1. Upstream
- 8.2.2. Midstream
- 8.2.3. Downstream
- 8.1. Market Analysis, Insights and Forecast - by Type
- 9. Asia Pacific Oil & Gas Pump Market Analysis, Insights and Forecast, 2021-2033
- 9.1. Market Analysis, Insights and Forecast - by Type
- 9.1.1. Dynamic Pumps
- 9.1.2. Positive Displacement Pumps
- 9.2. Market Analysis, Insights and Forecast - by Application
- 9.2.1. Upstream
- 9.2.2. Midstream
- 9.2.3. Downstream
- 9.1. Market Analysis, Insights and Forecast - by Type
- 10. South America Oil & Gas Pump Market Analysis, Insights and Forecast, 2021-2033
- 10.1. Market Analysis, Insights and Forecast - by Type
- 10.1.1. Dynamic Pumps
- 10.1.2. Positive Displacement Pumps
- 10.2. Market Analysis, Insights and Forecast - by Application
- 10.2.1. Upstream
- 10.2.2. Midstream
- 10.2.3. Downstream
- 10.1. Market Analysis, Insights and Forecast - by Type
- 11. Middle East and Africa Oil & Gas Pump Market Analysis, Insights and Forecast, 2021-2033
- 11.1. Market Analysis, Insights and Forecast - by Type
- 11.1.1. Dynamic Pumps
- 11.1.2. Positive Displacement Pumps
- 11.2. Market Analysis, Insights and Forecast - by Application
- 11.2.1. Upstream
- 11.2.2. Midstream
- 11.2.3. Downstream
- 11.1. Market Analysis, Insights and Forecast - by Type
- 12. Competitive Analysis
- 12.1. Company Profiles
- 12.1.1 Flowserve Corporation
- 12.1.1.1. Company Overview
- 12.1.1.2. Products
- 12.1.1.3. Company Financials
- 12.1.1.4. SWOT Analysis
- 12.1.2 Weir Group PLC
- 12.1.2.1. Company Overview
- 12.1.2.2. Products
- 12.1.2.3. Company Financials
- 12.1.2.4. SWOT Analysis
- 12.1.3 Xylem Inc
- 12.1.3.1. Company Overview
- 12.1.3.2. Products
- 12.1.3.3. Company Financials
- 12.1.3.4. SWOT Analysis
- 12.1.4 Grundfos Holding A/S
- 12.1.4.1. Company Overview
- 12.1.4.2. Products
- 12.1.4.3. Company Financials
- 12.1.4.4. SWOT Analysis
- 12.1.5 KSB SE & Co KGaA
- 12.1.5.1. Company Overview
- 12.1.5.2. Products
- 12.1.5.3. Company Financials
- 12.1.5.4. SWOT Analysis
- 12.1.6 ITT Inc
- 12.1.6.1. Company Overview
- 12.1.6.2. Products
- 12.1.6.3. Company Financials
- 12.1.6.4. SWOT Analysis
- 12.1.7 Baker Hughes Co
- 12.1.7.1. Company Overview
- 12.1.7.2. Products
- 12.1.7.3. Company Financials
- 12.1.7.4. SWOT Analysis
- 12.1.8 Sulzer AG
- 12.1.8.1. Company Overview
- 12.1.8.2. Products
- 12.1.8.3. Company Financials
- 12.1.8.4. SWOT Analysis
- 12.1.9 Alfa Laval AB
- 12.1.9.1. Company Overview
- 12.1.9.2. Products
- 12.1.9.3. Company Financials
- 12.1.9.4. SWOT Analysis
- 12.1.10 Gardner Denver Holdings Inc
- 12.1.10.1. Company Overview
- 12.1.10.2. Products
- 12.1.10.3. Company Financials
- 12.1.10.4. SWOT Analysis
- 12.1.1 Flowserve Corporation
- 12.2. Market Entropy
- 12.2.1 Company's Key Areas Served
- 12.2.2 Recent Developments
- 12.3. Company Market Share Analysis 2025
- 12.3.1 Top 5 Companies Market Share Analysis
- 12.3.2 Top 3 Companies Market Share Analysis
- 12.4. List of Potential Customers
- 13. Research Methodology
List of Figures
- Figure 1: Global Oil & Gas Pump Market Revenue Breakdown (billion, %) by Region 2025 & 2033
- Figure 2: Global Oil & Gas Pump Market Volume Breakdown (K Units, %) by Region 2025 & 2033
- Figure 3: North America Oil & Gas Pump Market Revenue (billion), by Type 2025 & 2033
- Figure 4: North America Oil & Gas Pump Market Volume (K Units), by Type 2025 & 2033
- Figure 5: North America Oil & Gas Pump Market Revenue Share (%), by Type 2025 & 2033
- Figure 6: North America Oil & Gas Pump Market Volume Share (%), by Type 2025 & 2033
- Figure 7: North America Oil & Gas Pump Market Revenue (billion), by Application 2025 & 2033
- Figure 8: North America Oil & Gas Pump Market Volume (K Units), by Application 2025 & 2033
- Figure 9: North America Oil & Gas Pump Market Revenue Share (%), by Application 2025 & 2033
- Figure 10: North America Oil & Gas Pump Market Volume Share (%), by Application 2025 & 2033
- Figure 11: North America Oil & Gas Pump Market Revenue (billion), by Country 2025 & 2033
- Figure 12: North America Oil & Gas Pump Market Volume (K Units), by Country 2025 & 2033
- Figure 13: North America Oil & Gas Pump Market Revenue Share (%), by Country 2025 & 2033
- Figure 14: North America Oil & Gas Pump Market Volume Share (%), by Country 2025 & 2033
- Figure 15: Europe Oil & Gas Pump Market Revenue (billion), by Type 2025 & 2033
- Figure 16: Europe Oil & Gas Pump Market Volume (K Units), by Type 2025 & 2033
- Figure 17: Europe Oil & Gas Pump Market Revenue Share (%), by Type 2025 & 2033
- Figure 18: Europe Oil & Gas Pump Market Volume Share (%), by Type 2025 & 2033
- Figure 19: Europe Oil & Gas Pump Market Revenue (billion), by Application 2025 & 2033
- Figure 20: Europe Oil & Gas Pump Market Volume (K Units), by Application 2025 & 2033
- Figure 21: Europe Oil & Gas Pump Market Revenue Share (%), by Application 2025 & 2033
- Figure 22: Europe Oil & Gas Pump Market Volume Share (%), by Application 2025 & 2033
- Figure 23: Europe Oil & Gas Pump Market Revenue (billion), by Country 2025 & 2033
- Figure 24: Europe Oil & Gas Pump Market Volume (K Units), by Country 2025 & 2033
- Figure 25: Europe Oil & Gas Pump Market Revenue Share (%), by Country 2025 & 2033
- Figure 26: Europe Oil & Gas Pump Market Volume Share (%), by Country 2025 & 2033
- Figure 27: Asia Pacific Oil & Gas Pump Market Revenue (billion), by Type 2025 & 2033
- Figure 28: Asia Pacific Oil & Gas Pump Market Volume (K Units), by Type 2025 & 2033
- Figure 29: Asia Pacific Oil & Gas Pump Market Revenue Share (%), by Type 2025 & 2033
- Figure 30: Asia Pacific Oil & Gas Pump Market Volume Share (%), by Type 2025 & 2033
- Figure 31: Asia Pacific Oil & Gas Pump Market Revenue (billion), by Application 2025 & 2033
- Figure 32: Asia Pacific Oil & Gas Pump Market Volume (K Units), by Application 2025 & 2033
- Figure 33: Asia Pacific Oil & Gas Pump Market Revenue Share (%), by Application 2025 & 2033
- Figure 34: Asia Pacific Oil & Gas Pump Market Volume Share (%), by Application 2025 & 2033
- Figure 35: Asia Pacific Oil & Gas Pump Market Revenue (billion), by Country 2025 & 2033
- Figure 36: Asia Pacific Oil & Gas Pump Market Volume (K Units), by Country 2025 & 2033
- Figure 37: Asia Pacific Oil & Gas Pump Market Revenue Share (%), by Country 2025 & 2033
- Figure 38: Asia Pacific Oil & Gas Pump Market Volume Share (%), by Country 2025 & 2033
- Figure 39: South America Oil & Gas Pump Market Revenue (billion), by Type 2025 & 2033
- Figure 40: South America Oil & Gas Pump Market Volume (K Units), by Type 2025 & 2033
- Figure 41: South America Oil & Gas Pump Market Revenue Share (%), by Type 2025 & 2033
- Figure 42: South America Oil & Gas Pump Market Volume Share (%), by Type 2025 & 2033
- Figure 43: South America Oil & Gas Pump Market Revenue (billion), by Application 2025 & 2033
- Figure 44: South America Oil & Gas Pump Market Volume (K Units), by Application 2025 & 2033
- Figure 45: South America Oil & Gas Pump Market Revenue Share (%), by Application 2025 & 2033
- Figure 46: South America Oil & Gas Pump Market Volume Share (%), by Application 2025 & 2033
- Figure 47: South America Oil & Gas Pump Market Revenue (billion), by Country 2025 & 2033
- Figure 48: South America Oil & Gas Pump Market Volume (K Units), by Country 2025 & 2033
- Figure 49: South America Oil & Gas Pump Market Revenue Share (%), by Country 2025 & 2033
- Figure 50: South America Oil & Gas Pump Market Volume Share (%), by Country 2025 & 2033
- Figure 51: Middle East and Africa Oil & Gas Pump Market Revenue (billion), by Type 2025 & 2033
- Figure 52: Middle East and Africa Oil & Gas Pump Market Volume (K Units), by Type 2025 & 2033
- Figure 53: Middle East and Africa Oil & Gas Pump Market Revenue Share (%), by Type 2025 & 2033
- Figure 54: Middle East and Africa Oil & Gas Pump Market Volume Share (%), by Type 2025 & 2033
- Figure 55: Middle East and Africa Oil & Gas Pump Market Revenue (billion), by Application 2025 & 2033
- Figure 56: Middle East and Africa Oil & Gas Pump Market Volume (K Units), by Application 2025 & 2033
- Figure 57: Middle East and Africa Oil & Gas Pump Market Revenue Share (%), by Application 2025 & 2033
- Figure 58: Middle East and Africa Oil & Gas Pump Market Volume Share (%), by Application 2025 & 2033
- Figure 59: Middle East and Africa Oil & Gas Pump Market Revenue (billion), by Country 2025 & 2033
- Figure 60: Middle East and Africa Oil & Gas Pump Market Volume (K Units), by Country 2025 & 2033
- Figure 61: Middle East and Africa Oil & Gas Pump Market Revenue Share (%), by Country 2025 & 2033
- Figure 62: Middle East and Africa Oil & Gas Pump Market Volume Share (%), by Country 2025 & 2033
List of Tables
- Table 1: Global Oil & Gas Pump Market Revenue billion Forecast, by Type 2020 & 2033
- Table 2: Global Oil & Gas Pump Market Volume K Units Forecast, by Type 2020 & 2033
- Table 3: Global Oil & Gas Pump Market Revenue billion Forecast, by Application 2020 & 2033
- Table 4: Global Oil & Gas Pump Market Volume K Units Forecast, by Application 2020 & 2033
- Table 5: Global Oil & Gas Pump Market Revenue billion Forecast, by Region 2020 & 2033
- Table 6: Global Oil & Gas Pump Market Volume K Units Forecast, by Region 2020 & 2033
- Table 7: Global Oil & Gas Pump Market Revenue billion Forecast, by Type 2020 & 2033
- Table 8: Global Oil & Gas Pump Market Volume K Units Forecast, by Type 2020 & 2033
- Table 9: Global Oil & Gas Pump Market Revenue billion Forecast, by Application 2020 & 2033
- Table 10: Global Oil & Gas Pump Market Volume K Units Forecast, by Application 2020 & 2033
- Table 11: Global Oil & Gas Pump Market Revenue billion Forecast, by Country 2020 & 2033
- Table 12: Global Oil & Gas Pump Market Volume K Units Forecast, by Country 2020 & 2033
- Table 13: Global Oil & Gas Pump Market Revenue billion Forecast, by Type 2020 & 2033
- Table 14: Global Oil & Gas Pump Market Volume K Units Forecast, by Type 2020 & 2033
- Table 15: Global Oil & Gas Pump Market Revenue billion Forecast, by Application 2020 & 2033
- Table 16: Global Oil & Gas Pump Market Volume K Units Forecast, by Application 2020 & 2033
- Table 17: Global Oil & Gas Pump Market Revenue billion Forecast, by Country 2020 & 2033
- Table 18: Global Oil & Gas Pump Market Volume K Units Forecast, by Country 2020 & 2033
- Table 19: Global Oil & Gas Pump Market Revenue billion Forecast, by Type 2020 & 2033
- Table 20: Global Oil & Gas Pump Market Volume K Units Forecast, by Type 2020 & 2033
- Table 21: Global Oil & Gas Pump Market Revenue billion Forecast, by Application 2020 & 2033
- Table 22: Global Oil & Gas Pump Market Volume K Units Forecast, by Application 2020 & 2033
- Table 23: Global Oil & Gas Pump Market Revenue billion Forecast, by Country 2020 & 2033
- Table 24: Global Oil & Gas Pump Market Volume K Units Forecast, by Country 2020 & 2033
- Table 25: Global Oil & Gas Pump Market Revenue billion Forecast, by Type 2020 & 2033
- Table 26: Global Oil & Gas Pump Market Volume K Units Forecast, by Type 2020 & 2033
- Table 27: Global Oil & Gas Pump Market Revenue billion Forecast, by Application 2020 & 2033
- Table 28: Global Oil & Gas Pump Market Volume K Units Forecast, by Application 2020 & 2033
- Table 29: Global Oil & Gas Pump Market Revenue billion Forecast, by Country 2020 & 2033
- Table 30: Global Oil & Gas Pump Market Volume K Units Forecast, by Country 2020 & 2033
- Table 31: Global Oil & Gas Pump Market Revenue billion Forecast, by Type 2020 & 2033
- Table 32: Global Oil & Gas Pump Market Volume K Units Forecast, by Type 2020 & 2033
- Table 33: Global Oil & Gas Pump Market Revenue billion Forecast, by Application 2020 & 2033
- Table 34: Global Oil & Gas Pump Market Volume K Units Forecast, by Application 2020 & 2033
- Table 35: Global Oil & Gas Pump Market Revenue billion Forecast, by Country 2020 & 2033
- Table 36: Global Oil & Gas Pump Market Volume K Units Forecast, by Country 2020 & 2033
Frequently Asked Questions
1. What is the projected Compound Annual Growth Rate (CAGR) of the Oil & Gas Pump Market?
The projected CAGR is approximately 8.8%.
2. Which companies are prominent players in the Oil & Gas Pump Market?
Key companies in the market include Flowserve Corporation, Weir Group PLC, Xylem Inc, Grundfos Holding A/S, KSB SE & Co KGaA, ITT Inc, Baker Hughes Co, Sulzer AG, Alfa Laval AB, Gardner Denver Holdings Inc.
3. What are the main segments of the Oil & Gas Pump Market?
The market segments include Type, Application.
4. Can you provide details about the market size?
The market size is estimated to be USD 14.27 billion as of 2022.
5. What are some drivers contributing to market growth?
4.; Increasing Investments in Offshore Wind Power Projects4.; Supportive Government Policies.
6. What are the notable trends driving market growth?
Increasing Demand for Dynamic Pumps (Centrifugal pumps) from Refineries.
7. Are there any restraints impacting market growth?
4.; Increasing Adopting of Alternative Clean Energy Sources (Ex: Solar. Hydro).
8. Can you provide examples of recent developments in the market?
N/A
9. What pricing options are available for accessing the report?
Pricing options include single-user, multi-user, and enterprise licenses priced at USD 4750, USD 5250, and USD 8750 respectively.
10. Is the market size provided in terms of value or volume?
The market size is provided in terms of value, measured in billion and volume, measured in K Units.
11. Are there any specific market keywords associated with the report?
Yes, the market keyword associated with the report is "Oil & Gas Pump Market," which aids in identifying and referencing the specific market segment covered.
12. How do I determine which pricing option suits my needs best?
The pricing options vary based on user requirements and access needs. Individual users may opt for single-user licenses, while businesses requiring broader access may choose multi-user or enterprise licenses for cost-effective access to the report.
13. Are there any additional resources or data provided in the Oil & Gas Pump Market report?
While the report offers comprehensive insights, it's advisable to review the specific contents or supplementary materials provided to ascertain if additional resources or data are available.
14. How can I stay updated on further developments or reports in the Oil & Gas Pump Market?
To stay informed about further developments, trends, and reports in the Oil & Gas Pump Market, consider subscribing to industry newsletters, following relevant companies and organizations, or regularly checking reputable industry news sources and publications.
Methodology
Step 1 - Identification of Relevant Samples Size from Population Database


Step 2 - Approaches for Defining Global Market Size (Value, Volume* & Price*)

Note*: In applicable scenarios
Step 3 - Data Sources
Primary Research
- Web Analytics
- Survey Reports
- Research Institute
- Latest Research Reports
- Opinion Leaders
Secondary Research
- Annual Reports
- White Paper
- Latest Press Release
- Industry Association
- Paid Database
- Investor Presentations

Step 4 - Data Triangulation
Involves using different sources of information in order to increase the validity of a study
These sources are likely to be stakeholders in a program - participants, other researchers, program staff, other community members, and so on.
Then we put all data in single framework & apply various statistical tools to find out the dynamic on the market.
During the analysis stage, feedback from the stakeholder groups would be compared to determine areas of agreement as well as areas of divergence