

Key Insights
The global Oil and Gas Nuclear Magnetic Resonance (NMR) market is projected for significant expansion, forecasted to exceed $4.8 billion by 2033, with a Compound Annual Growth Rate (CAGR) of 4.8%. This growth is fueled by the escalating demand for advanced reservoir characterization solutions that deliver precise insights into rock and fluid properties. The adoption of NMR logging is indispensable for optimizing oil and gas exploration and production, enabling operators to identify bypassed pay zones, enhance hydrocarbon reserve estimations, and mitigate drilling risks. Key growth catalysts include the continuous pursuit of enhanced oil recovery (EOR) techniques, the imperative for efficient resource management in mature fields, and the development of sophisticated NMR technologies offering higher resolution and faster data acquisition. Furthermore, the increasing focus on unconventional resource exploration, such as shale gas and tight oil, necessitates advanced analytical tools for complex pore structures, acting as a significant market expansion driver. The synergistic integration of NMR data with other formation evaluation techniques further amplifies its value proposition.
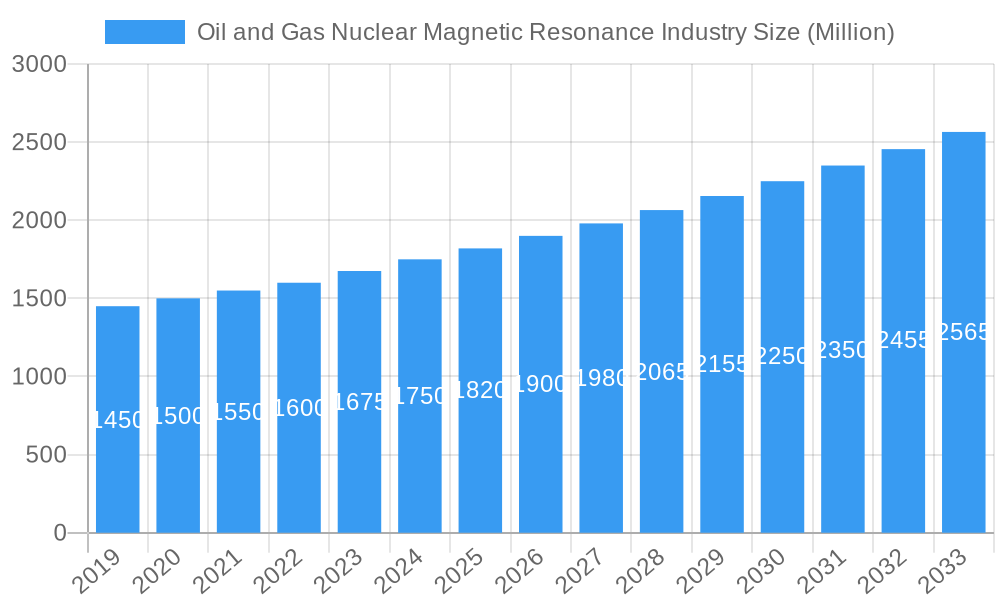
Oil and Gas Nuclear Magnetic Resonance Industry Market Size (In Billion)
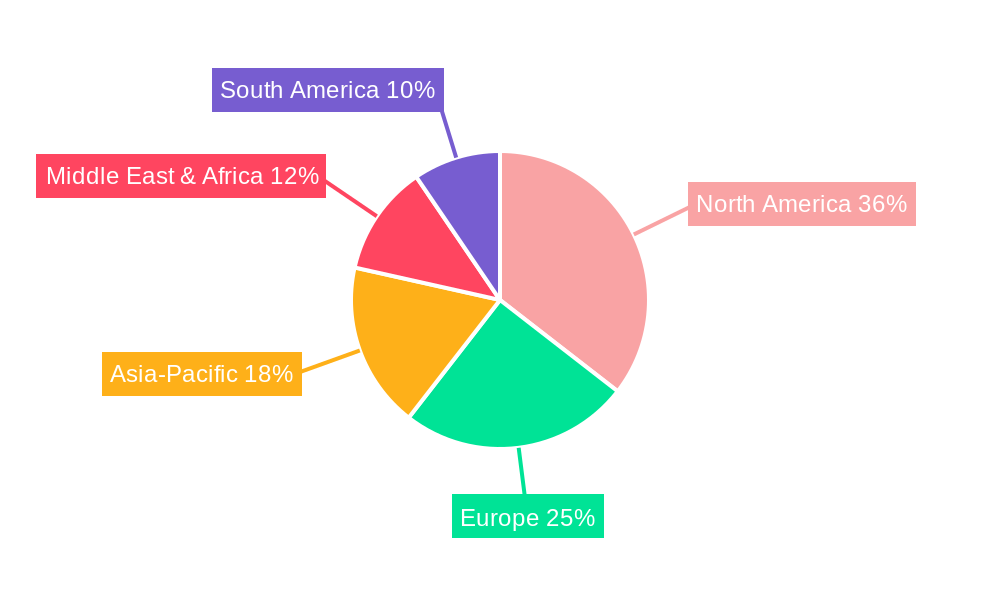
The market is segmented by deployment type, with "Onshore" applications currently leading due to accessibility and cost-effectiveness. However, "Offshore" segments are poised for substantial growth, driven by the industry's expansion into deeper and more complex marine environments. Geographically, North America leads, propelled by extensive oil and gas activities, followed by Europe and the Asia-Pacific region, which exhibits considerable growth potential due to rising energy demands and ongoing exploration. Emerging economies in the Middle East, Africa, and South America are also expected to contribute to market expansion as they advance their oil and gas infrastructure and adopt cutting-edge technologies. Key industry players are at the forefront of innovation, continuously developing advanced NMR tools and services to meet evolving industry needs. While high initial equipment costs and the need for skilled personnel present challenges, technological advancements and service-based models are actively addressing these restraints.
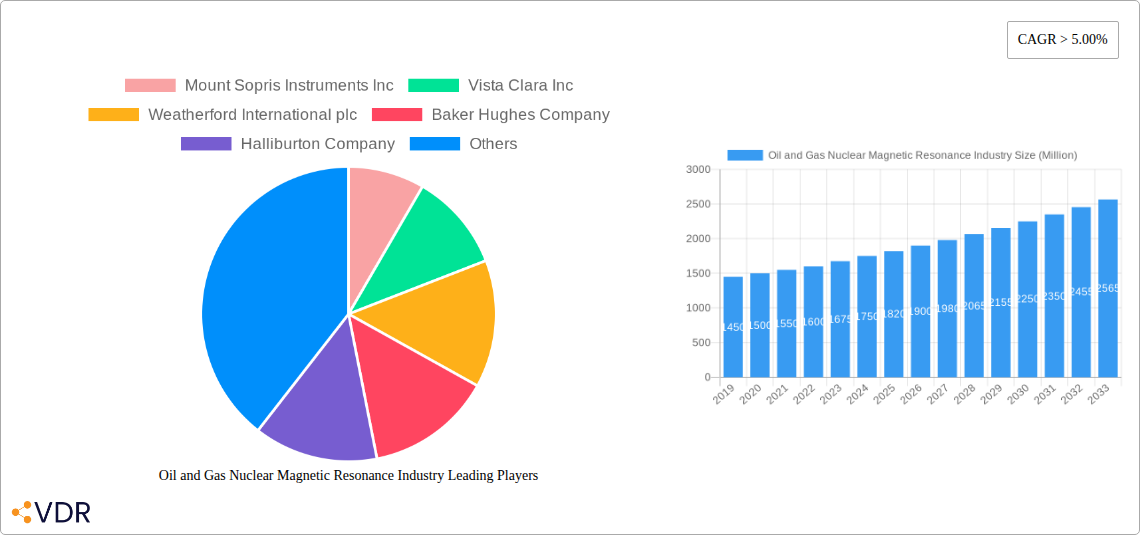
Oil and Gas Nuclear Magnetic Resonance Industry Company Market Share
Global Oil and Gas Nuclear Magnetic Resonance (NMR) Market Analysis & Forecast: 2019-2033
This comprehensive report offers an in-depth analysis of the global Oil and Gas Nuclear Magnetic Resonance (NMR) market, detailing market dynamics, growth trajectories, regional trends, product innovations, key drivers, challenges, and emerging opportunities. Employing a robust methodology and extensive primary and secondary research, this report is an essential resource for stakeholders seeking to understand and capitalize on the evolving NMR landscape within the upstream oil and gas sector. The study encompasses the period from 2019 to 2033, with a base year of 2024, a forecast period of 2025–2033, and historical data from 2019–2024. The market size is valued at approximately $4.8 billion.
Oil and Gas Nuclear Magnetic Resonance Industry Market Dynamics & Structure
The Oil and Gas Nuclear Magnetic Resonance (NMR) market is characterized by a moderately concentrated landscape, with leading players investing heavily in technological advancements to enhance reservoir characterization and production optimization. Innovation drivers are primarily focused on developing more sensitive, portable, and cost-effective NMR solutions for both downhole and surface applications. Regulatory frameworks, while generally supportive of technological adoption for increased efficiency and safety, can introduce compliance complexities for new entrants. Competitive product substitutes, though present in broader reservoir evaluation techniques, often lack the detailed pore-scale information provided by NMR. End-user demographics span national oil companies, independent exploration and production firms, and specialized service providers. Mergers and acquisitions (M&A) trends are observed as companies seek to consolidate expertise, expand service portfolios, and gain market share. For instance, the acquisition of specialized NMR technology providers by larger oilfield service companies aims to integrate advanced analytical capabilities into comprehensive upstream solutions. The market share for key technologies is dynamic, with continuous innovation aiming to improve accuracy in hydrocarbon saturation, pore size distribution, and fluid mobility estimation. Barriers to innovation include the high cost of R&D, the need for rigorous field validation, and the complex geological and operational environments encountered in oil and gas exploration and production. The market is projected to see significant growth driven by the demand for enhanced oil recovery (EOR) techniques and the exploration of unconventional reserves. The estimated market value for the global Oil and Gas NMR market is expected to reach $1,500 Million by the base year 2025, with further growth anticipated.
Oil and Gas Nuclear Magnetic Resonance Industry Growth Trends & Insights
The global Oil and Gas Nuclear Magnetic Resonance (NMR) market is on a significant upward trajectory, fueled by an insatiable demand for precise subsurface data to optimize hydrocarbon extraction and exploration efforts. The market size evolution has been consistent, with a projected Compound Annual Growth Rate (CAGR) of approximately 7.5% from 2025 to 2033. Adoption rates of NMR technology are steadily increasing as operators recognize its unparalleled ability to provide detailed insights into pore size distribution, permeability, fluid saturation, and wettability, crucial parameters for reservoir management and production forecasting. Technological disruptions, such as advancements in portable NMR devices and integrated downhole logging tools, are democratizing access to high-resolution reservoir data, making it available in real-time for informed decision-making. This shift from traditional, less granular methods to sophisticated NMR analysis is transforming the way oil and gas companies approach reservoir characterization, particularly in complex formations like shales and tight sands. Consumer behavior has shifted towards demanding solutions that offer not only data acquisition but also actionable interpretations, leading service providers to invest in advanced analytics and artificial intelligence (AI) integration with NMR data. Market penetration is deepening, especially in regions with mature fields requiring enhanced recovery strategies and in basins with extensive unconventional resource potential. The increasing focus on maximizing recovery from existing assets and reducing exploration risk for new ventures directly correlates with the growing reliance on NMR's unique analytical capabilities. Furthermore, the drive for greater operational efficiency and reduced environmental impact through optimized drilling and production practices further amplifies the adoption of NMR technologies. The estimated market size in 2025 is $1,500 Million, with projections indicating a significant expansion by 2033.
Dominant Regions, Countries, or Segments in Oil and Gas Nuclear Magnetic Resonance Industry
North America currently stands as the dominant region in the Oil and Gas Nuclear Magnetic Resonance (NMR) market, driven by its extensive unconventional oil and gas resources, particularly in the United States and Canada. The region's mature upstream sector demands sophisticated technologies for enhanced oil recovery (EOR) and efficient extraction from complex geological formations like shale plays. Key drivers in North America include robust investments in exploration and production, a highly competitive service sector, and a strong emphasis on technological innovation to maximize output from existing reserves. The extensive infrastructure for both onshore and offshore exploration further bolsters the demand for NMR solutions. Countries like the United States lead due to the sheer volume of oil and gas activity and the early adoption of advanced subsurface evaluation techniques. The market share within North America is significant, estimated to be around 35% of the global market by 2025.
- Key Drivers in North America:
- Abundant unconventional reserves (shale oil and gas).
- High EOR activity in mature fields.
- Strong presence of major oilfield service companies.
- Significant R&D investments in subsurface technologies.
- Favorable regulatory environment for hydrocarbon production.
The Asia-Pacific region is emerging as a significant growth driver, propelled by expanding exploration activities in countries like China, India, and Southeast Asian nations. Increased investments in offshore projects and the development of new frontiers are creating substantial demand for advanced reservoir characterization tools. Economic policies supporting energy security and the continuous need to meet rising energy demands are instrumental in this growth. The market share for Asia-Pacific is projected to grow from approximately 20% in 2025 to over 25% by 2033.
- Key Drivers in Asia-Pacific:
- Increasing exploration and production activities.
- Growing demand for energy to fuel economic growth.
- Development of large offshore gas fields.
- Government initiatives to boost domestic oil and gas production.
The Middle East and Africa region, with its vast conventional reserves and ongoing upstream capacity expansion projects, also presents a substantial market for NMR technologies. The focus on optimizing production from existing fields and exploring new reserves, particularly in deepwater and ultra-deepwater environments, makes NMR indispensable. Saudi Aramco's ambitious expansion plans and significant contract awards underscore the region's commitment to upstream development. The market share for this region is estimated at around 20% in 2025.
- Key Drivers in Middle East and Africa:
- Major upstream capacity expansion projects.
- Vast conventional oil and gas reserves.
- Focus on optimizing production and maximizing recovery.
- Increasing investment in offshore and deepwater exploration.
Europe's market, while more mature, continues to drive demand, particularly in the North Sea for mature field management and EOR techniques. South America, with its emerging deepwater plays and unconventional potential, represents a growing segment for NMR adoption. The segment of "Onshore" deployment holds a larger market share globally, accounting for roughly 60% of the total market in 2025, due to the widespread nature of onshore exploration and production activities. However, the "Offshore" segment is witnessing rapid growth, driven by the increasing complexity and value of deepwater discoveries.
Oil and Gas Nuclear Magnetic Resonance Industry Product Landscape
The product landscape of the Oil and Gas Nuclear Magnetic Resonance (NMR) industry is marked by continuous innovation aimed at delivering more precise, efficient, and versatile solutions for reservoir characterization. Key product innovations include advanced NMR logging tools designed for downhole applications, offering real-time analysis of pore structure, fluid types, and saturation levels, critical for formation evaluation and production optimization. Portable NMR spectrometers are also gaining traction for surface-based core analysis, providing rapid and accurate assessment of core samples. Performance metrics for these products are continuously improving, with enhanced sensitivity, higher resolution, and expanded operational temperature and pressure ranges. Unique selling propositions revolve around the ability of NMR to provide direct measurements of fluid properties and pore network characteristics, differentiating it from indirect logging methods. Technological advancements are also focusing on miniaturization, improved data acquisition speed, and the integration of advanced processing algorithms to extract deeper insights from NMR data, crucial for understanding complex reservoir behaviors and optimizing hydrocarbon recovery.
Key Drivers, Barriers & Challenges in Oil and Gas Nuclear Magnetic Resonance Industry
The Oil and Gas NMR market is propelled by several key drivers. The ever-increasing demand for energy necessitates optimized hydrocarbon recovery from existing and new reserves, where NMR's detailed reservoir insights are invaluable. Technological advancements in NMR hardware and software are making the technology more accessible and powerful. Furthermore, the growing complexity of geological formations, including unconventional reservoirs, demands advanced characterization techniques that NMR uniquely provides. The push for enhanced oil recovery (EOR) strategies and the need to reduce exploration risks also significantly contribute to market growth.
However, the market faces several barriers and challenges. The high capital expenditure associated with acquiring and deploying NMR equipment can be a deterrent, especially for smaller operators. The need for skilled personnel to operate and interpret NMR data presents a talent gap challenge. Stringent regulatory requirements for data acquisition and reporting in certain regions can also slow down adoption. Supply chain disruptions, though less pronounced currently, could impact the availability of specialized components. Competitive pressures from other reservoir evaluation techniques, while not providing the same level of detail, can influence purchasing decisions based on perceived cost-effectiveness.
Emerging Opportunities in Oil and Gas Nuclear Magnetic Resonance Industry
Emerging opportunities in the Oil and Gas NMR market are abundant, driven by evolving industry needs and technological frontiers. The increasing exploration in ultra-deepwater and frontier basins presents a significant untapped market for high-resolution subsurface characterization. Innovations in artificial intelligence (AI) and machine learning (ML) for rapid NMR data interpretation and predictive modeling offer enhanced decision-making capabilities. The growing focus on carbon capture, utilization, and storage (CCUS) projects may also open new avenues for NMR application in characterizing subsurface geological formations for CO2 sequestration. Furthermore, the development of lower-cost, more portable NMR devices could expand their application in mature fields for detailed wellbore integrity assessments and smaller independent operator markets.
Growth Accelerators in the Oil and Gas Nuclear Magnetic Resonance Industry Industry
Several factors act as growth accelerators for the Oil and Gas NMR industry. Technological breakthroughs, such as the development of new pulse sequences and signal processing techniques, are continuously enhancing the resolution and depth of NMR analysis. Strategic partnerships between NMR technology providers and major oilfield service companies are crucial for expanding market reach and integrating NMR capabilities into comprehensive E&P workflows. Market expansion strategies, including focusing on emerging oil and gas markets and developing application-specific NMR solutions, are also driving growth. The increasing adoption of digital oilfield technologies and the demand for real-time data integration further accelerate the use of advanced analytical tools like NMR.
Key Players Shaping the Oil and Gas Nuclear Magnetic Resonance Industry Market
- Mount Sopris Instruments Inc
- Vista Clara Inc
- Weatherford International plc
- Baker Hughes Company
- Halliburton Company
- Qteq Pty Ltd
- Schlumberger Limited
Notable Milestones in Oil and Gas Nuclear Magnetic Resonance Industry Sector
- February 2023: Saudi Aramco expects to award contracts for some 90 projects by 2025 as it presses ahead with major upstream oil and gas capacity expansions. This indicates substantial investment in upstream activities, potentially increasing the demand for NMR technologies for reservoir characterization and production optimization.
- April 2022: Saipem announced that the company won a contract from Eni for a drilling campaign to be conducted in the Middle East and West Africa using the former's ultra-deep-water drillship Saipem 12000. This highlights significant activity in deepwater exploration, a domain where precise reservoir analysis using NMR is crucial for success.
In-Depth Oil and Gas Nuclear Magnetic Resonance Industry Market Outlook
The future outlook for the Oil and Gas Nuclear Magnetic Resonance (NMR) market is exceptionally strong, driven by the escalating need for precise and efficient subsurface characterization in an increasingly complex global energy landscape. Growth accelerators, including continuous technological innovation in sensor technology and data analytics, alongside strategic collaborations between industry leaders, will further fortify market expansion. The integration of NMR with AI and machine learning presents a significant opportunity for predictive reservoir modeling and optimized production strategies, offering unparalleled value to operators. As the industry navigates the energy transition, the demand for maximizing recovery from existing assets and exploring new, challenging frontiers will ensure the sustained relevance and growth of NMR technologies. The market is poised for substantial expansion, reflecting its critical role in enabling cost-effective and sustainable hydrocarbon exploration and production.
Oil and Gas Nuclear Magnetic Resonance Industry Segmentation
-
1. Location of Deployment
- 1.1. Offshore
- 1.2. Onshore
-
2. Geogrpahy
- 2.1. North America
- 2.2. Europe
- 2.3. Asia-Pacific
- 2.4. Middle-East and Africa
- 2.5. South America
Oil and Gas Nuclear Magnetic Resonance Industry Segmentation By Geography
-
1. North America
- 1.1. United States
- 1.2. Canada
- 1.3. Mexico
-
2. South America
- 2.1. Brazil
- 2.2. Argentina
- 2.3. Rest of South America
-
3. Europe
- 3.1. United Kingdom
- 3.2. Germany
- 3.3. France
- 3.4. Italy
- 3.5. Spain
- 3.6. Russia
- 3.7. Benelux
- 3.8. Nordics
- 3.9. Rest of Europe
-
4. Middle East & Africa
- 4.1. Turkey
- 4.2. Israel
- 4.3. GCC
- 4.4. North Africa
- 4.5. South Africa
- 4.6. Rest of Middle East & Africa
-
5. Asia Pacific
- 5.1. China
- 5.2. India
- 5.3. Japan
- 5.4. South Korea
- 5.5. ASEAN
- 5.6. Oceania
- 5.7. Rest of Asia Pacific
Oil and Gas Nuclear Magnetic Resonance Industry Regional Market Share
Geographic Coverage of Oil and Gas Nuclear Magnetic Resonance Industry
Oil and Gas Nuclear Magnetic Resonance Industry REPORT HIGHLIGHTS
| Aspects | Details |
|---|---|
| Study Period | 2020-2034 |
| Base Year | 2025 |
| Estimated Year | 2026 |
| Forecast Period | 2026-2034 |
| Historical Period | 2020-2025 |
| Growth Rate | CAGR of 4.8% from 2020-2034 |
| Segmentation |
|
Table of Contents
- 1. Introduction
- 1.1. Research Scope
- 1.2. Market Segmentation
- 1.3. Research Objective
- 1.4. Definitions and Assumptions
- 2. Executive Summary
- 2.1. Market Snapshot
- 3. Market Dynamics
- 3.1. Market Drivers
- 3.2. Market Restrains
- 3.3. Market Trends
- 3.4. Market Opportunities
- 4. Market Factor Analysis
- 4.1. Porters Five Forces
- 4.1.1. Bargaining Power of Suppliers
- 4.1.2. Bargaining Power of Buyers
- 4.1.3. Threat of New Entrants
- 4.1.4. Threat of Substitutes
- 4.1.5. Competitive Rivalry
- 4.2. PESTEL analysis
- 4.3. BCG Analysis
- 4.3.1. Stars (High Growth, High Market Share)
- 4.3.2. Cash Cows (Low Growth, High Market Share)
- 4.3.3. Question Mark (High Growth, Low Market Share)
- 4.3.4. Dogs (Low Growth, Low Market Share)
- 4.4. Ansoff Matrix Analysis
- 4.5. Supply Chain Analysis
- 4.6. Regulatory Landscape
- 4.7. Current Market Potential and Opportunity Assessment (TAM–SAM–SOM Framework)
- 4.8. VDR Analyst Note
- 4.1. Porters Five Forces
- 5. Market Analysis, Insights and Forecast 2021-2033
- 5.1. Market Analysis, Insights and Forecast - by Location of Deployment
- 5.1.1. Offshore
- 5.1.2. Onshore
- 5.2. Market Analysis, Insights and Forecast - by Geogrpahy
- 5.2.1. North America
- 5.2.2. Europe
- 5.2.3. Asia-Pacific
- 5.2.4. Middle-East and Africa
- 5.2.5. South America
- 5.3. Market Analysis, Insights and Forecast - by Region
- 5.3.1. North America
- 5.3.2. South America
- 5.3.3. Europe
- 5.3.4. Middle East & Africa
- 5.3.5. Asia Pacific
- 5.1. Market Analysis, Insights and Forecast - by Location of Deployment
- 6. Global Oil and Gas Nuclear Magnetic Resonance Industry Analysis, Insights and Forecast, 2021-2033
- 6.1. Market Analysis, Insights and Forecast - by Location of Deployment
- 6.1.1. Offshore
- 6.1.2. Onshore
- 6.2. Market Analysis, Insights and Forecast - by Geogrpahy
- 6.2.1. North America
- 6.2.2. Europe
- 6.2.3. Asia-Pacific
- 6.2.4. Middle-East and Africa
- 6.2.5. South America
- 6.1. Market Analysis, Insights and Forecast - by Location of Deployment
- 7. North America Oil and Gas Nuclear Magnetic Resonance Industry Analysis, Insights and Forecast, 2021-2033
- 7.1. Market Analysis, Insights and Forecast - by Location of Deployment
- 7.1.1. Offshore
- 7.1.2. Onshore
- 7.2. Market Analysis, Insights and Forecast - by Geogrpahy
- 7.2.1. North America
- 7.2.2. Europe
- 7.2.3. Asia-Pacific
- 7.2.4. Middle-East and Africa
- 7.2.5. South America
- 7.1. Market Analysis, Insights and Forecast - by Location of Deployment
- 8. South America Oil and Gas Nuclear Magnetic Resonance Industry Analysis, Insights and Forecast, 2021-2033
- 8.1. Market Analysis, Insights and Forecast - by Location of Deployment
- 8.1.1. Offshore
- 8.1.2. Onshore
- 8.2. Market Analysis, Insights and Forecast - by Geogrpahy
- 8.2.1. North America
- 8.2.2. Europe
- 8.2.3. Asia-Pacific
- 8.2.4. Middle-East and Africa
- 8.2.5. South America
- 8.1. Market Analysis, Insights and Forecast - by Location of Deployment
- 9. Europe Oil and Gas Nuclear Magnetic Resonance Industry Analysis, Insights and Forecast, 2021-2033
- 9.1. Market Analysis, Insights and Forecast - by Location of Deployment
- 9.1.1. Offshore
- 9.1.2. Onshore
- 9.2. Market Analysis, Insights and Forecast - by Geogrpahy
- 9.2.1. North America
- 9.2.2. Europe
- 9.2.3. Asia-Pacific
- 9.2.4. Middle-East and Africa
- 9.2.5. South America
- 9.1. Market Analysis, Insights and Forecast - by Location of Deployment
- 10. Middle East & Africa Oil and Gas Nuclear Magnetic Resonance Industry Analysis, Insights and Forecast, 2021-2033
- 10.1. Market Analysis, Insights and Forecast - by Location of Deployment
- 10.1.1. Offshore
- 10.1.2. Onshore
- 10.2. Market Analysis, Insights and Forecast - by Geogrpahy
- 10.2.1. North America
- 10.2.2. Europe
- 10.2.3. Asia-Pacific
- 10.2.4. Middle-East and Africa
- 10.2.5. South America
- 10.1. Market Analysis, Insights and Forecast - by Location of Deployment
- 11. Asia Pacific Oil and Gas Nuclear Magnetic Resonance Industry Analysis, Insights and Forecast, 2021-2033
- 11.1. Market Analysis, Insights and Forecast - by Location of Deployment
- 11.1.1. Offshore
- 11.1.2. Onshore
- 11.2. Market Analysis, Insights and Forecast - by Geogrpahy
- 11.2.1. North America
- 11.2.2. Europe
- 11.2.3. Asia-Pacific
- 11.2.4. Middle-East and Africa
- 11.2.5. South America
- 11.1. Market Analysis, Insights and Forecast - by Location of Deployment
- 12. Competitive Analysis
- 12.1. Company Profiles
- 12.1.1 Mount Sopris Instruments Inc
- 12.1.1.1. Company Overview
- 12.1.1.2. Products
- 12.1.1.3. Company Financials
- 12.1.1.4. SWOT Analysis
- 12.1.2 Vista Clara Inc
- 12.1.2.1. Company Overview
- 12.1.2.2. Products
- 12.1.2.3. Company Financials
- 12.1.2.4. SWOT Analysis
- 12.1.3 Weatherford International plc
- 12.1.3.1. Company Overview
- 12.1.3.2. Products
- 12.1.3.3. Company Financials
- 12.1.3.4. SWOT Analysis
- 12.1.4 Baker Hughes Company
- 12.1.4.1. Company Overview
- 12.1.4.2. Products
- 12.1.4.3. Company Financials
- 12.1.4.4. SWOT Analysis
- 12.1.5 Halliburton Company
- 12.1.5.1. Company Overview
- 12.1.5.2. Products
- 12.1.5.3. Company Financials
- 12.1.5.4. SWOT Analysis
- 12.1.6 Qteq Pty Ltd
- 12.1.6.1. Company Overview
- 12.1.6.2. Products
- 12.1.6.3. Company Financials
- 12.1.6.4. SWOT Analysis
- 12.1.7 Schlumberger Limited
- 12.1.7.1. Company Overview
- 12.1.7.2. Products
- 12.1.7.3. Company Financials
- 12.1.7.4. SWOT Analysis
- 12.1.1 Mount Sopris Instruments Inc
- 12.2. Market Entropy
- 12.2.1 Company's Key Areas Served
- 12.2.2 Recent Developments
- 12.3. Company Market Share Analysis 2025
- 12.3.1 Top 5 Companies Market Share Analysis
- 12.3.2 Top 3 Companies Market Share Analysis
- 12.4. List of Potential Customers
- 13. Research Methodology
List of Figures
- Figure 1: Global Oil and Gas Nuclear Magnetic Resonance Industry Revenue Breakdown (billion, %) by Region 2025 & 2033
- Figure 2: North America Oil and Gas Nuclear Magnetic Resonance Industry Revenue (billion), by Location of Deployment 2025 & 2033
- Figure 3: North America Oil and Gas Nuclear Magnetic Resonance Industry Revenue Share (%), by Location of Deployment 2025 & 2033
- Figure 4: North America Oil and Gas Nuclear Magnetic Resonance Industry Revenue (billion), by Geogrpahy 2025 & 2033
- Figure 5: North America Oil and Gas Nuclear Magnetic Resonance Industry Revenue Share (%), by Geogrpahy 2025 & 2033
- Figure 6: North America Oil and Gas Nuclear Magnetic Resonance Industry Revenue (billion), by Country 2025 & 2033
- Figure 7: North America Oil and Gas Nuclear Magnetic Resonance Industry Revenue Share (%), by Country 2025 & 2033
- Figure 8: South America Oil and Gas Nuclear Magnetic Resonance Industry Revenue (billion), by Location of Deployment 2025 & 2033
- Figure 9: South America Oil and Gas Nuclear Magnetic Resonance Industry Revenue Share (%), by Location of Deployment 2025 & 2033
- Figure 10: South America Oil and Gas Nuclear Magnetic Resonance Industry Revenue (billion), by Geogrpahy 2025 & 2033
- Figure 11: South America Oil and Gas Nuclear Magnetic Resonance Industry Revenue Share (%), by Geogrpahy 2025 & 2033
- Figure 12: South America Oil and Gas Nuclear Magnetic Resonance Industry Revenue (billion), by Country 2025 & 2033
- Figure 13: South America Oil and Gas Nuclear Magnetic Resonance Industry Revenue Share (%), by Country 2025 & 2033
- Figure 14: Europe Oil and Gas Nuclear Magnetic Resonance Industry Revenue (billion), by Location of Deployment 2025 & 2033
- Figure 15: Europe Oil and Gas Nuclear Magnetic Resonance Industry Revenue Share (%), by Location of Deployment 2025 & 2033
- Figure 16: Europe Oil and Gas Nuclear Magnetic Resonance Industry Revenue (billion), by Geogrpahy 2025 & 2033
- Figure 17: Europe Oil and Gas Nuclear Magnetic Resonance Industry Revenue Share (%), by Geogrpahy 2025 & 2033
- Figure 18: Europe Oil and Gas Nuclear Magnetic Resonance Industry Revenue (billion), by Country 2025 & 2033
- Figure 19: Europe Oil and Gas Nuclear Magnetic Resonance Industry Revenue Share (%), by Country 2025 & 2033
- Figure 20: Middle East & Africa Oil and Gas Nuclear Magnetic Resonance Industry Revenue (billion), by Location of Deployment 2025 & 2033
- Figure 21: Middle East & Africa Oil and Gas Nuclear Magnetic Resonance Industry Revenue Share (%), by Location of Deployment 2025 & 2033
- Figure 22: Middle East & Africa Oil and Gas Nuclear Magnetic Resonance Industry Revenue (billion), by Geogrpahy 2025 & 2033
- Figure 23: Middle East & Africa Oil and Gas Nuclear Magnetic Resonance Industry Revenue Share (%), by Geogrpahy 2025 & 2033
- Figure 24: Middle East & Africa Oil and Gas Nuclear Magnetic Resonance Industry Revenue (billion), by Country 2025 & 2033
- Figure 25: Middle East & Africa Oil and Gas Nuclear Magnetic Resonance Industry Revenue Share (%), by Country 2025 & 2033
- Figure 26: Asia Pacific Oil and Gas Nuclear Magnetic Resonance Industry Revenue (billion), by Location of Deployment 2025 & 2033
- Figure 27: Asia Pacific Oil and Gas Nuclear Magnetic Resonance Industry Revenue Share (%), by Location of Deployment 2025 & 2033
- Figure 28: Asia Pacific Oil and Gas Nuclear Magnetic Resonance Industry Revenue (billion), by Geogrpahy 2025 & 2033
- Figure 29: Asia Pacific Oil and Gas Nuclear Magnetic Resonance Industry Revenue Share (%), by Geogrpahy 2025 & 2033
- Figure 30: Asia Pacific Oil and Gas Nuclear Magnetic Resonance Industry Revenue (billion), by Country 2025 & 2033
- Figure 31: Asia Pacific Oil and Gas Nuclear Magnetic Resonance Industry Revenue Share (%), by Country 2025 & 2033
List of Tables
- Table 1: Global Oil and Gas Nuclear Magnetic Resonance Industry Revenue billion Forecast, by Location of Deployment 2020 & 2033
- Table 2: Global Oil and Gas Nuclear Magnetic Resonance Industry Revenue billion Forecast, by Geogrpahy 2020 & 2033
- Table 3: Global Oil and Gas Nuclear Magnetic Resonance Industry Revenue billion Forecast, by Region 2020 & 2033
- Table 4: Global Oil and Gas Nuclear Magnetic Resonance Industry Revenue billion Forecast, by Location of Deployment 2020 & 2033
- Table 5: Global Oil and Gas Nuclear Magnetic Resonance Industry Revenue billion Forecast, by Geogrpahy 2020 & 2033
- Table 6: Global Oil and Gas Nuclear Magnetic Resonance Industry Revenue billion Forecast, by Country 2020 & 2033
- Table 7: United States Oil and Gas Nuclear Magnetic Resonance Industry Revenue (billion) Forecast, by Application 2020 & 2033
- Table 8: Canada Oil and Gas Nuclear Magnetic Resonance Industry Revenue (billion) Forecast, by Application 2020 & 2033
- Table 9: Mexico Oil and Gas Nuclear Magnetic Resonance Industry Revenue (billion) Forecast, by Application 2020 & 2033
- Table 10: Global Oil and Gas Nuclear Magnetic Resonance Industry Revenue billion Forecast, by Location of Deployment 2020 & 2033
- Table 11: Global Oil and Gas Nuclear Magnetic Resonance Industry Revenue billion Forecast, by Geogrpahy 2020 & 2033
- Table 12: Global Oil and Gas Nuclear Magnetic Resonance Industry Revenue billion Forecast, by Country 2020 & 2033
- Table 13: Brazil Oil and Gas Nuclear Magnetic Resonance Industry Revenue (billion) Forecast, by Application 2020 & 2033
- Table 14: Argentina Oil and Gas Nuclear Magnetic Resonance Industry Revenue (billion) Forecast, by Application 2020 & 2033
- Table 15: Rest of South America Oil and Gas Nuclear Magnetic Resonance Industry Revenue (billion) Forecast, by Application 2020 & 2033
- Table 16: Global Oil and Gas Nuclear Magnetic Resonance Industry Revenue billion Forecast, by Location of Deployment 2020 & 2033
- Table 17: Global Oil and Gas Nuclear Magnetic Resonance Industry Revenue billion Forecast, by Geogrpahy 2020 & 2033
- Table 18: Global Oil and Gas Nuclear Magnetic Resonance Industry Revenue billion Forecast, by Country 2020 & 2033
- Table 19: United Kingdom Oil and Gas Nuclear Magnetic Resonance Industry Revenue (billion) Forecast, by Application 2020 & 2033
- Table 20: Germany Oil and Gas Nuclear Magnetic Resonance Industry Revenue (billion) Forecast, by Application 2020 & 2033
- Table 21: France Oil and Gas Nuclear Magnetic Resonance Industry Revenue (billion) Forecast, by Application 2020 & 2033
- Table 22: Italy Oil and Gas Nuclear Magnetic Resonance Industry Revenue (billion) Forecast, by Application 2020 & 2033
- Table 23: Spain Oil and Gas Nuclear Magnetic Resonance Industry Revenue (billion) Forecast, by Application 2020 & 2033
- Table 24: Russia Oil and Gas Nuclear Magnetic Resonance Industry Revenue (billion) Forecast, by Application 2020 & 2033
- Table 25: Benelux Oil and Gas Nuclear Magnetic Resonance Industry Revenue (billion) Forecast, by Application 2020 & 2033
- Table 26: Nordics Oil and Gas Nuclear Magnetic Resonance Industry Revenue (billion) Forecast, by Application 2020 & 2033
- Table 27: Rest of Europe Oil and Gas Nuclear Magnetic Resonance Industry Revenue (billion) Forecast, by Application 2020 & 2033
- Table 28: Global Oil and Gas Nuclear Magnetic Resonance Industry Revenue billion Forecast, by Location of Deployment 2020 & 2033
- Table 29: Global Oil and Gas Nuclear Magnetic Resonance Industry Revenue billion Forecast, by Geogrpahy 2020 & 2033
- Table 30: Global Oil and Gas Nuclear Magnetic Resonance Industry Revenue billion Forecast, by Country 2020 & 2033
- Table 31: Turkey Oil and Gas Nuclear Magnetic Resonance Industry Revenue (billion) Forecast, by Application 2020 & 2033
- Table 32: Israel Oil and Gas Nuclear Magnetic Resonance Industry Revenue (billion) Forecast, by Application 2020 & 2033
- Table 33: GCC Oil and Gas Nuclear Magnetic Resonance Industry Revenue (billion) Forecast, by Application 2020 & 2033
- Table 34: North Africa Oil and Gas Nuclear Magnetic Resonance Industry Revenue (billion) Forecast, by Application 2020 & 2033
- Table 35: South Africa Oil and Gas Nuclear Magnetic Resonance Industry Revenue (billion) Forecast, by Application 2020 & 2033
- Table 36: Rest of Middle East & Africa Oil and Gas Nuclear Magnetic Resonance Industry Revenue (billion) Forecast, by Application 2020 & 2033
- Table 37: Global Oil and Gas Nuclear Magnetic Resonance Industry Revenue billion Forecast, by Location of Deployment 2020 & 2033
- Table 38: Global Oil and Gas Nuclear Magnetic Resonance Industry Revenue billion Forecast, by Geogrpahy 2020 & 2033
- Table 39: Global Oil and Gas Nuclear Magnetic Resonance Industry Revenue billion Forecast, by Country 2020 & 2033
- Table 40: China Oil and Gas Nuclear Magnetic Resonance Industry Revenue (billion) Forecast, by Application 2020 & 2033
- Table 41: India Oil and Gas Nuclear Magnetic Resonance Industry Revenue (billion) Forecast, by Application 2020 & 2033
- Table 42: Japan Oil and Gas Nuclear Magnetic Resonance Industry Revenue (billion) Forecast, by Application 2020 & 2033
- Table 43: South Korea Oil and Gas Nuclear Magnetic Resonance Industry Revenue (billion) Forecast, by Application 2020 & 2033
- Table 44: ASEAN Oil and Gas Nuclear Magnetic Resonance Industry Revenue (billion) Forecast, by Application 2020 & 2033
- Table 45: Oceania Oil and Gas Nuclear Magnetic Resonance Industry Revenue (billion) Forecast, by Application 2020 & 2033
- Table 46: Rest of Asia Pacific Oil and Gas Nuclear Magnetic Resonance Industry Revenue (billion) Forecast, by Application 2020 & 2033
Frequently Asked Questions
1. What is the projected Compound Annual Growth Rate (CAGR) of the Oil and Gas Nuclear Magnetic Resonance Industry?
The projected CAGR is approximately 4.8%.
2. Which companies are prominent players in the Oil and Gas Nuclear Magnetic Resonance Industry?
Key companies in the market include Mount Sopris Instruments Inc, Vista Clara Inc, Weatherford International plc, Baker Hughes Company, Halliburton Company, Qteq Pty Ltd, Schlumberger Limited.
3. What are the main segments of the Oil and Gas Nuclear Magnetic Resonance Industry?
The market segments include Location of Deployment, Geogrpahy.
4. Can you provide details about the market size?
The market size is estimated to be USD 4.8 billion as of 2022.
5. What are some drivers contributing to market growth?
4.; Increasing Production from Unconventional Sources4.; Growing Energy Demand in the Region.
6. What are the notable trends driving market growth?
Onshore Sector to Dominate the Demand.
7. Are there any restraints impacting market growth?
4.; Environmental Concerns.
8. Can you provide examples of recent developments in the market?
February 2023: Saudi Aramco expects to award contracts for some 90 projects by 2025 as it presses ahead with major upstream oil and gas capacity expansions.
9. What pricing options are available for accessing the report?
Pricing options include single-user, multi-user, and enterprise licenses priced at USD 4750, USD 5250, and USD 8750 respectively.
10. Is the market size provided in terms of value or volume?
The market size is provided in terms of value, measured in billion.
11. Are there any specific market keywords associated with the report?
Yes, the market keyword associated with the report is "Oil and Gas Nuclear Magnetic Resonance Industry," which aids in identifying and referencing the specific market segment covered.
12. How do I determine which pricing option suits my needs best?
The pricing options vary based on user requirements and access needs. Individual users may opt for single-user licenses, while businesses requiring broader access may choose multi-user or enterprise licenses for cost-effective access to the report.
13. Are there any additional resources or data provided in the Oil and Gas Nuclear Magnetic Resonance Industry report?
While the report offers comprehensive insights, it's advisable to review the specific contents or supplementary materials provided to ascertain if additional resources or data are available.
14. How can I stay updated on further developments or reports in the Oil and Gas Nuclear Magnetic Resonance Industry?
To stay informed about further developments, trends, and reports in the Oil and Gas Nuclear Magnetic Resonance Industry, consider subscribing to industry newsletters, following relevant companies and organizations, or regularly checking reputable industry news sources and publications.
Methodology
Step 1 - Identification of Relevant Samples Size from Population Database


Step 2 - Approaches for Defining Global Market Size (Value, Volume* & Price*)

Note*: In applicable scenarios
Step 3 - Data Sources
Primary Research
- Web Analytics
- Survey Reports
- Research Institute
- Latest Research Reports
- Opinion Leaders
Secondary Research
- Annual Reports
- White Paper
- Latest Press Release
- Industry Association
- Paid Database
- Investor Presentations

Step 4 - Data Triangulation
Involves using different sources of information in order to increase the validity of a study
These sources are likely to be stakeholders in a program - participants, other researchers, program staff, other community members, and so on.
Then we put all data in single framework & apply various statistical tools to find out the dynamic on the market.
During the analysis stage, feedback from the stakeholder groups would be compared to determine areas of agreement as well as areas of divergence