

Key Insights
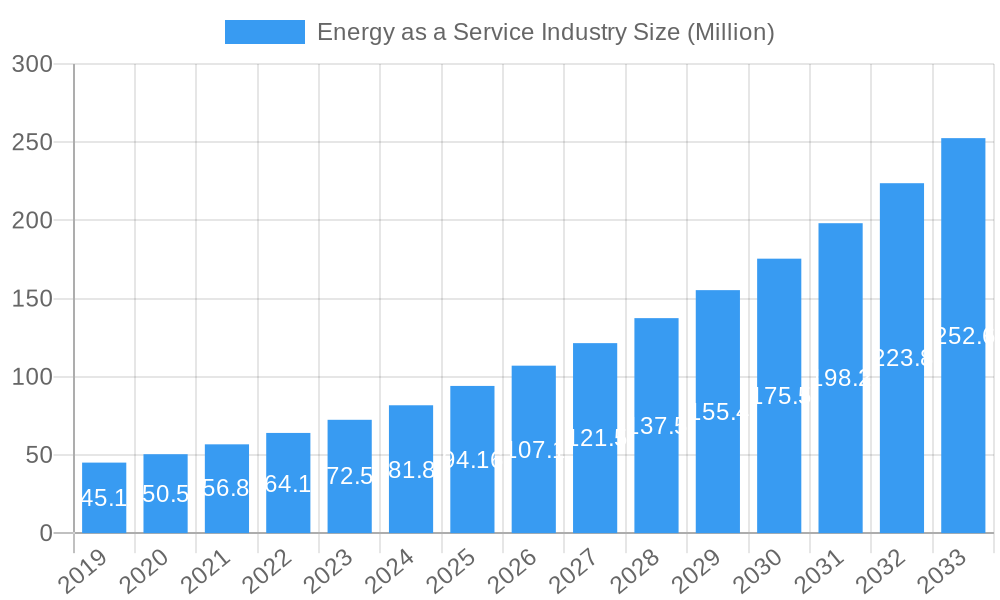
The global Energy as a Service (EaaS) market is poised for substantial expansion, projected to reach a market size of approximately USD 94.16 million by 2025 and exhibiting a robust Compound Annual Growth Rate (CAGR) of 12.48% throughout the forecast period of 2025-2033. This impressive growth trajectory is underpinned by several critical drivers. Increasing demand for energy efficiency solutions, driven by escalating energy costs and stringent environmental regulations, is a primary catalyst. Businesses across commercial and industrial sectors are actively seeking ways to optimize their energy consumption, reduce operational expenses, and lower their carbon footprints. EaaS models offer a compelling value proposition by shifting the capital expenditure burden from end-users to service providers, allowing them to benefit from energy savings without upfront investment. Furthermore, advancements in smart grid technologies, IoT integration, and sophisticated energy management systems are enhancing the capabilities and appeal of EaaS offerings, enabling more precise monitoring, control, and optimization of energy usage.
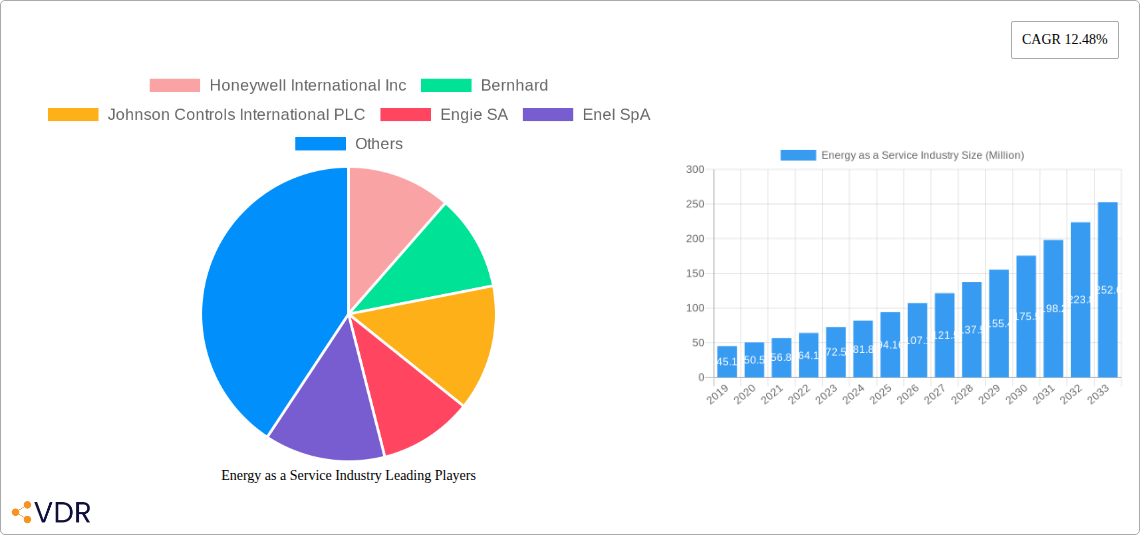
Energy as a Service Industry Market Size (In Million)
The EaaS market is characterized by a clear trend towards integrated service offerings, moving beyond simple energy supply to encompass a broader spectrum of solutions including energy generation, storage, and demand-side management. This holistic approach caters to the evolving needs of both commercial and industrial clients who are increasingly focused on energy resilience and sustainability. Key players like Honeywell International Inc., Johnson Controls International PLC, and Schneider Electric SE are at the forefront, innovating and expanding their portfolios to capture market share. While the market exhibits strong growth potential, certain restraints need to be addressed. These include the initial complexity of contract negotiations, potential concerns regarding data security and privacy within shared energy systems, and the need for greater standardization in EaaS deployment models to facilitate wider adoption. Overcoming these challenges will be crucial for unlocking the full potential of this dynamic and rapidly evolving market.
Energy as a Service Industry Company Market Share
Energy as a Service (EaaS) Industry Report: Comprehensive Market Analysis & Future Outlook (2019-2033)
This in-depth report provides a comprehensive analysis of the Energy as a Service (EaaS) industry, exploring its dynamic market structure, growth trajectories, key players, and future potential. Spanning from 2019 to 2033, with a base year of 2025 and a forecast period of 2025-2033, this report leverages extensive historical data (2019-2024) to deliver actionable insights for industry professionals, investors, and policymakers. The parent market, the broader energy sector, is undergoing a significant transformation driven by sustainability mandates and technological advancements, with EaaS emerging as a critical child market facilitating this transition. This report delves into the intricacies of EaaS adoption across commercial and industrial end-user segments, offering a granular view of its impact and evolution.
Energy as a Service Industry Market Dynamics & Structure
The Energy as a Service (EaaS) industry is characterized by a moderately concentrated market, with a few dominant players alongside a growing number of specialized providers. Technological innovation, particularly in areas like IoT, AI-driven energy management, and distributed energy resources (DERs), serves as a primary driver. Regulatory frameworks promoting energy efficiency and decarbonization are also shaping market dynamics, encouraging investments in EaaS solutions. Competitive product substitutes, such as traditional energy procurement models and in-house energy management systems, are increasingly being challenged by the comprehensive service offerings of EaaS providers. End-user demographics are diverse, encompassing large commercial enterprises and industrial facilities seeking to optimize energy consumption, reduce operational costs, and meet sustainability goals. Mergers and acquisitions (M&A) trends indicate a consolidating landscape, with larger energy conglomerates and technology firms acquiring smaller EaaS specialists to expand their service portfolios and market reach.
- Market Concentration: Dominated by key players but with emerging niche providers.
- Technological Innovation: Driven by IoT, AI, DERs, and advanced analytics for predictive maintenance and optimization.
- Regulatory Frameworks: Supportive policies for energy efficiency, renewables, and carbon emission reduction are critical.
- Competitive Landscape: EaaS offers a compelling alternative to traditional energy management.
- End-User Segmentation: Focus on commercial and industrial sectors due to their significant energy footprints.
- M&A Activity: Strategic acquisitions to gain market share and technological capabilities.
Energy as a Service Industry Growth Trends & Insights
The Energy as a Service (EaaS) market is poised for substantial growth, driven by a confluence of factors including escalating energy costs, increasing environmental consciousness, and the growing demand for predictable and optimized energy expenditures. The market size is projected to expand significantly from an estimated USD XX million in 2025 to USD XX million by 2033, exhibiting a robust Compound Annual Growth Rate (CAGR) of approximately XX% during the forecast period. This expansion is fueled by higher adoption rates across both commercial and industrial sectors, as businesses increasingly recognize the financial and operational benefits of outsourcing their energy management needs. Technological disruptions, such as the integration of smart grid technologies, advancements in battery storage, and the proliferation of renewable energy sources, are further accelerating EaaS adoption. These innovations enable providers to offer more sophisticated solutions, including demand response, energy efficiency upgrades, and on-site generation, all bundled into flexible service agreements. Consumer behavior is shifting from a passive energy consumption model to an active, cost-management-driven approach, with businesses actively seeking long-term partnerships that guarantee cost savings, improved energy reliability, and reduced carbon footprints. The market penetration of EaaS solutions is expected to deepen as more organizations understand the value proposition beyond simple energy procurement, encompassing energy security, operational resilience, and the achievement of corporate sustainability objectives. The evolution of financing models within EaaS, often characterized by performance-based contracts, significantly lowers the upfront capital expenditure barrier for end-users, making these advanced energy solutions accessible to a wider range of businesses. This trend is particularly impactful for small and medium-sized enterprises (SMEs) that may lack the capital for direct investments in energy-efficient technologies or on-site generation. The increasing complexity of energy markets, coupled with evolving regulatory landscapes around emissions and carbon pricing, also compels businesses to seek expert guidance and integrated solutions that EaaS providers are uniquely positioned to offer. The overall market evolution is marked by a transition towards more comprehensive and value-added services, moving beyond basic energy supply to encompass a holistic approach to energy management and sustainability. The integration of digital twins and advanced analytics platforms by EaaS providers allows for real-time monitoring, predictive maintenance, and continuous optimization of energy performance, thereby enhancing operational efficiency and reducing waste. This data-driven approach fosters greater transparency and accountability, further solidifying the trust and long-term relationships between EaaS providers and their clients.
Dominant Regions, Countries, or Segments in Energy as a Service Industry
The Commercial end-user segment is currently the dominant force driving growth within the Energy as a Service (EaaS) industry. This dominance is attributable to several key factors, including the significant and often varied energy consumption patterns across a wide spectrum of commercial establishments, such as office buildings, retail spaces, hospitals, and educational institutions. These entities are increasingly prioritizing energy efficiency and cost reduction as core business objectives, spurred by rising energy prices and a growing imperative to demonstrate corporate social responsibility. The adoption of EaaS in the commercial sector is further propelled by evolving economic policies aimed at encouraging green building practices and incentivizing energy performance improvements. For instance, tax credits, rebates, and mandates for energy audits in commercial properties create a favorable environment for EaaS adoption. Furthermore, the availability of innovative financing mechanisms, often integral to EaaS models, lowers the barrier to entry for commercial businesses that may have limited capital for upfront investments in energy-saving technologies. The market share of the commercial segment is substantial, estimated to be around XX% of the total EaaS market in 2025, with projections indicating a continued upward trajectory.
Key drivers contributing to the Commercial segment's dominance include:
- High Energy Footprint: A large number and diverse range of commercial buildings consume significant amounts of energy, creating substantial opportunities for optimization.
- Cost Savings Imperative: Businesses are keenly aware of the impact of energy costs on their bottom line and are actively seeking solutions to mitigate these expenses.
- Sustainability Mandates: Growing pressure from stakeholders, regulatory bodies, and public opinion compels commercial entities to reduce their carbon emissions.
- Technological Integration: Commercial buildings are often early adopters of smart technologies, making them fertile ground for EaaS solutions that leverage IoT and AI for energy management.
- Government Incentives and Regulations: Policies promoting energy efficiency and renewable energy adoption directly benefit EaaS providers targeting the commercial sector.
- Predictable Operating Expenses: EaaS offers fixed or performance-based pricing models, allowing for more accurate budget forecasting, a critical factor for many businesses.
The growth potential within the commercial segment remains immense, as many organizations are still in the early stages of adopting comprehensive EaaS solutions. As awareness grows and successful case studies proliferate, the industrial segment is also anticipated to witness accelerated growth, driven by the unique energy demands and efficiency opportunities within manufacturing and heavy industry. However, for the current forecast period, the commercial sector stands out as the primary engine of EaaS market expansion.
Energy as a Service Industry Product Landscape
The product landscape within the Energy as a Service (EaaS) industry is characterized by an evolving suite of integrated solutions designed to optimize energy consumption, reduce costs, and enhance sustainability for end-users. These offerings go beyond traditional energy supply to encompass a holistic approach to energy management. Key innovations include sophisticated energy management systems (EMS) powered by IoT sensors and AI algorithms for real-time monitoring, predictive analytics, and automated adjustments. Performance metrics are central, with providers guaranteeing specific energy savings or operational improvements. Unique selling propositions often revolve around bundled services such as energy efficiency upgrades, on-site renewable energy generation (solar, wind), battery storage solutions, electric vehicle charging infrastructure, and smart building technologies, all delivered under flexible, performance-based contracts.
Key Drivers, Barriers & Challenges in Energy as a Service Industry
Key Drivers:
- Cost Optimization: Businesses seek to reduce operational expenses through guaranteed energy savings and predictable energy costs.
- Sustainability Goals: Increasing regulatory pressure and corporate social responsibility mandates drive the adoption of clean energy solutions.
- Technological Advancements: Innovations in IoT, AI, and renewable energy technologies enable more efficient and comprehensive EaaS offerings.
- Energy Security & Reliability: EaaS can provide resilient energy solutions, mitigating risks associated with grid instability and price volatility.
Barriers & Challenges:
- High Upfront Investment (for some solutions): While EaaS often reduces upfront costs for end-users, the initial deployment of advanced technologies by providers can still be significant.
- Complexity of Contracts: EaaS agreements can be intricate, requiring careful negotiation and understanding of performance metrics and service level agreements.
- Lack of Awareness & Education: Many potential customers are not fully aware of the benefits and scope of EaaS offerings, leading to slower adoption rates.
- Regulatory Uncertainty: Evolving energy policies and grid interconnection regulations can create challenges for the widespread implementation of distributed energy resources within EaaS models.
- Supply Chain Disruptions: Global supply chain issues can impact the availability and cost of critical components for EaaS projects.
Emerging Opportunities in Energy as a Service Industry
Emerging opportunities in the EaaS industry are primarily centered around the expansion into new market segments and the integration of cutting-edge technologies. The increasing focus on decarbonization is creating a significant demand for EaaS solutions that facilitate the transition to renewable energy sources and electrify industrial processes. Untapped markets include smaller commercial enterprises and public sector entities that can benefit from the financial predictability and sustainability benefits of EaaS. Innovative applications such as microgrids, virtual power plants, and grid-interactive efficient buildings present substantial growth potential. Furthermore, the evolving consumer preferences for transparent and sustainable business practices are driving demand for EaaS providers who can offer comprehensive reporting on energy usage and carbon footprint reduction, solidifying brand reputation and attracting environmentally conscious clients. The integration of advanced data analytics and artificial intelligence for predictive maintenance and energy optimization will continue to be a key differentiator.
Growth Accelerators in the Energy as a Service Industry Industry
Several catalysts are accelerating long-term growth in the Energy as a Service (EaaS) industry. Technological breakthroughs in energy storage, such as more efficient and cost-effective battery technologies, are significantly enhancing the viability of renewable energy integration and grid stabilization services offered by EaaS providers. Strategic partnerships between technology companies, energy utilities, and financial institutions are crucial for developing integrated solutions and expanding market reach. For example, collaborations that combine hardware innovation with software platforms and attractive financing options can de-risk EaaS projects for end-users. Market expansion strategies, including targeting underserved regions and offering tailored EaaS packages for specific industry verticals, are also critical growth enablers. The increasing awareness and commitment to Environmental, Social, and Governance (ESG) goals across global corporations further bolster the demand for EaaS solutions that directly contribute to sustainability targets.
Key Players Shaping the Energy as a Service Industry Market
- Honeywell International Inc
- Bernhard
- Johnson Controls International PLC
- Engie SA
- Enel SpA
- Spark Community Investment Co
- Schneider Electric SE
- Veolia Environnement SA
- Electricite de France (EDF) SA
Notable Milestones in Energy as a Service Industry Sector
- April 2023: Capstone Green Energy Corporation's southern U.S. distributor, Lone Star Power Solutions, secured an Energy-as-a-Service (EaaS) contract for 3.6 MW with a large West Texas energy company, involving the delivery of an additional C800S Signature Series microturbine. This signifies continued expansion of EaaS in the industrial sector for distributed generation.
- March 2023: Honeywell announced a strategic investment in Redaptive, aiming to accelerate the deployment of Energy-as-a-Services (EaaS) capabilities within commercial and industrial buildings. This investment is designed to expedite the implementation of technologies focused on reducing carbon emissions across a broad portfolio of properties.
In-Depth Energy as a Service Industry Market Outlook
The future outlook for the Energy as a Service (EaaS) industry is exceptionally positive, driven by a sustained shift towards energy efficiency, decarbonization, and digital transformation. Growth accelerators, including advancements in renewable energy integration, smart grid technologies, and sophisticated data analytics, will continue to fuel market expansion. Strategic partnerships will play a pivotal role in developing comprehensive, customer-centric EaaS solutions, bridging technology, finance, and energy expertise. The increasing emphasis on ESG compliance by corporations globally presents a significant opportunity for EaaS providers to offer solutions that directly contribute to achieving sustainability targets. The market is expected to witness deeper penetration into various end-user segments, with a particular focus on enabling the electrification of industries and transportation. Overall, the EaaS industry is positioned to be a cornerstone in the global energy transition, offering innovative and cost-effective pathways for businesses to manage their energy consumption, reduce environmental impact, and enhance operational resilience.
Energy as a Service Industry Segmentation
-
1. End User
- 1.1. Commercial
- 1.2. Industrial
Energy as a Service Industry Segmentation By Geography
-
1. North America
- 1.1. United States
- 1.2. Canada
- 1.3. Rest of North America
-
2. Europe
- 2.1. Germany
- 2.2. France
- 2.3. United Kingdom
- 2.4. Rest of Europe
-
3. Asia Pacific
- 3.1. China
- 3.2. India
- 3.3. Japan
- 3.4. South Korea
- 3.5. Rest of Asia Pacific
-
4. South America
- 4.1. Brazil
- 4.2. Argentina
- 4.3. Rest of South America
-
5. Middle East and Africa
- 5.1. Saudi Arabia
- 5.2. United Arab Emirates
- 5.3. South Africa
- 5.4. Rest of Middle East and Africa
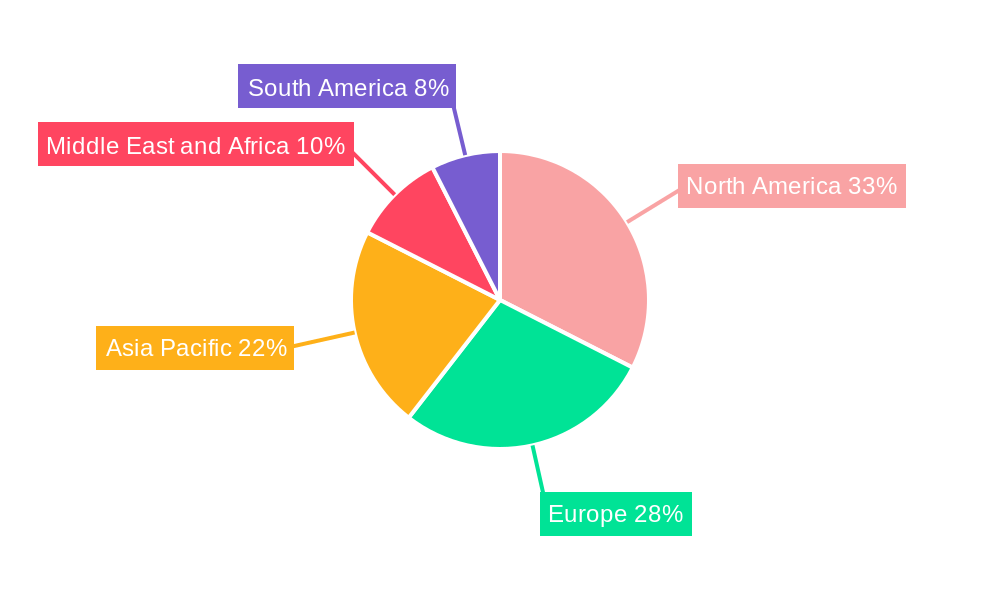
Energy as a Service Industry Regional Market Share
Geographic Coverage of Energy as a Service Industry
Energy as a Service Industry REPORT HIGHLIGHTS
| Aspects | Details |
|---|---|
| Study Period | 2020-2034 |
| Base Year | 2025 |
| Estimated Year | 2026 |
| Forecast Period | 2026-2034 |
| Historical Period | 2020-2025 |
| Growth Rate | CAGR of 12.48% from 2020-2034 |
| Segmentation |
|
Table of Contents
- 1. Introduction
- 1.1. Research Scope
- 1.2. Market Segmentation
- 1.3. Research Objective
- 1.4. Definitions and Assumptions
- 2. Executive Summary
- 2.1. Market Snapshot
- 3. Market Dynamics
- 3.1. Market Drivers
- 3.2. Market Restrains
- 3.3. Market Trends
- 3.4. Market Opportunities
- 4. Market Factor Analysis
- 4.1. Porters Five Forces
- 4.1.1. Bargaining Power of Suppliers
- 4.1.2. Bargaining Power of Buyers
- 4.1.3. Threat of New Entrants
- 4.1.4. Threat of Substitutes
- 4.1.5. Competitive Rivalry
- 4.2. PESTEL analysis
- 4.3. BCG Analysis
- 4.3.1. Stars (High Growth, High Market Share)
- 4.3.2. Cash Cows (Low Growth, High Market Share)
- 4.3.3. Question Mark (High Growth, Low Market Share)
- 4.3.4. Dogs (Low Growth, Low Market Share)
- 4.4. Ansoff Matrix Analysis
- 4.5. Supply Chain Analysis
- 4.6. Regulatory Landscape
- 4.7. Current Market Potential and Opportunity Assessment (TAM–SAM–SOM Framework)
- 4.8. VDR Analyst Note
- 4.1. Porters Five Forces
- 5. Market Analysis, Insights and Forecast 2021-2033
- 5.1. Market Analysis, Insights and Forecast - by End User
- 5.1.1. Commercial
- 5.1.2. Industrial
- 5.2. Market Analysis, Insights and Forecast - by Region
- 5.2.1. North America
- 5.2.2. Europe
- 5.2.3. Asia Pacific
- 5.2.4. South America
- 5.2.5. Middle East and Africa
- 5.1. Market Analysis, Insights and Forecast - by End User
- 6. Global Energy as a Service Industry Analysis, Insights and Forecast, 2021-2033
- 6.1. Market Analysis, Insights and Forecast - by End User
- 6.1.1. Commercial
- 6.1.2. Industrial
- 6.1. Market Analysis, Insights and Forecast - by End User
- 7. North America Energy as a Service Industry Analysis, Insights and Forecast, 2021-2033
- 7.1. Market Analysis, Insights and Forecast - by End User
- 7.1.1. Commercial
- 7.1.2. Industrial
- 7.1. Market Analysis, Insights and Forecast - by End User
- 8. Europe Energy as a Service Industry Analysis, Insights and Forecast, 2021-2033
- 8.1. Market Analysis, Insights and Forecast - by End User
- 8.1.1. Commercial
- 8.1.2. Industrial
- 8.1. Market Analysis, Insights and Forecast - by End User
- 9. Asia Pacific Energy as a Service Industry Analysis, Insights and Forecast, 2021-2033
- 9.1. Market Analysis, Insights and Forecast - by End User
- 9.1.1. Commercial
- 9.1.2. Industrial
- 9.1. Market Analysis, Insights and Forecast - by End User
- 10. South America Energy as a Service Industry Analysis, Insights and Forecast, 2021-2033
- 10.1. Market Analysis, Insights and Forecast - by End User
- 10.1.1. Commercial
- 10.1.2. Industrial
- 10.1. Market Analysis, Insights and Forecast - by End User
- 11. Middle East and Africa Energy as a Service Industry Analysis, Insights and Forecast, 2021-2033
- 11.1. Market Analysis, Insights and Forecast - by End User
- 11.1.1. Commercial
- 11.1.2. Industrial
- 11.1. Market Analysis, Insights and Forecast - by End User
- 12. Competitive Analysis
- 12.1. Company Profiles
- 12.1.1 Honeywell International Inc
- 12.1.1.1. Company Overview
- 12.1.1.2. Products
- 12.1.1.3. Company Financials
- 12.1.1.4. SWOT Analysis
- 12.1.2 Bernhard
- 12.1.2.1. Company Overview
- 12.1.2.2. Products
- 12.1.2.3. Company Financials
- 12.1.2.4. SWOT Analysis
- 12.1.3 Johnson Controls International PLC
- 12.1.3.1. Company Overview
- 12.1.3.2. Products
- 12.1.3.3. Company Financials
- 12.1.3.4. SWOT Analysis
- 12.1.4 Engie SA
- 12.1.4.1. Company Overview
- 12.1.4.2. Products
- 12.1.4.3. Company Financials
- 12.1.4.4. SWOT Analysis
- 12.1.5 Enel SpA
- 12.1.5.1. Company Overview
- 12.1.5.2. Products
- 12.1.5.3. Company Financials
- 12.1.5.4. SWOT Analysis
- 12.1.6 Spark Community Investment Co
- 12.1.6.1. Company Overview
- 12.1.6.2. Products
- 12.1.6.3. Company Financials
- 12.1.6.4. SWOT Analysis
- 12.1.7 Schneider Electric SE
- 12.1.7.1. Company Overview
- 12.1.7.2. Products
- 12.1.7.3. Company Financials
- 12.1.7.4. SWOT Analysis
- 12.1.8 Veolia Environnement SA
- 12.1.8.1. Company Overview
- 12.1.8.2. Products
- 12.1.8.3. Company Financials
- 12.1.8.4. SWOT Analysis
- 12.1.9 Electricite de France (EDF) SA
- 12.1.9.1. Company Overview
- 12.1.9.2. Products
- 12.1.9.3. Company Financials
- 12.1.9.4. SWOT Analysis
- 12.1.1 Honeywell International Inc
- 12.2. Market Entropy
- 12.2.1 Company's Key Areas Served
- 12.2.2 Recent Developments
- 12.3. Company Market Share Analysis 2025
- 12.3.1 Top 5 Companies Market Share Analysis
- 12.3.2 Top 3 Companies Market Share Analysis
- 12.4. List of Potential Customers
- 13. Research Methodology
List of Figures
- Figure 1: Global Energy as a Service Industry Revenue Breakdown (Million, %) by Region 2025 & 2033
- Figure 2: North America Energy as a Service Industry Revenue (Million), by End User 2025 & 2033
- Figure 3: North America Energy as a Service Industry Revenue Share (%), by End User 2025 & 2033
- Figure 4: North America Energy as a Service Industry Revenue (Million), by Country 2025 & 2033
- Figure 5: North America Energy as a Service Industry Revenue Share (%), by Country 2025 & 2033
- Figure 6: Europe Energy as a Service Industry Revenue (Million), by End User 2025 & 2033
- Figure 7: Europe Energy as a Service Industry Revenue Share (%), by End User 2025 & 2033
- Figure 8: Europe Energy as a Service Industry Revenue (Million), by Country 2025 & 2033
- Figure 9: Europe Energy as a Service Industry Revenue Share (%), by Country 2025 & 2033
- Figure 10: Asia Pacific Energy as a Service Industry Revenue (Million), by End User 2025 & 2033
- Figure 11: Asia Pacific Energy as a Service Industry Revenue Share (%), by End User 2025 & 2033
- Figure 12: Asia Pacific Energy as a Service Industry Revenue (Million), by Country 2025 & 2033
- Figure 13: Asia Pacific Energy as a Service Industry Revenue Share (%), by Country 2025 & 2033
- Figure 14: South America Energy as a Service Industry Revenue (Million), by End User 2025 & 2033
- Figure 15: South America Energy as a Service Industry Revenue Share (%), by End User 2025 & 2033
- Figure 16: South America Energy as a Service Industry Revenue (Million), by Country 2025 & 2033
- Figure 17: South America Energy as a Service Industry Revenue Share (%), by Country 2025 & 2033
- Figure 18: Middle East and Africa Energy as a Service Industry Revenue (Million), by End User 2025 & 2033
- Figure 19: Middle East and Africa Energy as a Service Industry Revenue Share (%), by End User 2025 & 2033
- Figure 20: Middle East and Africa Energy as a Service Industry Revenue (Million), by Country 2025 & 2033
- Figure 21: Middle East and Africa Energy as a Service Industry Revenue Share (%), by Country 2025 & 2033
List of Tables
- Table 1: Global Energy as a Service Industry Revenue Million Forecast, by End User 2020 & 2033
- Table 2: Global Energy as a Service Industry Revenue Million Forecast, by Region 2020 & 2033
- Table 3: Global Energy as a Service Industry Revenue Million Forecast, by End User 2020 & 2033
- Table 4: Global Energy as a Service Industry Revenue Million Forecast, by Country 2020 & 2033
- Table 5: United States Energy as a Service Industry Revenue (Million) Forecast, by Application 2020 & 2033
- Table 6: Canada Energy as a Service Industry Revenue (Million) Forecast, by Application 2020 & 2033
- Table 7: Rest of North America Energy as a Service Industry Revenue (Million) Forecast, by Application 2020 & 2033
- Table 8: Global Energy as a Service Industry Revenue Million Forecast, by End User 2020 & 2033
- Table 9: Global Energy as a Service Industry Revenue Million Forecast, by Country 2020 & 2033
- Table 10: Germany Energy as a Service Industry Revenue (Million) Forecast, by Application 2020 & 2033
- Table 11: France Energy as a Service Industry Revenue (Million) Forecast, by Application 2020 & 2033
- Table 12: United Kingdom Energy as a Service Industry Revenue (Million) Forecast, by Application 2020 & 2033
- Table 13: Rest of Europe Energy as a Service Industry Revenue (Million) Forecast, by Application 2020 & 2033
- Table 14: Global Energy as a Service Industry Revenue Million Forecast, by End User 2020 & 2033
- Table 15: Global Energy as a Service Industry Revenue Million Forecast, by Country 2020 & 2033
- Table 16: China Energy as a Service Industry Revenue (Million) Forecast, by Application 2020 & 2033
- Table 17: India Energy as a Service Industry Revenue (Million) Forecast, by Application 2020 & 2033
- Table 18: Japan Energy as a Service Industry Revenue (Million) Forecast, by Application 2020 & 2033
- Table 19: South Korea Energy as a Service Industry Revenue (Million) Forecast, by Application 2020 & 2033
- Table 20: Rest of Asia Pacific Energy as a Service Industry Revenue (Million) Forecast, by Application 2020 & 2033
- Table 21: Global Energy as a Service Industry Revenue Million Forecast, by End User 2020 & 2033
- Table 22: Global Energy as a Service Industry Revenue Million Forecast, by Country 2020 & 2033
- Table 23: Brazil Energy as a Service Industry Revenue (Million) Forecast, by Application 2020 & 2033
- Table 24: Argentina Energy as a Service Industry Revenue (Million) Forecast, by Application 2020 & 2033
- Table 25: Rest of South America Energy as a Service Industry Revenue (Million) Forecast, by Application 2020 & 2033
- Table 26: Global Energy as a Service Industry Revenue Million Forecast, by End User 2020 & 2033
- Table 27: Global Energy as a Service Industry Revenue Million Forecast, by Country 2020 & 2033
- Table 28: Saudi Arabia Energy as a Service Industry Revenue (Million) Forecast, by Application 2020 & 2033
- Table 29: United Arab Emirates Energy as a Service Industry Revenue (Million) Forecast, by Application 2020 & 2033
- Table 30: South Africa Energy as a Service Industry Revenue (Million) Forecast, by Application 2020 & 2033
- Table 31: Rest of Middle East and Africa Energy as a Service Industry Revenue (Million) Forecast, by Application 2020 & 2033
Frequently Asked Questions
1. What is the projected Compound Annual Growth Rate (CAGR) of the Energy as a Service Industry?
The projected CAGR is approximately 12.48%.
2. Which companies are prominent players in the Energy as a Service Industry?
Key companies in the market include Honeywell International Inc, Bernhard, Johnson Controls International PLC, Engie SA, Enel SpA, Spark Community Investment Co, Schneider Electric SE, Veolia Environnement SA, Electricite de France (EDF) SA.
3. What are the main segments of the Energy as a Service Industry?
The market segments include End User.
4. Can you provide details about the market size?
The market size is estimated to be USD 94.16 Million as of 2022.
5. What are some drivers contributing to market growth?
4.; Growing Demand for Energy As A Service4.; Increasing Adoption of Distributed Energy Generation in Commercial and Industrial Sectors.
6. What are the notable trends driving market growth?
Commercial Segment to Dominate the Market.
7. Are there any restraints impacting market growth?
4.; Lack of Awareness in Developing Economies and High Technological Costs.
8. Can you provide examples of recent developments in the market?
April 2023: Capstone Green Energy Corporation announced that its southern U.S. distributor, Lone Star Power Solutions, contracted with a large West Texas energy company to deliver an additional C800S Signature Series microturbine following Energy-as-a-Service (EaaS) for 3.6 MW contract earlier this year.
9. What pricing options are available for accessing the report?
Pricing options include single-user, multi-user, and enterprise licenses priced at USD 4750, USD 5250, and USD 8750 respectively.
10. Is the market size provided in terms of value or volume?
The market size is provided in terms of value, measured in Million.
11. Are there any specific market keywords associated with the report?
Yes, the market keyword associated with the report is "Energy as a Service Industry," which aids in identifying and referencing the specific market segment covered.
12. How do I determine which pricing option suits my needs best?
The pricing options vary based on user requirements and access needs. Individual users may opt for single-user licenses, while businesses requiring broader access may choose multi-user or enterprise licenses for cost-effective access to the report.
13. Are there any additional resources or data provided in the Energy as a Service Industry report?
While the report offers comprehensive insights, it's advisable to review the specific contents or supplementary materials provided to ascertain if additional resources or data are available.
14. How can I stay updated on further developments or reports in the Energy as a Service Industry?
To stay informed about further developments, trends, and reports in the Energy as a Service Industry, consider subscribing to industry newsletters, following relevant companies and organizations, or regularly checking reputable industry news sources and publications.
Methodology
Step 1 - Identification of Relevant Samples Size from Population Database


Step 2 - Approaches for Defining Global Market Size (Value, Volume* & Price*)

Note*: In applicable scenarios
Step 3 - Data Sources
Primary Research
- Web Analytics
- Survey Reports
- Research Institute
- Latest Research Reports
- Opinion Leaders
Secondary Research
- Annual Reports
- White Paper
- Latest Press Release
- Industry Association
- Paid Database
- Investor Presentations

Step 4 - Data Triangulation
Involves using different sources of information in order to increase the validity of a study
These sources are likely to be stakeholders in a program - participants, other researchers, program staff, other community members, and so on.
Then we put all data in single framework & apply various statistical tools to find out the dynamic on the market.
During the analysis stage, feedback from the stakeholder groups would be compared to determine areas of agreement as well as areas of divergence