

Key Insights
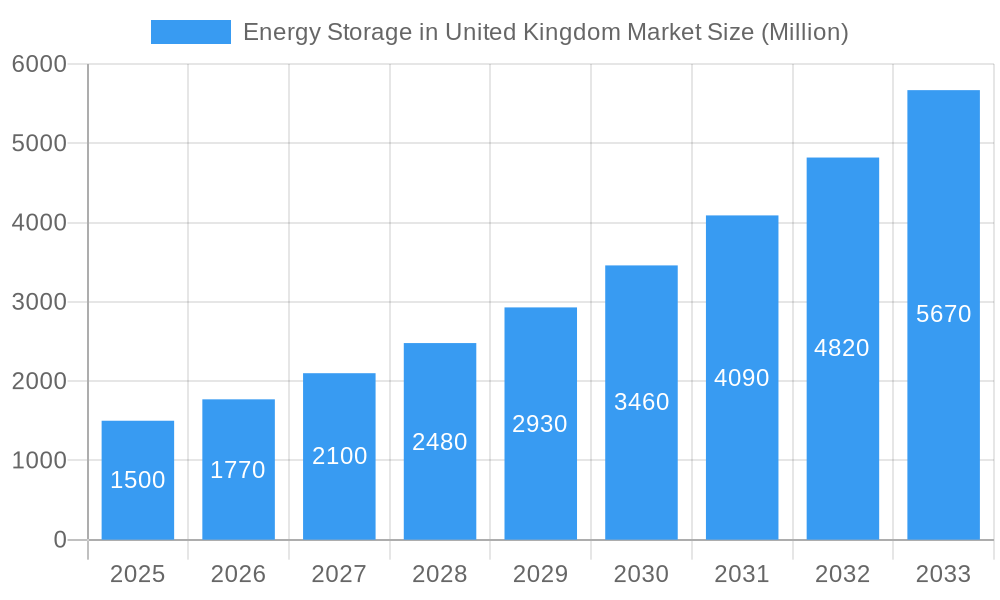
The United Kingdom's energy storage market is projected for substantial expansion, driven by the increasing adoption of renewable energy sources, stringent environmental mandates, and government initiatives for grid enhancement and energy security. The market's robust growth is further supported by rising electricity demand and the inherent intermittency of renewable power generation, underscoring the critical need for effective energy storage solutions to ensure a reliable supply. With a projected global Compound Annual Growth Rate (CAGR) of 19.57%, the UK market is expected to follow a similar upward trajectory. Considering the UK's ambitious renewable energy objectives and its sophisticated energy infrastructure, a CAGR of approximately 18-20% is anticipated for the UK market from 2025 to 2033. This growth is significantly influencing market segments. Battery storage currently leads, offering versatility and scalability for residential and commercial & industrial (C&I) applications. Pumped-storage hydroelectricity (PSH), a well-established technology, remains crucial for large-scale projects. Emerging technologies like compressed air and thermal storage are poised for future growth.
Energy Storage in United Kingdom Market Market Size (In Billion)
Key industry players, including ABB, Samsung SDI, LG Energy Solution, and Tesla, are making significant investments, highlighting the market's appeal. The UK's net-zero emissions target by 2050 necessitates substantial investment in energy storage infrastructure, propelling market growth. While initial capital expenditure for energy storage systems presents a challenge, decreasing battery costs and government support are mitigating this barrier. Future expansion hinges on continuous technological innovation, cost reduction, simplified regulations, and sustained government and private investment to promote broader adoption of energy storage solutions across the UK's diverse sectors.
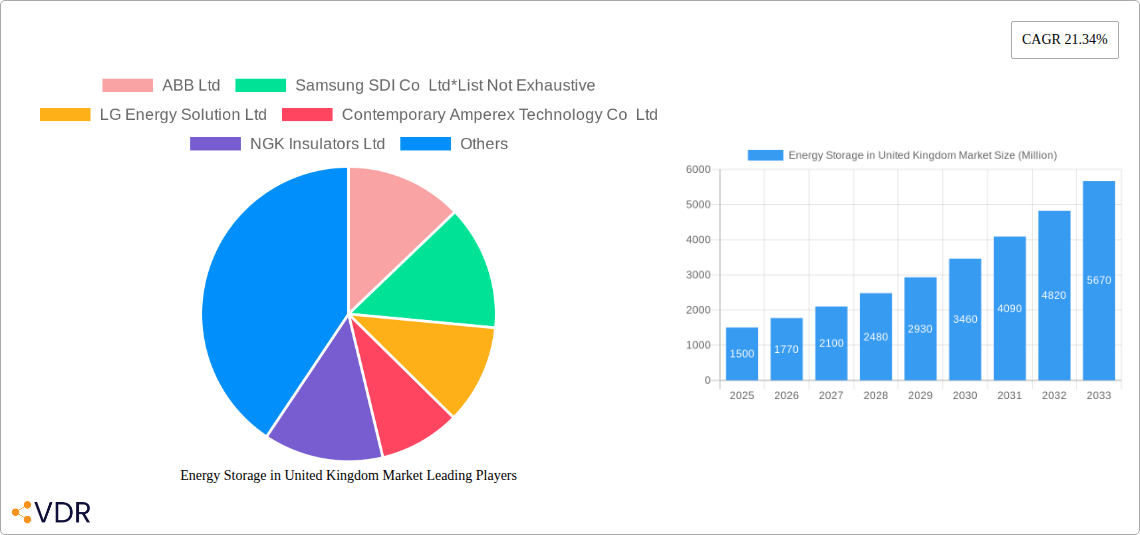
Energy Storage in United Kingdom Market Company Market Share
Energy Storage in the United Kingdom Market: A Comprehensive Report (2019-2033)
This comprehensive report provides an in-depth analysis of the burgeoning energy storage market in the United Kingdom, encompassing market dynamics, growth trends, regional breakdowns, product landscapes, key players, and future outlooks. The report covers the period from 2019 to 2033, with a base year of 2025 and a forecast period from 2025 to 2033. This crucial analysis is tailored for industry professionals, investors, and policymakers seeking a clear understanding of this rapidly evolving sector. The report covers key segments including Batteries, Pumped-storage Hydroelectricity (PSH), and Other Types, with applications spanning Residential, Commercial and Industrial (C&I) sectors.
Energy Storage in United Kingdom Market Market Dynamics & Structure
The UK energy storage market is characterized by increasing concentration amongst key players, significant technological innovation, and a rapidly evolving regulatory landscape. The market is witnessing a surge in mergers and acquisitions (M&A) activity, driven by the need for scale and expertise. Competition is intensifying with the emergence of new technologies and entrants, alongside established players. The shift towards renewable energy sources is a primary driver, necessitating efficient energy storage solutions to address intermittency challenges.
- Market Concentration: The market share of the top five players is estimated at xx% in 2025, indicating a moderately concentrated market. However, fragmentation is expected to reduce as M&A activity increases.
- Technological Innovation: Significant advancements in battery technology, particularly lithium-ion, are driving cost reductions and improved performance. Innovation in PSH technology also contributes to the market's growth.
- Regulatory Framework: Government policies supporting renewable energy and grid stability are strongly influencing market growth. Subsidies and incentives promote the adoption of energy storage systems.
- Competitive Substitutes: While energy storage solutions are unique, competition comes from alternative grid management strategies and potential future technologies.
- End-User Demographics: The C&I sector dominates the market share, with residential adoption gradually increasing. Large-scale projects are contributing significantly to the market volume.
- M&A Trends: The number of M&A deals in the UK energy storage market is estimated to be xx deals in 2024, reflecting growing interest from both domestic and international players seeking to consolidate their presence. This activity indicates strong industry confidence and a drive for market consolidation. The main reasons for M&A activity include securing technology, expanding market share, and gaining access to new projects.
Energy Storage in United Kingdom Market Growth Trends & Insights
The UK energy storage market is experiencing robust growth, fueled by the government's commitment to decarbonization, increasing renewable energy integration, and rising electricity prices. The market size, currently estimated at xx Million in 2025, is projected to reach xx Million by 2033, exhibiting a CAGR of xx% during the forecast period. This growth is driven by factors such as the increasing adoption of renewable energy sources, the need to enhance grid stability, and the falling costs of energy storage technologies. Consumer behavior is shifting towards more sustainable energy solutions, with businesses and households actively seeking ways to reduce their carbon footprint. Technological advancements and government initiatives are further accelerating market penetration.
Dominant Regions, Countries, or Segments in Energy Storage in United Kingdom Market
While the market is developing across the UK, specific regions and segments show more significant growth.
- Type: The Battery segment currently dominates the market, accounting for approximately xx% of the total market in 2025, owing to its versatility and adaptability to various applications. PSH systems retain a substantial share, particularly in larger-scale projects. Other Types contribute a smaller percentage and are expected to gain traction as technologies mature.
- Application: The C&I sector leads the application segment, due to the need for grid stabilization and peak demand management, representing roughly xx% of the market in 2025. Residential adoption is growing gradually but faces challenges related to cost and space constraints.
- Regional Dominance: England and Scotland represent the largest markets. Growth in these regions is propelled by strong government support, significant renewable energy generation capacities, and favourable grid infrastructure. Wales and Northern Ireland show promising growth potential, albeit on a smaller scale.
Key Drivers for Growth:
Government policies supporting renewable energy and grid modernization. Decreasing costs of battery technology and increasing efficiency. *Growth of renewable energy installations (solar, wind). *Concerns around grid stability and resilience.*
Energy Storage in United Kingdom Market Product Landscape
The UK energy storage market offers a diverse range of products, with a focus on enhancing efficiency and cost-effectiveness. Lithium-ion batteries dominate, offering high energy density and fast charging capabilities. Advances in battery management systems (BMS) and thermal management solutions are optimizing performance and lifespan. PSH systems remain a significant player, particularly for large-scale applications. The market is witnessing the emergence of hybrid solutions, combining different storage technologies to maximize efficiency. Product differentiation focuses on energy density, power output, lifespan, safety features, and integration capabilities.
Key Drivers, Barriers & Challenges in Energy Storage in United Kingdom Market
Key Drivers:
- The UK's commitment to net-zero emissions targets is a primary driver.
- The increasing penetration of intermittent renewable energy sources necessitates robust energy storage solutions.
- Government incentives and regulations support energy storage adoption.
Key Challenges:
- High initial investment costs remain a barrier for wider adoption, particularly in the residential sector. The upfront cost of energy storage systems can be significant, hindering widespread deployment.
- The availability of skilled labor to install and maintain energy storage systems remains a concern. Demand for expertise outstrips the supply. This factor affects both the speed of deployment and maintenance effectiveness.
- Grid infrastructure limitations in some areas could constrain the integration of large-scale energy storage projects. Upgrading existing grids to accommodate significant additional storage capacity may take considerable time and resources.
Emerging Opportunities in Energy Storage in United Kingdom Market
- Growth of the residential market: Falling battery costs and innovative financing models could significantly boost residential adoption.
- Integration with smart grids: Advanced energy management systems and intelligent grid integration will improve efficiency and reliability.
- Development of second-life battery applications: Reusing batteries from electric vehicles in stationary energy storage systems will reduce environmental impact and cost.
Growth Accelerators in the Energy Storage in United Kingdom Market Industry
Several factors will accelerate growth. Technological innovation continuously drives down costs and improves performance. Strategic partnerships between energy providers, technology companies, and policymakers are crucial for infrastructure development and market expansion. Government policies, including tax incentives and regulations, will continue to play a vital role in stimulating market growth. The increasing need for grid stability and resilience, given the growing renewable energy penetration, is also a strong driver.
Key Players Shaping the Energy Storage in United Kingdom Market Market
- ABB Ltd
- Samsung SDI Co Ltd
- LG Energy Solution Ltd
- Contemporary Amperex Technology Co Ltd
- NGK Insulators Ltd
- Electricite de France SA (EDF)
- Wartsila Oyj Abp
- Tesla Inc
- Siemens Energy AG
- General Electric Company
Notable Milestones in Energy Storage in United Kingdom Market Sector
- June 2022: Quinbrook Infrastructure Partners acquires development rights for a 230 MW/460 MWh battery energy storage project in Wales, signifying large-scale investment in the sector.
- January 2022: Voltalia commissions a 32 MW/32 MWh battery energy storage project near Bristol, highlighting the growth of smaller-scale projects.
In-Depth Energy Storage in United Kingdom Market Market Outlook
The UK energy storage market holds immense potential, with continued growth driven by decarbonization goals, increasing renewable energy integration, and technological advancements. Strategic investments in grid infrastructure, coupled with supportive government policies, will create significant opportunities for market expansion. The focus on grid-scale projects, coupled with the growing penetration of residential and C&I applications, positions the UK as a leader in the European energy storage landscape. This market presents attractive investment prospects and opportunities for innovation within the next decade.
Energy Storage in United Kingdom Market Segmentation
-
1. Type
- 1.1. Batteries
- 1.2. Pumped-storage Hydroelectricity (PSH)
- 1.3. Other Types
-
2. Application
- 2.1. Residential
- 2.2. Commercial and Industrial (C&I)
Energy Storage in United Kingdom Market Segmentation By Geography
-
1. North America
- 1.1. United States
- 1.2. Canada
- 1.3. Mexico
-
2. South America
- 2.1. Brazil
- 2.2. Argentina
- 2.3. Rest of South America
-
3. Europe
- 3.1. United Kingdom
- 3.2. Germany
- 3.3. France
- 3.4. Italy
- 3.5. Spain
- 3.6. Russia
- 3.7. Benelux
- 3.8. Nordics
- 3.9. Rest of Europe
-
4. Middle East & Africa
- 4.1. Turkey
- 4.2. Israel
- 4.3. GCC
- 4.4. North Africa
- 4.5. South Africa
- 4.6. Rest of Middle East & Africa
-
5. Asia Pacific
- 5.1. China
- 5.2. India
- 5.3. Japan
- 5.4. South Korea
- 5.5. ASEAN
- 5.6. Oceania
- 5.7. Rest of Asia Pacific
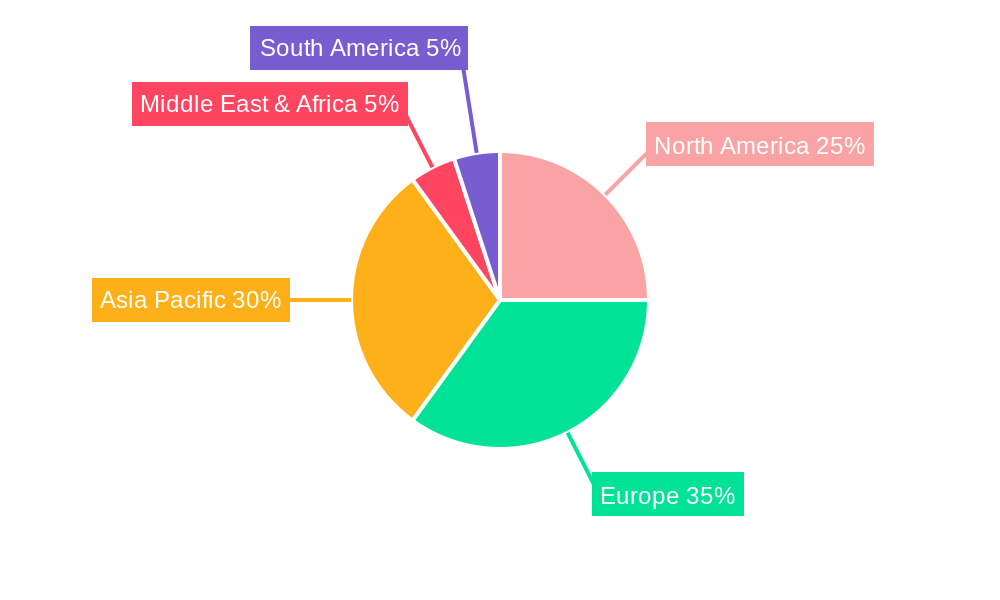
Energy Storage in United Kingdom Market Regional Market Share
Geographic Coverage of Energy Storage in United Kingdom Market
Energy Storage in United Kingdom Market REPORT HIGHLIGHTS
| Aspects | Details |
|---|---|
| Study Period | 2020-2034 |
| Base Year | 2025 |
| Estimated Year | 2026 |
| Forecast Period | 2026-2034 |
| Historical Period | 2020-2025 |
| Growth Rate | CAGR of 19.57% from 2020-2034 |
| Segmentation |
|
Table of Contents
- 1. Introduction
- 1.1. Research Scope
- 1.2. Market Segmentation
- 1.3. Research Objective
- 1.4. Definitions and Assumptions
- 2. Executive Summary
- 2.1. Market Snapshot
- 3. Market Dynamics
- 3.1. Market Drivers
- 3.2. Market Restrains
- 3.3. Market Trends
- 3.4. Market Opportunities
- 4. Market Factor Analysis
- 4.1. Porters Five Forces
- 4.1.1. Bargaining Power of Suppliers
- 4.1.2. Bargaining Power of Buyers
- 4.1.3. Threat of New Entrants
- 4.1.4. Threat of Substitutes
- 4.1.5. Competitive Rivalry
- 4.2. PESTEL analysis
- 4.3. BCG Analysis
- 4.3.1. Stars (High Growth, High Market Share)
- 4.3.2. Cash Cows (Low Growth, High Market Share)
- 4.3.3. Question Mark (High Growth, Low Market Share)
- 4.3.4. Dogs (Low Growth, Low Market Share)
- 4.4. Ansoff Matrix Analysis
- 4.5. Supply Chain Analysis
- 4.6. Regulatory Landscape
- 4.7. Current Market Potential and Opportunity Assessment (TAM–SAM–SOM Framework)
- 4.8. VDR Analyst Note
- 4.1. Porters Five Forces
- 5. Market Analysis, Insights and Forecast 2021-2033
- 5.1. Market Analysis, Insights and Forecast - by Type
- 5.1.1. Batteries
- 5.1.2. Pumped-storage Hydroelectricity (PSH)
- 5.1.3. Other Types
- 5.2. Market Analysis, Insights and Forecast - by Application
- 5.2.1. Residential
- 5.2.2. Commercial and Industrial (C&I)
- 5.3. Market Analysis, Insights and Forecast - by Region
- 5.3.1. North America
- 5.3.2. South America
- 5.3.3. Europe
- 5.3.4. Middle East & Africa
- 5.3.5. Asia Pacific
- 5.1. Market Analysis, Insights and Forecast - by Type
- 6. Global Energy Storage in United Kingdom Market Analysis, Insights and Forecast, 2021-2033
- 6.1. Market Analysis, Insights and Forecast - by Type
- 6.1.1. Batteries
- 6.1.2. Pumped-storage Hydroelectricity (PSH)
- 6.1.3. Other Types
- 6.2. Market Analysis, Insights and Forecast - by Application
- 6.2.1. Residential
- 6.2.2. Commercial and Industrial (C&I)
- 6.1. Market Analysis, Insights and Forecast - by Type
- 7. North America Energy Storage in United Kingdom Market Analysis, Insights and Forecast, 2021-2033
- 7.1. Market Analysis, Insights and Forecast - by Type
- 7.1.1. Batteries
- 7.1.2. Pumped-storage Hydroelectricity (PSH)
- 7.1.3. Other Types
- 7.2. Market Analysis, Insights and Forecast - by Application
- 7.2.1. Residential
- 7.2.2. Commercial and Industrial (C&I)
- 7.1. Market Analysis, Insights and Forecast - by Type
- 8. South America Energy Storage in United Kingdom Market Analysis, Insights and Forecast, 2021-2033
- 8.1. Market Analysis, Insights and Forecast - by Type
- 8.1.1. Batteries
- 8.1.2. Pumped-storage Hydroelectricity (PSH)
- 8.1.3. Other Types
- 8.2. Market Analysis, Insights and Forecast - by Application
- 8.2.1. Residential
- 8.2.2. Commercial and Industrial (C&I)
- 8.1. Market Analysis, Insights and Forecast - by Type
- 9. Europe Energy Storage in United Kingdom Market Analysis, Insights and Forecast, 2021-2033
- 9.1. Market Analysis, Insights and Forecast - by Type
- 9.1.1. Batteries
- 9.1.2. Pumped-storage Hydroelectricity (PSH)
- 9.1.3. Other Types
- 9.2. Market Analysis, Insights and Forecast - by Application
- 9.2.1. Residential
- 9.2.2. Commercial and Industrial (C&I)
- 9.1. Market Analysis, Insights and Forecast - by Type
- 10. Middle East & Africa Energy Storage in United Kingdom Market Analysis, Insights and Forecast, 2021-2033
- 10.1. Market Analysis, Insights and Forecast - by Type
- 10.1.1. Batteries
- 10.1.2. Pumped-storage Hydroelectricity (PSH)
- 10.1.3. Other Types
- 10.2. Market Analysis, Insights and Forecast - by Application
- 10.2.1. Residential
- 10.2.2. Commercial and Industrial (C&I)
- 10.1. Market Analysis, Insights and Forecast - by Type
- 11. Asia Pacific Energy Storage in United Kingdom Market Analysis, Insights and Forecast, 2021-2033
- 11.1. Market Analysis, Insights and Forecast - by Type
- 11.1.1. Batteries
- 11.1.2. Pumped-storage Hydroelectricity (PSH)
- 11.1.3. Other Types
- 11.2. Market Analysis, Insights and Forecast - by Application
- 11.2.1. Residential
- 11.2.2. Commercial and Industrial (C&I)
- 11.1. Market Analysis, Insights and Forecast - by Type
- 12. Competitive Analysis
- 12.1. Company Profiles
- 12.1.1 ABB Ltd
- 12.1.1.1. Company Overview
- 12.1.1.2. Products
- 12.1.1.3. Company Financials
- 12.1.1.4. SWOT Analysis
- 12.1.2 Samsung SDI Co Ltd*List Not Exhaustive
- 12.1.2.1. Company Overview
- 12.1.2.2. Products
- 12.1.2.3. Company Financials
- 12.1.2.4. SWOT Analysis
- 12.1.3 LG Energy Solution Ltd
- 12.1.3.1. Company Overview
- 12.1.3.2. Products
- 12.1.3.3. Company Financials
- 12.1.3.4. SWOT Analysis
- 12.1.4 Contemporary Amperex Technology Co Ltd
- 12.1.4.1. Company Overview
- 12.1.4.2. Products
- 12.1.4.3. Company Financials
- 12.1.4.4. SWOT Analysis
- 12.1.5 NGK Insulators Ltd
- 12.1.5.1. Company Overview
- 12.1.5.2. Products
- 12.1.5.3. Company Financials
- 12.1.5.4. SWOT Analysis
- 12.1.6 Electricite de France SA (EDF)
- 12.1.6.1. Company Overview
- 12.1.6.2. Products
- 12.1.6.3. Company Financials
- 12.1.6.4. SWOT Analysis
- 12.1.7 Wartsila Oyj Abp
- 12.1.7.1. Company Overview
- 12.1.7.2. Products
- 12.1.7.3. Company Financials
- 12.1.7.4. SWOT Analysis
- 12.1.8 Tesla Inc
- 12.1.8.1. Company Overview
- 12.1.8.2. Products
- 12.1.8.3. Company Financials
- 12.1.8.4. SWOT Analysis
- 12.1.9 Siemens Energy AG
- 12.1.9.1. Company Overview
- 12.1.9.2. Products
- 12.1.9.3. Company Financials
- 12.1.9.4. SWOT Analysis
- 12.1.10 General Electric Company
- 12.1.10.1. Company Overview
- 12.1.10.2. Products
- 12.1.10.3. Company Financials
- 12.1.10.4. SWOT Analysis
- 12.1.1 ABB Ltd
- 12.2. Market Entropy
- 12.2.1 Company's Key Areas Served
- 12.2.2 Recent Developments
- 12.3. Company Market Share Analysis 2025
- 12.3.1 Top 5 Companies Market Share Analysis
- 12.3.2 Top 3 Companies Market Share Analysis
- 12.4. List of Potential Customers
- 13. Research Methodology
List of Figures
- Figure 1: Global Energy Storage in United Kingdom Market Revenue Breakdown (million, %) by Region 2025 & 2033
- Figure 2: Global Energy Storage in United Kingdom Market Volume Breakdown (megawatt, %) by Region 2025 & 2033
- Figure 3: North America Energy Storage in United Kingdom Market Revenue (million), by Type 2025 & 2033
- Figure 4: North America Energy Storage in United Kingdom Market Volume (megawatt), by Type 2025 & 2033
- Figure 5: North America Energy Storage in United Kingdom Market Revenue Share (%), by Type 2025 & 2033
- Figure 6: North America Energy Storage in United Kingdom Market Volume Share (%), by Type 2025 & 2033
- Figure 7: North America Energy Storage in United Kingdom Market Revenue (million), by Application 2025 & 2033
- Figure 8: North America Energy Storage in United Kingdom Market Volume (megawatt), by Application 2025 & 2033
- Figure 9: North America Energy Storage in United Kingdom Market Revenue Share (%), by Application 2025 & 2033
- Figure 10: North America Energy Storage in United Kingdom Market Volume Share (%), by Application 2025 & 2033
- Figure 11: North America Energy Storage in United Kingdom Market Revenue (million), by Country 2025 & 2033
- Figure 12: North America Energy Storage in United Kingdom Market Volume (megawatt), by Country 2025 & 2033
- Figure 13: North America Energy Storage in United Kingdom Market Revenue Share (%), by Country 2025 & 2033
- Figure 14: North America Energy Storage in United Kingdom Market Volume Share (%), by Country 2025 & 2033
- Figure 15: South America Energy Storage in United Kingdom Market Revenue (million), by Type 2025 & 2033
- Figure 16: South America Energy Storage in United Kingdom Market Volume (megawatt), by Type 2025 & 2033
- Figure 17: South America Energy Storage in United Kingdom Market Revenue Share (%), by Type 2025 & 2033
- Figure 18: South America Energy Storage in United Kingdom Market Volume Share (%), by Type 2025 & 2033
- Figure 19: South America Energy Storage in United Kingdom Market Revenue (million), by Application 2025 & 2033
- Figure 20: South America Energy Storage in United Kingdom Market Volume (megawatt), by Application 2025 & 2033
- Figure 21: South America Energy Storage in United Kingdom Market Revenue Share (%), by Application 2025 & 2033
- Figure 22: South America Energy Storage in United Kingdom Market Volume Share (%), by Application 2025 & 2033
- Figure 23: South America Energy Storage in United Kingdom Market Revenue (million), by Country 2025 & 2033
- Figure 24: South America Energy Storage in United Kingdom Market Volume (megawatt), by Country 2025 & 2033
- Figure 25: South America Energy Storage in United Kingdom Market Revenue Share (%), by Country 2025 & 2033
- Figure 26: South America Energy Storage in United Kingdom Market Volume Share (%), by Country 2025 & 2033
- Figure 27: Europe Energy Storage in United Kingdom Market Revenue (million), by Type 2025 & 2033
- Figure 28: Europe Energy Storage in United Kingdom Market Volume (megawatt), by Type 2025 & 2033
- Figure 29: Europe Energy Storage in United Kingdom Market Revenue Share (%), by Type 2025 & 2033
- Figure 30: Europe Energy Storage in United Kingdom Market Volume Share (%), by Type 2025 & 2033
- Figure 31: Europe Energy Storage in United Kingdom Market Revenue (million), by Application 2025 & 2033
- Figure 32: Europe Energy Storage in United Kingdom Market Volume (megawatt), by Application 2025 & 2033
- Figure 33: Europe Energy Storage in United Kingdom Market Revenue Share (%), by Application 2025 & 2033
- Figure 34: Europe Energy Storage in United Kingdom Market Volume Share (%), by Application 2025 & 2033
- Figure 35: Europe Energy Storage in United Kingdom Market Revenue (million), by Country 2025 & 2033
- Figure 36: Europe Energy Storage in United Kingdom Market Volume (megawatt), by Country 2025 & 2033
- Figure 37: Europe Energy Storage in United Kingdom Market Revenue Share (%), by Country 2025 & 2033
- Figure 38: Europe Energy Storage in United Kingdom Market Volume Share (%), by Country 2025 & 2033
- Figure 39: Middle East & Africa Energy Storage in United Kingdom Market Revenue (million), by Type 2025 & 2033
- Figure 40: Middle East & Africa Energy Storage in United Kingdom Market Volume (megawatt), by Type 2025 & 2033
- Figure 41: Middle East & Africa Energy Storage in United Kingdom Market Revenue Share (%), by Type 2025 & 2033
- Figure 42: Middle East & Africa Energy Storage in United Kingdom Market Volume Share (%), by Type 2025 & 2033
- Figure 43: Middle East & Africa Energy Storage in United Kingdom Market Revenue (million), by Application 2025 & 2033
- Figure 44: Middle East & Africa Energy Storage in United Kingdom Market Volume (megawatt), by Application 2025 & 2033
- Figure 45: Middle East & Africa Energy Storage in United Kingdom Market Revenue Share (%), by Application 2025 & 2033
- Figure 46: Middle East & Africa Energy Storage in United Kingdom Market Volume Share (%), by Application 2025 & 2033
- Figure 47: Middle East & Africa Energy Storage in United Kingdom Market Revenue (million), by Country 2025 & 2033
- Figure 48: Middle East & Africa Energy Storage in United Kingdom Market Volume (megawatt), by Country 2025 & 2033
- Figure 49: Middle East & Africa Energy Storage in United Kingdom Market Revenue Share (%), by Country 2025 & 2033
- Figure 50: Middle East & Africa Energy Storage in United Kingdom Market Volume Share (%), by Country 2025 & 2033
- Figure 51: Asia Pacific Energy Storage in United Kingdom Market Revenue (million), by Type 2025 & 2033
- Figure 52: Asia Pacific Energy Storage in United Kingdom Market Volume (megawatt), by Type 2025 & 2033
- Figure 53: Asia Pacific Energy Storage in United Kingdom Market Revenue Share (%), by Type 2025 & 2033
- Figure 54: Asia Pacific Energy Storage in United Kingdom Market Volume Share (%), by Type 2025 & 2033
- Figure 55: Asia Pacific Energy Storage in United Kingdom Market Revenue (million), by Application 2025 & 2033
- Figure 56: Asia Pacific Energy Storage in United Kingdom Market Volume (megawatt), by Application 2025 & 2033
- Figure 57: Asia Pacific Energy Storage in United Kingdom Market Revenue Share (%), by Application 2025 & 2033
- Figure 58: Asia Pacific Energy Storage in United Kingdom Market Volume Share (%), by Application 2025 & 2033
- Figure 59: Asia Pacific Energy Storage in United Kingdom Market Revenue (million), by Country 2025 & 2033
- Figure 60: Asia Pacific Energy Storage in United Kingdom Market Volume (megawatt), by Country 2025 & 2033
- Figure 61: Asia Pacific Energy Storage in United Kingdom Market Revenue Share (%), by Country 2025 & 2033
- Figure 62: Asia Pacific Energy Storage in United Kingdom Market Volume Share (%), by Country 2025 & 2033
List of Tables
- Table 1: Global Energy Storage in United Kingdom Market Revenue million Forecast, by Type 2020 & 2033
- Table 2: Global Energy Storage in United Kingdom Market Volume megawatt Forecast, by Type 2020 & 2033
- Table 3: Global Energy Storage in United Kingdom Market Revenue million Forecast, by Application 2020 & 2033
- Table 4: Global Energy Storage in United Kingdom Market Volume megawatt Forecast, by Application 2020 & 2033
- Table 5: Global Energy Storage in United Kingdom Market Revenue million Forecast, by Region 2020 & 2033
- Table 6: Global Energy Storage in United Kingdom Market Volume megawatt Forecast, by Region 2020 & 2033
- Table 7: Global Energy Storage in United Kingdom Market Revenue million Forecast, by Type 2020 & 2033
- Table 8: Global Energy Storage in United Kingdom Market Volume megawatt Forecast, by Type 2020 & 2033
- Table 9: Global Energy Storage in United Kingdom Market Revenue million Forecast, by Application 2020 & 2033
- Table 10: Global Energy Storage in United Kingdom Market Volume megawatt Forecast, by Application 2020 & 2033
- Table 11: Global Energy Storage in United Kingdom Market Revenue million Forecast, by Country 2020 & 2033
- Table 12: Global Energy Storage in United Kingdom Market Volume megawatt Forecast, by Country 2020 & 2033
- Table 13: United States Energy Storage in United Kingdom Market Revenue (million) Forecast, by Application 2020 & 2033
- Table 14: United States Energy Storage in United Kingdom Market Volume (megawatt) Forecast, by Application 2020 & 2033
- Table 15: Canada Energy Storage in United Kingdom Market Revenue (million) Forecast, by Application 2020 & 2033
- Table 16: Canada Energy Storage in United Kingdom Market Volume (megawatt) Forecast, by Application 2020 & 2033
- Table 17: Mexico Energy Storage in United Kingdom Market Revenue (million) Forecast, by Application 2020 & 2033
- Table 18: Mexico Energy Storage in United Kingdom Market Volume (megawatt) Forecast, by Application 2020 & 2033
- Table 19: Global Energy Storage in United Kingdom Market Revenue million Forecast, by Type 2020 & 2033
- Table 20: Global Energy Storage in United Kingdom Market Volume megawatt Forecast, by Type 2020 & 2033
- Table 21: Global Energy Storage in United Kingdom Market Revenue million Forecast, by Application 2020 & 2033
- Table 22: Global Energy Storage in United Kingdom Market Volume megawatt Forecast, by Application 2020 & 2033
- Table 23: Global Energy Storage in United Kingdom Market Revenue million Forecast, by Country 2020 & 2033
- Table 24: Global Energy Storage in United Kingdom Market Volume megawatt Forecast, by Country 2020 & 2033
- Table 25: Brazil Energy Storage in United Kingdom Market Revenue (million) Forecast, by Application 2020 & 2033
- Table 26: Brazil Energy Storage in United Kingdom Market Volume (megawatt) Forecast, by Application 2020 & 2033
- Table 27: Argentina Energy Storage in United Kingdom Market Revenue (million) Forecast, by Application 2020 & 2033
- Table 28: Argentina Energy Storage in United Kingdom Market Volume (megawatt) Forecast, by Application 2020 & 2033
- Table 29: Rest of South America Energy Storage in United Kingdom Market Revenue (million) Forecast, by Application 2020 & 2033
- Table 30: Rest of South America Energy Storage in United Kingdom Market Volume (megawatt) Forecast, by Application 2020 & 2033
- Table 31: Global Energy Storage in United Kingdom Market Revenue million Forecast, by Type 2020 & 2033
- Table 32: Global Energy Storage in United Kingdom Market Volume megawatt Forecast, by Type 2020 & 2033
- Table 33: Global Energy Storage in United Kingdom Market Revenue million Forecast, by Application 2020 & 2033
- Table 34: Global Energy Storage in United Kingdom Market Volume megawatt Forecast, by Application 2020 & 2033
- Table 35: Global Energy Storage in United Kingdom Market Revenue million Forecast, by Country 2020 & 2033
- Table 36: Global Energy Storage in United Kingdom Market Volume megawatt Forecast, by Country 2020 & 2033
- Table 37: United Kingdom Energy Storage in United Kingdom Market Revenue (million) Forecast, by Application 2020 & 2033
- Table 38: United Kingdom Energy Storage in United Kingdom Market Volume (megawatt) Forecast, by Application 2020 & 2033
- Table 39: Germany Energy Storage in United Kingdom Market Revenue (million) Forecast, by Application 2020 & 2033
- Table 40: Germany Energy Storage in United Kingdom Market Volume (megawatt) Forecast, by Application 2020 & 2033
- Table 41: France Energy Storage in United Kingdom Market Revenue (million) Forecast, by Application 2020 & 2033
- Table 42: France Energy Storage in United Kingdom Market Volume (megawatt) Forecast, by Application 2020 & 2033
- Table 43: Italy Energy Storage in United Kingdom Market Revenue (million) Forecast, by Application 2020 & 2033
- Table 44: Italy Energy Storage in United Kingdom Market Volume (megawatt) Forecast, by Application 2020 & 2033
- Table 45: Spain Energy Storage in United Kingdom Market Revenue (million) Forecast, by Application 2020 & 2033
- Table 46: Spain Energy Storage in United Kingdom Market Volume (megawatt) Forecast, by Application 2020 & 2033
- Table 47: Russia Energy Storage in United Kingdom Market Revenue (million) Forecast, by Application 2020 & 2033
- Table 48: Russia Energy Storage in United Kingdom Market Volume (megawatt) Forecast, by Application 2020 & 2033
- Table 49: Benelux Energy Storage in United Kingdom Market Revenue (million) Forecast, by Application 2020 & 2033
- Table 50: Benelux Energy Storage in United Kingdom Market Volume (megawatt) Forecast, by Application 2020 & 2033
- Table 51: Nordics Energy Storage in United Kingdom Market Revenue (million) Forecast, by Application 2020 & 2033
- Table 52: Nordics Energy Storage in United Kingdom Market Volume (megawatt) Forecast, by Application 2020 & 2033
- Table 53: Rest of Europe Energy Storage in United Kingdom Market Revenue (million) Forecast, by Application 2020 & 2033
- Table 54: Rest of Europe Energy Storage in United Kingdom Market Volume (megawatt) Forecast, by Application 2020 & 2033
- Table 55: Global Energy Storage in United Kingdom Market Revenue million Forecast, by Type 2020 & 2033
- Table 56: Global Energy Storage in United Kingdom Market Volume megawatt Forecast, by Type 2020 & 2033
- Table 57: Global Energy Storage in United Kingdom Market Revenue million Forecast, by Application 2020 & 2033
- Table 58: Global Energy Storage in United Kingdom Market Volume megawatt Forecast, by Application 2020 & 2033
- Table 59: Global Energy Storage in United Kingdom Market Revenue million Forecast, by Country 2020 & 2033
- Table 60: Global Energy Storage in United Kingdom Market Volume megawatt Forecast, by Country 2020 & 2033
- Table 61: Turkey Energy Storage in United Kingdom Market Revenue (million) Forecast, by Application 2020 & 2033
- Table 62: Turkey Energy Storage in United Kingdom Market Volume (megawatt) Forecast, by Application 2020 & 2033
- Table 63: Israel Energy Storage in United Kingdom Market Revenue (million) Forecast, by Application 2020 & 2033
- Table 64: Israel Energy Storage in United Kingdom Market Volume (megawatt) Forecast, by Application 2020 & 2033
- Table 65: GCC Energy Storage in United Kingdom Market Revenue (million) Forecast, by Application 2020 & 2033
- Table 66: GCC Energy Storage in United Kingdom Market Volume (megawatt) Forecast, by Application 2020 & 2033
- Table 67: North Africa Energy Storage in United Kingdom Market Revenue (million) Forecast, by Application 2020 & 2033
- Table 68: North Africa Energy Storage in United Kingdom Market Volume (megawatt) Forecast, by Application 2020 & 2033
- Table 69: South Africa Energy Storage in United Kingdom Market Revenue (million) Forecast, by Application 2020 & 2033
- Table 70: South Africa Energy Storage in United Kingdom Market Volume (megawatt) Forecast, by Application 2020 & 2033
- Table 71: Rest of Middle East & Africa Energy Storage in United Kingdom Market Revenue (million) Forecast, by Application 2020 & 2033
- Table 72: Rest of Middle East & Africa Energy Storage in United Kingdom Market Volume (megawatt) Forecast, by Application 2020 & 2033
- Table 73: Global Energy Storage in United Kingdom Market Revenue million Forecast, by Type 2020 & 2033
- Table 74: Global Energy Storage in United Kingdom Market Volume megawatt Forecast, by Type 2020 & 2033
- Table 75: Global Energy Storage in United Kingdom Market Revenue million Forecast, by Application 2020 & 2033
- Table 76: Global Energy Storage in United Kingdom Market Volume megawatt Forecast, by Application 2020 & 2033
- Table 77: Global Energy Storage in United Kingdom Market Revenue million Forecast, by Country 2020 & 2033
- Table 78: Global Energy Storage in United Kingdom Market Volume megawatt Forecast, by Country 2020 & 2033
- Table 79: China Energy Storage in United Kingdom Market Revenue (million) Forecast, by Application 2020 & 2033
- Table 80: China Energy Storage in United Kingdom Market Volume (megawatt) Forecast, by Application 2020 & 2033
- Table 81: India Energy Storage in United Kingdom Market Revenue (million) Forecast, by Application 2020 & 2033
- Table 82: India Energy Storage in United Kingdom Market Volume (megawatt) Forecast, by Application 2020 & 2033
- Table 83: Japan Energy Storage in United Kingdom Market Revenue (million) Forecast, by Application 2020 & 2033
- Table 84: Japan Energy Storage in United Kingdom Market Volume (megawatt) Forecast, by Application 2020 & 2033
- Table 85: South Korea Energy Storage in United Kingdom Market Revenue (million) Forecast, by Application 2020 & 2033
- Table 86: South Korea Energy Storage in United Kingdom Market Volume (megawatt) Forecast, by Application 2020 & 2033
- Table 87: ASEAN Energy Storage in United Kingdom Market Revenue (million) Forecast, by Application 2020 & 2033
- Table 88: ASEAN Energy Storage in United Kingdom Market Volume (megawatt) Forecast, by Application 2020 & 2033
- Table 89: Oceania Energy Storage in United Kingdom Market Revenue (million) Forecast, by Application 2020 & 2033
- Table 90: Oceania Energy Storage in United Kingdom Market Volume (megawatt) Forecast, by Application 2020 & 2033
- Table 91: Rest of Asia Pacific Energy Storage in United Kingdom Market Revenue (million) Forecast, by Application 2020 & 2033
- Table 92: Rest of Asia Pacific Energy Storage in United Kingdom Market Volume (megawatt) Forecast, by Application 2020 & 2033
Frequently Asked Questions
1. What is the projected Compound Annual Growth Rate (CAGR) of the Energy Storage in United Kingdom Market?
The projected CAGR is approximately 19.57%.
2. Which companies are prominent players in the Energy Storage in United Kingdom Market?
Key companies in the market include ABB Ltd, Samsung SDI Co Ltd*List Not Exhaustive, LG Energy Solution Ltd, Contemporary Amperex Technology Co Ltd, NGK Insulators Ltd, Electricite de France SA (EDF), Wartsila Oyj Abp, Tesla Inc, Siemens Energy AG, General Electric Company.
3. What are the main segments of the Energy Storage in United Kingdom Market?
The market segments include Type, Application.
4. Can you provide details about the market size?
The market size is estimated to be USD 6872 million as of 2022.
5. What are some drivers contributing to market growth?
4.; The High Amount of Waste Generation in the Country4.; The growing Focus on Non-Fossil Fuel Sources.
6. What are the notable trends driving market growth?
Battery Energy Storage Systems Expected to Witness Significant Demand.
7. Are there any restraints impacting market growth?
4.; The Recycling Rate of Waste in Germany.
8. Can you provide examples of recent developments in the market?
Jun 2022: Quinbrook Infrastructure Partners acquired exclusive project development rights for the 230 MW/460 MWh battery energy storage project in Wales, United Kingdom. The battery energy storage system will be at the former Uskmouth coal-fired power station in South Wales, which closed in 2015. The project development rights were acquired from Simec Atlantis Energy, and the BESS is expected to be commissioned by the end of 2024.
9. What pricing options are available for accessing the report?
Pricing options include single-user, multi-user, and enterprise licenses priced at USD 3800, USD 4500, and USD 5800 respectively.
10. Is the market size provided in terms of value or volume?
The market size is provided in terms of value, measured in million and volume, measured in megawatt.
11. Are there any specific market keywords associated with the report?
Yes, the market keyword associated with the report is "Energy Storage in United Kingdom Market," which aids in identifying and referencing the specific market segment covered.
12. How do I determine which pricing option suits my needs best?
The pricing options vary based on user requirements and access needs. Individual users may opt for single-user licenses, while businesses requiring broader access may choose multi-user or enterprise licenses for cost-effective access to the report.
13. Are there any additional resources or data provided in the Energy Storage in United Kingdom Market report?
While the report offers comprehensive insights, it's advisable to review the specific contents or supplementary materials provided to ascertain if additional resources or data are available.
14. How can I stay updated on further developments or reports in the Energy Storage in United Kingdom Market?
To stay informed about further developments, trends, and reports in the Energy Storage in United Kingdom Market, consider subscribing to industry newsletters, following relevant companies and organizations, or regularly checking reputable industry news sources and publications.
Methodology
Step 1 - Identification of Relevant Samples Size from Population Database


Step 2 - Approaches for Defining Global Market Size (Value, Volume* & Price*)

Note*: In applicable scenarios
Step 3 - Data Sources
Primary Research
- Web Analytics
- Survey Reports
- Research Institute
- Latest Research Reports
- Opinion Leaders
Secondary Research
- Annual Reports
- White Paper
- Latest Press Release
- Industry Association
- Paid Database
- Investor Presentations

Step 4 - Data Triangulation
Involves using different sources of information in order to increase the validity of a study
These sources are likely to be stakeholders in a program - participants, other researchers, program staff, other community members, and so on.
Then we put all data in single framework & apply various statistical tools to find out the dynamic on the market.
During the analysis stage, feedback from the stakeholder groups would be compared to determine areas of agreement as well as areas of divergence