

Key Insights
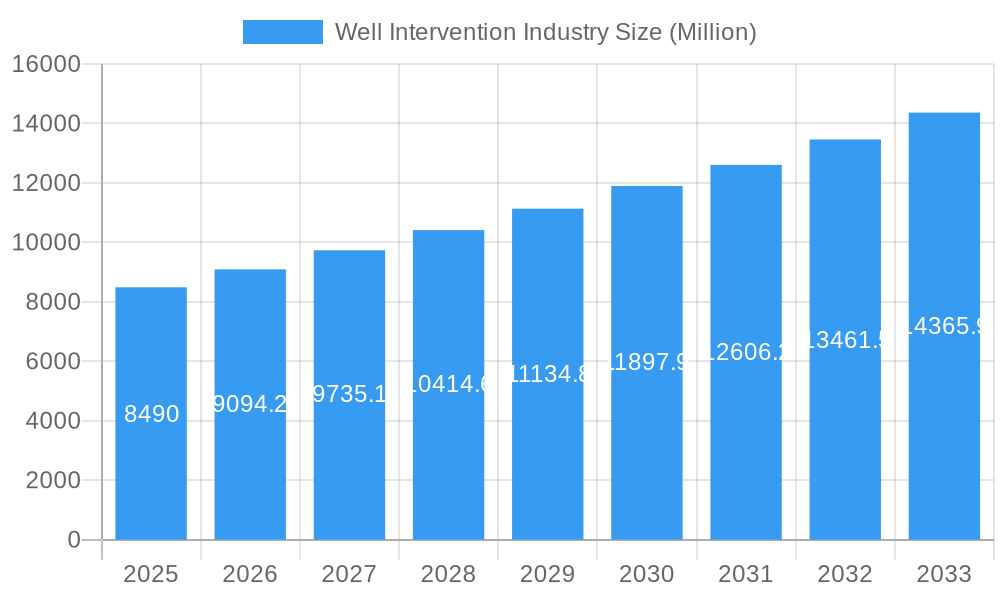
The global Well Intervention market is projected to reach an estimated $8.49 billion by 2025, exhibiting a robust Compound Annual Growth Rate (CAGR) of 6.80% throughout the forecast period of 2025-2033. This substantial growth is fueled by a confluence of factors, primarily driven by the increasing demand for enhanced oil recovery (EOR) techniques to maximize production from mature oilfields and the continuous need for maintaining and restoring the productivity of existing wells. The imperative to optimize operational efficiency and extend the lifespan of these assets in an environment of fluctuating oil prices and evolving energy landscapes underscores the critical role of well intervention services. Furthermore, advancements in technology, including sophisticated logging tools, advanced artificial lift systems, and digital solutions for real-time monitoring and analysis, are significantly contributing to the market's expansion by offering more cost-effective and efficient intervention solutions.
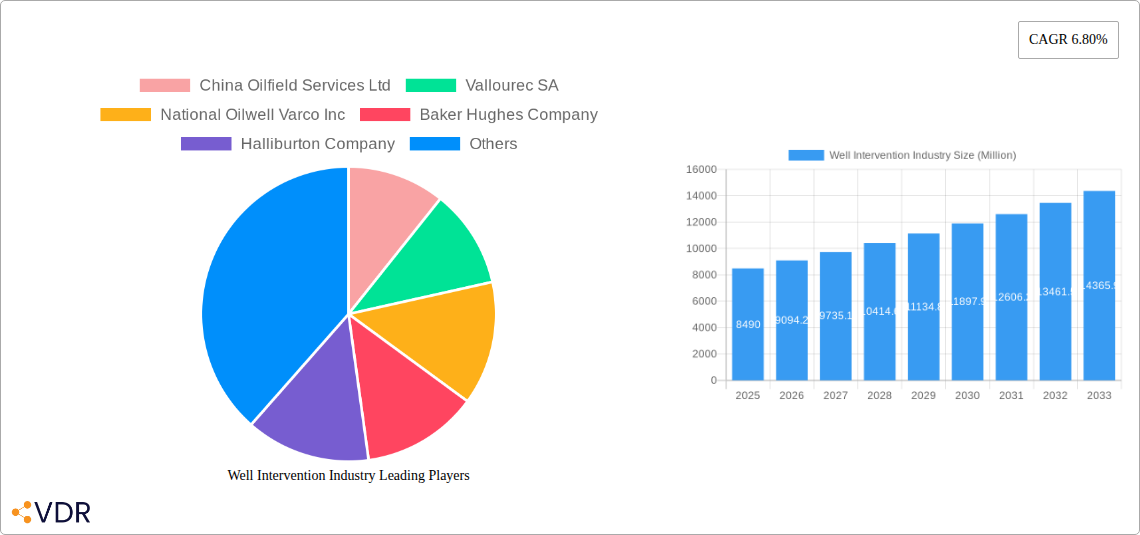
Well Intervention Industry Market Size (In Billion)
The market is segmented by the location of deployment, with both onshore and offshore operations playing vital roles. Onshore well intervention remains a dominant segment due to its extensive presence and continued investment in existing fields, particularly in regions with large hydrocarbon reserves. However, the offshore segment is anticipated to witness significant growth, driven by the increasing complexity of offshore exploration and production, the development of deepwater and ultra-deepwater fields, and the necessity for specialized intervention services in these challenging environments. Key players such as China Oilfield Services Ltd, Vallourec SA, National Oilwell Varco Inc, Baker Hughes Company, Halliburton Company, Weatherford International Ltd, Schlumberger Limited, and Scientific Drilling International Inc are actively engaged in the market, leveraging technological innovations and strategic collaborations to cater to the diverse needs of oil and gas operators worldwide and maintain their competitive edge.
Well Intervention Industry Company Market Share
Comprehensive Report: Well Intervention Market Analysis & Forecast (2019-2033)
This in-depth report provides a definitive analysis of the global Well Intervention market, offering critical insights into its dynamics, growth trajectories, and future outlook. Covering the period from 2019 to 2033, with a base year of 2025, this research is essential for stakeholders seeking to understand and capitalize on opportunities within this vital sector of the oil and gas industry. We delve into market segmentation by location of deployment (Onshore, Offshore) and explore parent and child market interdependencies.
Well Intervention Industry Market Dynamics & Structure
The global Well Intervention market exhibits a moderately concentrated structure, with several major global players dominating market share. Technological innovation serves as a primary driver, pushing advancements in efficiency, safety, and environmental compliance. Regulatory frameworks, particularly concerning environmental protection and well integrity, are shaping operational standards and investment priorities. Competitive product substitutes, while limited in direct replacements for core intervention services, exist in the form of enhanced oil recovery (EOR) techniques that may reduce the immediate need for certain intervention types. End-user demographics are largely driven by the production life cycles of mature oil and gas fields, necessitating intervention to maintain or enhance output. Mergers and acquisitions (M&A) activity, while not consistently high, signals strategic consolidation and capability enhancement among key players. For instance, the historical period (2019-2024) saw an estimated 5-10 major M&A deals annually, with deal values often exceeding $500 million. Barriers to innovation include the high capital investment required for R&D and the inherent risks associated with sub-surface operations.
- Market Concentration: Dominated by a few large, integrated service providers.
- Technological Innovation: Driven by the need for cost reduction, improved recovery rates, and enhanced safety.
- Regulatory Frameworks: Stringent environmental and safety regulations influence service provision and technology adoption.
- Competitive Substitutes: EOR techniques can indirectly influence intervention demand.
- End-User Demographics: Mature fields are the primary demand generators.
- M&A Trends: Strategic consolidation and acquisition of specialized technologies.
- Innovation Barriers: High R&D costs and operational risks.
Well Intervention Industry Growth Trends & Insights
The global Well Intervention market is poised for substantial growth, projected to expand at a Compound Annual Growth Rate (CAGR) of approximately 4.5% during the forecast period (2025-2033). This growth is underpinned by the increasing demand for maximizing production from existing oil and gas assets, particularly in mature fields. The adoption rate of advanced intervention technologies, such as intelligent completions and digital twin applications for predictive maintenance, is steadily increasing as operators seek to optimize operational efficiency and minimize downtime. Technological disruptions, including the development of more sophisticated artificial lift systems and enhanced diagnostics tools, are further accelerating market penetration. Consumer behavior shifts within the industry are characterized by a greater emphasis on cost-effectiveness, sustainability, and data-driven decision-making. The market size, estimated at $55,000 million in 2025, is projected to reach approximately $78,000 million by 2033. Market penetration for specialized services like subsea well intervention is expected to rise significantly due to the increasing complexity and depth of offshore fields.
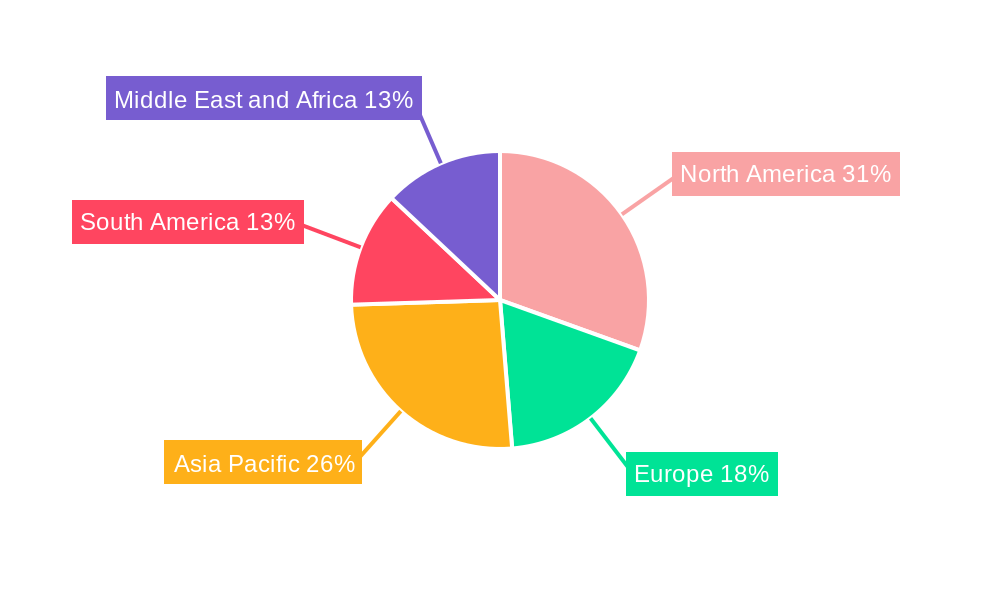
Dominant Regions, Countries, or Segments in Well Intervention Industry
The Offshore segment is the dominant driver of market growth within the Well Intervention industry, accounting for an estimated 65% of the global market share in 2025. This dominance is propelled by several key factors. The increasing number of deepwater and ultra-deepwater exploration and production activities worldwide necessitates specialized intervention techniques to maintain production and ensure asset integrity. Economic policies in regions with significant offshore reserves, such as the Middle East, North America (Gulf of Mexico), and parts of Asia Pacific, actively encourage investment in offshore E&P, thereby bolstering demand for well intervention services. Furthermore, the development of advanced offshore infrastructure, including subsea production systems and floating production, storage, and offloading (FPSO) units, creates a sustained need for well intervention throughout their operational life cycles. Growth potential in the offshore segment is amplified by the technical challenges associated with subsea wells, requiring highly skilled personnel and specialized equipment for operations like well repair, stimulation, and abandonment. Market share within the offshore segment is further influenced by the presence of major oil companies with extensive offshore portfolios and established intervention service providers with strong subsea capabilities. The evolving technological landscape, with advancements in remotely operated vehicles (ROVs) and autonomous underwater vehicles (AUVs) for intervention tasks, also favors the offshore segment's expansion.
- Offshore Segment Dominance: Driven by increasing deepwater E&P and the complexity of subsea operations.
- Key Geographic Drivers: Middle East, North America (Gulf of Mexico), Asia Pacific, and the Norwegian Continental Shelf.
- Economic Policies: Favorable investment climate for offshore exploration and production.
- Infrastructure Development: Advanced subsea systems and FPSOs require ongoing intervention.
- Technical Challenges: Unique demands of subsea well intervention.
- Technological Advancements: ROVs and AUVs enhancing offshore intervention capabilities.
Well Intervention Industry Product Landscape
The product landscape in the Well Intervention industry is characterized by continuous innovation focused on enhancing efficiency, safety, and environmental performance. Key product developments include advanced coiled tubing units, sophisticated logging tools for real-time data acquisition, and specialized chemical treatments for production optimization. Applications range from routine maintenance and diagnostics to complex remedial work and decommissioning. Performance metrics are continuously being refined, with a focus on reduced rig time, lower operational costs, and improved wellbore integrity. Unique selling propositions often lie in the ability to perform interventions in challenging environments (high pressure, high temperature, deep water) and the integration of digital solutions for enhanced decision-making and predictive analysis. Technological advancements are also centered on non-intrusive inspection methods and more environmentally friendly intervention fluids.
Key Drivers, Barriers & Challenges in Well Intervention Industry
Key Drivers: The Well Intervention industry is propelled by several critical drivers. The aging global oil and gas infrastructure, with many wells nearing the end of their economically viable life, necessitates intervention to sustain production. The drive for enhanced oil recovery (EOR) techniques and improved production efficiency from existing reservoirs is a significant catalyst. Technological advancements in intervention tools and methodologies are enabling more complex and cost-effective operations. Furthermore, favorable crude oil prices, when sustained, incentivize operators to invest in production optimization and maintenance, directly impacting intervention demand. Government policies promoting energy security and domestic production also play a crucial role.
Key Barriers & Challenges: Conversely, the industry faces significant barriers and challenges. The volatile nature of crude oil prices introduces uncertainty and can lead to deferral of capital expenditure on intervention projects. Stringent environmental regulations and increasing scrutiny on operational safety can elevate compliance costs and complexity. The mature nature of many producing basins means that remaining reserves are often more challenging to access and produce, requiring more sophisticated and expensive intervention solutions. Supply chain disruptions, particularly for specialized equipment and skilled personnel, can impact project timelines and costs. Intense competition among service providers can also lead to pricing pressures, affecting profitability.
Emerging Opportunities in Well Intervention Industry
Emerging opportunities in the Well Intervention industry are largely driven by the transition towards more sustainable energy practices and the need to optimize existing hydrocarbon assets. The increasing focus on carbon capture, utilization, and storage (CCUS) presents new intervention demands for injection and monitoring wells. The growing emphasis on plugging and abandonment (P&A) of aging wells, particularly offshore, offers a substantial long-term market. Furthermore, the development of digital solutions and AI-powered analytics for predictive maintenance and real-time well performance monitoring opens avenues for value-added services. Untapped markets in regions with developing oil and gas sectors, coupled with the application of novel technologies in harsh environments, also represent significant growth potential.
Growth Accelerators in the Well Intervention Industry Industry
Several growth accelerators are poised to drive the Well Intervention industry forward. Technological breakthroughs in areas like autonomous intervention systems and advanced downhole diagnostics will enhance efficiency and reduce operational risks. Strategic partnerships between major oilfield service providers and technology innovators are crucial for developing and deploying cutting-edge solutions. Market expansion strategies targeting emerging oil and gas frontiers, particularly those with complex geological formations, will further fuel demand. The increasing global demand for energy, coupled with the necessity to maximize output from existing, mature fields, ensures a sustained need for well intervention services, making it a resilient sector within the broader energy landscape.
Key Players Shaping the Well Intervention Industry Market
- Baker Hughes Company
- Halliburton Company
- Schlumberger Limited
- Weatherford International Ltd
- National Oilwell Varco Inc
- Vallourec SA
- China Oilfield Services Ltd
- TechnipFMC
- Scientific Drilling International Inc
Notable Milestones in Well Intervention Industry Sector
- May 2023: TechnipFMC secured a contract from Equinor for riserless light well intervention (RLWI) services on the Norwegian Continental Shelf, encompassing production enhancement, data acquisition, and pre-plug-and-abandonment services for 2024-2025, with extension options.
- March 2023: Petroleum Safety Authority Norway (PSA) granted Norske Shell approval to utilize the Island Constructor vessel for well intervention activities on the Knarr and Gaupe fields.
In-Depth Well Intervention Industry Market Outlook
The future outlook for the Well Intervention industry is robust, driven by the imperative to maximize production from existing hydrocarbon reserves and the growing need for efficient decommissioning of aging infrastructure. Growth accelerators include continued technological innovation, particularly in digital solutions and automation, alongside strategic collaborations that bring together expertise and resources. The increasing focus on environmental stewardship will also spur demand for advanced intervention techniques that minimize operational footprints. Emerging opportunities in areas like CCUS and the P&A market are poised to diversify revenue streams. Overall, the market is projected for sustained growth, offering significant strategic opportunities for companies that can adapt to evolving technological landscapes and meet the increasing demands for efficiency, safety, and sustainability.
Well Intervention Industry Segmentation
-
1. Location of Deployment
- 1.1. Onshore
- 1.2. Offshore
Well Intervention Industry Segmentation By Geography
-
1. North America
- 1.1. United States of America
- 1.2. Canada
- 1.3. Rest of the North America
-
2. Europe
- 2.1. United Kingdom
- 2.2. France
- 2.3. Germany
- 2.4. Italy
- 2.5. Rest of the Europe
-
3. Asia Pacific
- 3.1. China
- 3.2. India
- 3.3. South Korea
- 3.4. Rest of the Asia Pacific
-
4. South America
- 4.1. Brazil
- 4.2. Argentina
- 4.3. Rest of the South America
-
5. Middle East and Africa
- 5.1. United Arab Emirates
- 5.2. Saudi Arabia
- 5.3. Rest of the Middle East and Africa
Well Intervention Industry Regional Market Share
Geographic Coverage of Well Intervention Industry
Well Intervention Industry REPORT HIGHLIGHTS
| Aspects | Details |
|---|---|
| Study Period | 2020-2034 |
| Base Year | 2025 |
| Estimated Year | 2026 |
| Forecast Period | 2026-2034 |
| Historical Period | 2020-2025 |
| Growth Rate | CAGR of 6.80% from 2020-2034 |
| Segmentation |
|
Table of Contents
- 1. Introduction
- 1.1. Research Scope
- 1.2. Market Segmentation
- 1.3. Research Objective
- 1.4. Definitions and Assumptions
- 2. Executive Summary
- 2.1. Market Snapshot
- 3. Market Dynamics
- 3.1. Market Drivers
- 3.2. Market Restrains
- 3.3. Market Trends
- 3.4. Market Opportunities
- 4. Market Factor Analysis
- 4.1. Porters Five Forces
- 4.1.1. Bargaining Power of Suppliers
- 4.1.2. Bargaining Power of Buyers
- 4.1.3. Threat of New Entrants
- 4.1.4. Threat of Substitutes
- 4.1.5. Competitive Rivalry
- 4.2. PESTEL analysis
- 4.3. BCG Analysis
- 4.3.1. Stars (High Growth, High Market Share)
- 4.3.2. Cash Cows (Low Growth, High Market Share)
- 4.3.3. Question Mark (High Growth, Low Market Share)
- 4.3.4. Dogs (Low Growth, Low Market Share)
- 4.4. Ansoff Matrix Analysis
- 4.5. Supply Chain Analysis
- 4.6. Regulatory Landscape
- 4.7. Current Market Potential and Opportunity Assessment (TAM–SAM–SOM Framework)
- 4.8. VDR Analyst Note
- 4.1. Porters Five Forces
- 5. Market Analysis, Insights and Forecast 2021-2033
- 5.1. Market Analysis, Insights and Forecast - by Location of Deployment
- 5.1.1. Onshore
- 5.1.2. Offshore
- 5.2. Market Analysis, Insights and Forecast - by Region
- 5.2.1. North America
- 5.2.2. Europe
- 5.2.3. Asia Pacific
- 5.2.4. South America
- 5.2.5. Middle East and Africa
- 5.1. Market Analysis, Insights and Forecast - by Location of Deployment
- 6. Global Well Intervention Industry Analysis, Insights and Forecast, 2021-2033
- 6.1. Market Analysis, Insights and Forecast - by Location of Deployment
- 6.1.1. Onshore
- 6.1.2. Offshore
- 6.1. Market Analysis, Insights and Forecast - by Location of Deployment
- 7. North America Well Intervention Industry Analysis, Insights and Forecast, 2021-2033
- 7.1. Market Analysis, Insights and Forecast - by Location of Deployment
- 7.1.1. Onshore
- 7.1.2. Offshore
- 7.1. Market Analysis, Insights and Forecast - by Location of Deployment
- 8. Europe Well Intervention Industry Analysis, Insights and Forecast, 2021-2033
- 8.1. Market Analysis, Insights and Forecast - by Location of Deployment
- 8.1.1. Onshore
- 8.1.2. Offshore
- 8.1. Market Analysis, Insights and Forecast - by Location of Deployment
- 9. Asia Pacific Well Intervention Industry Analysis, Insights and Forecast, 2021-2033
- 9.1. Market Analysis, Insights and Forecast - by Location of Deployment
- 9.1.1. Onshore
- 9.1.2. Offshore
- 9.1. Market Analysis, Insights and Forecast - by Location of Deployment
- 10. South America Well Intervention Industry Analysis, Insights and Forecast, 2021-2033
- 10.1. Market Analysis, Insights and Forecast - by Location of Deployment
- 10.1.1. Onshore
- 10.1.2. Offshore
- 10.1. Market Analysis, Insights and Forecast - by Location of Deployment
- 11. Middle East and Africa Well Intervention Industry Analysis, Insights and Forecast, 2021-2033
- 11.1. Market Analysis, Insights and Forecast - by Location of Deployment
- 11.1.1. Onshore
- 11.1.2. Offshore
- 11.1. Market Analysis, Insights and Forecast - by Location of Deployment
- 12. Competitive Analysis
- 12.1. Company Profiles
- 12.1.1 China Oilfield Services Ltd
- 12.1.1.1. Company Overview
- 12.1.1.2. Products
- 12.1.1.3. Company Financials
- 12.1.1.4. SWOT Analysis
- 12.1.2 Vallourec SA
- 12.1.2.1. Company Overview
- 12.1.2.2. Products
- 12.1.2.3. Company Financials
- 12.1.2.4. SWOT Analysis
- 12.1.3 National Oilwell Varco Inc
- 12.1.3.1. Company Overview
- 12.1.3.2. Products
- 12.1.3.3. Company Financials
- 12.1.3.4. SWOT Analysis
- 12.1.4 Baker Hughes Company
- 12.1.4.1. Company Overview
- 12.1.4.2. Products
- 12.1.4.3. Company Financials
- 12.1.4.4. SWOT Analysis
- 12.1.5 Halliburton Company
- 12.1.5.1. Company Overview
- 12.1.5.2. Products
- 12.1.5.3. Company Financials
- 12.1.5.4. SWOT Analysis
- 12.1.6 Weatherford International Ltd
- 12.1.6.1. Company Overview
- 12.1.6.2. Products
- 12.1.6.3. Company Financials
- 12.1.6.4. SWOT Analysis
- 12.1.7 Schlumberger Limited
- 12.1.7.1. Company Overview
- 12.1.7.2. Products
- 12.1.7.3. Company Financials
- 12.1.7.4. SWOT Analysis
- 12.1.8 Scientific Drilling International Inc
- 12.1.8.1. Company Overview
- 12.1.8.2. Products
- 12.1.8.3. Company Financials
- 12.1.8.4. SWOT Analysis
- 12.1.1 China Oilfield Services Ltd
- 12.2. Market Entropy
- 12.2.1 Company's Key Areas Served
- 12.2.2 Recent Developments
- 12.3. Company Market Share Analysis 2025
- 12.3.1 Top 5 Companies Market Share Analysis
- 12.3.2 Top 3 Companies Market Share Analysis
- 12.4. List of Potential Customers
- 13. Research Methodology
List of Figures
- Figure 1: Global Well Intervention Industry Revenue Breakdown (Million, %) by Region 2025 & 2033
- Figure 2: North America Well Intervention Industry Revenue (Million), by Location of Deployment 2025 & 2033
- Figure 3: North America Well Intervention Industry Revenue Share (%), by Location of Deployment 2025 & 2033
- Figure 4: North America Well Intervention Industry Revenue (Million), by Country 2025 & 2033
- Figure 5: North America Well Intervention Industry Revenue Share (%), by Country 2025 & 2033
- Figure 6: Europe Well Intervention Industry Revenue (Million), by Location of Deployment 2025 & 2033
- Figure 7: Europe Well Intervention Industry Revenue Share (%), by Location of Deployment 2025 & 2033
- Figure 8: Europe Well Intervention Industry Revenue (Million), by Country 2025 & 2033
- Figure 9: Europe Well Intervention Industry Revenue Share (%), by Country 2025 & 2033
- Figure 10: Asia Pacific Well Intervention Industry Revenue (Million), by Location of Deployment 2025 & 2033
- Figure 11: Asia Pacific Well Intervention Industry Revenue Share (%), by Location of Deployment 2025 & 2033
- Figure 12: Asia Pacific Well Intervention Industry Revenue (Million), by Country 2025 & 2033
- Figure 13: Asia Pacific Well Intervention Industry Revenue Share (%), by Country 2025 & 2033
- Figure 14: South America Well Intervention Industry Revenue (Million), by Location of Deployment 2025 & 2033
- Figure 15: South America Well Intervention Industry Revenue Share (%), by Location of Deployment 2025 & 2033
- Figure 16: South America Well Intervention Industry Revenue (Million), by Country 2025 & 2033
- Figure 17: South America Well Intervention Industry Revenue Share (%), by Country 2025 & 2033
- Figure 18: Middle East and Africa Well Intervention Industry Revenue (Million), by Location of Deployment 2025 & 2033
- Figure 19: Middle East and Africa Well Intervention Industry Revenue Share (%), by Location of Deployment 2025 & 2033
- Figure 20: Middle East and Africa Well Intervention Industry Revenue (Million), by Country 2025 & 2033
- Figure 21: Middle East and Africa Well Intervention Industry Revenue Share (%), by Country 2025 & 2033
List of Tables
- Table 1: Global Well Intervention Industry Revenue Million Forecast, by Location of Deployment 2020 & 2033
- Table 2: Global Well Intervention Industry Revenue Million Forecast, by Region 2020 & 2033
- Table 3: Global Well Intervention Industry Revenue Million Forecast, by Location of Deployment 2020 & 2033
- Table 4: Global Well Intervention Industry Revenue Million Forecast, by Country 2020 & 2033
- Table 5: United States of America Well Intervention Industry Revenue (Million) Forecast, by Application 2020 & 2033
- Table 6: Canada Well Intervention Industry Revenue (Million) Forecast, by Application 2020 & 2033
- Table 7: Rest of the North America Well Intervention Industry Revenue (Million) Forecast, by Application 2020 & 2033
- Table 8: Global Well Intervention Industry Revenue Million Forecast, by Location of Deployment 2020 & 2033
- Table 9: Global Well Intervention Industry Revenue Million Forecast, by Country 2020 & 2033
- Table 10: United Kingdom Well Intervention Industry Revenue (Million) Forecast, by Application 2020 & 2033
- Table 11: France Well Intervention Industry Revenue (Million) Forecast, by Application 2020 & 2033
- Table 12: Germany Well Intervention Industry Revenue (Million) Forecast, by Application 2020 & 2033
- Table 13: Italy Well Intervention Industry Revenue (Million) Forecast, by Application 2020 & 2033
- Table 14: Rest of the Europe Well Intervention Industry Revenue (Million) Forecast, by Application 2020 & 2033
- Table 15: Global Well Intervention Industry Revenue Million Forecast, by Location of Deployment 2020 & 2033
- Table 16: Global Well Intervention Industry Revenue Million Forecast, by Country 2020 & 2033
- Table 17: China Well Intervention Industry Revenue (Million) Forecast, by Application 2020 & 2033
- Table 18: India Well Intervention Industry Revenue (Million) Forecast, by Application 2020 & 2033
- Table 19: South Korea Well Intervention Industry Revenue (Million) Forecast, by Application 2020 & 2033
- Table 20: Rest of the Asia Pacific Well Intervention Industry Revenue (Million) Forecast, by Application 2020 & 2033
- Table 21: Global Well Intervention Industry Revenue Million Forecast, by Location of Deployment 2020 & 2033
- Table 22: Global Well Intervention Industry Revenue Million Forecast, by Country 2020 & 2033
- Table 23: Brazil Well Intervention Industry Revenue (Million) Forecast, by Application 2020 & 2033
- Table 24: Argentina Well Intervention Industry Revenue (Million) Forecast, by Application 2020 & 2033
- Table 25: Rest of the South America Well Intervention Industry Revenue (Million) Forecast, by Application 2020 & 2033
- Table 26: Global Well Intervention Industry Revenue Million Forecast, by Location of Deployment 2020 & 2033
- Table 27: Global Well Intervention Industry Revenue Million Forecast, by Country 2020 & 2033
- Table 28: United Arab Emirates Well Intervention Industry Revenue (Million) Forecast, by Application 2020 & 2033
- Table 29: Saudi Arabia Well Intervention Industry Revenue (Million) Forecast, by Application 2020 & 2033
- Table 30: Rest of the Middle East and Africa Well Intervention Industry Revenue (Million) Forecast, by Application 2020 & 2033
Frequently Asked Questions
1. What is the projected Compound Annual Growth Rate (CAGR) of the Well Intervention Industry?
The projected CAGR is approximately 6.80%.
2. Which companies are prominent players in the Well Intervention Industry?
Key companies in the market include China Oilfield Services Ltd, Vallourec SA, National Oilwell Varco Inc, Baker Hughes Company, Halliburton Company, Weatherford International Ltd, Schlumberger Limited, Scientific Drilling International Inc.
3. What are the main segments of the Well Intervention Industry?
The market segments include Location of Deployment.
4. Can you provide details about the market size?
The market size is estimated to be USD 8.49 Million as of 2022.
5. What are some drivers contributing to market growth?
4.; Increased Drilling and Completion Activities.
6. What are the notable trends driving market growth?
Offshore Segment to have a Significant Market Share.
7. Are there any restraints impacting market growth?
4.; Volatility of Oil Prices.
8. Can you provide examples of recent developments in the market?
In May 2023, TechnipFMC got a contract from Equinor to provide riserless light well intervention (RLWI) services on the Norwegian Continental Shelf. The contract includes production enhancement, production data, and pre-plug-and-abandonment services with a time bond from 2024 to 2025, with options to extend for the three subsequent years.
9. What pricing options are available for accessing the report?
Pricing options include single-user, multi-user, and enterprise licenses priced at USD 4750, USD 5250, and USD 8750 respectively.
10. Is the market size provided in terms of value or volume?
The market size is provided in terms of value, measured in Million.
11. Are there any specific market keywords associated with the report?
Yes, the market keyword associated with the report is "Well Intervention Industry," which aids in identifying and referencing the specific market segment covered.
12. How do I determine which pricing option suits my needs best?
The pricing options vary based on user requirements and access needs. Individual users may opt for single-user licenses, while businesses requiring broader access may choose multi-user or enterprise licenses for cost-effective access to the report.
13. Are there any additional resources or data provided in the Well Intervention Industry report?
While the report offers comprehensive insights, it's advisable to review the specific contents or supplementary materials provided to ascertain if additional resources or data are available.
14. How can I stay updated on further developments or reports in the Well Intervention Industry?
To stay informed about further developments, trends, and reports in the Well Intervention Industry, consider subscribing to industry newsletters, following relevant companies and organizations, or regularly checking reputable industry news sources and publications.
Methodology
Step 1 - Identification of Relevant Samples Size from Population Database


Step 2 - Approaches for Defining Global Market Size (Value, Volume* & Price*)

Note*: In applicable scenarios
Step 3 - Data Sources
Primary Research
- Web Analytics
- Survey Reports
- Research Institute
- Latest Research Reports
- Opinion Leaders
Secondary Research
- Annual Reports
- White Paper
- Latest Press Release
- Industry Association
- Paid Database
- Investor Presentations

Step 4 - Data Triangulation
Involves using different sources of information in order to increase the validity of a study
These sources are likely to be stakeholders in a program - participants, other researchers, program staff, other community members, and so on.
Then we put all data in single framework & apply various statistical tools to find out the dynamic on the market.
During the analysis stage, feedback from the stakeholder groups would be compared to determine areas of agreement as well as areas of divergence