
Key Insights
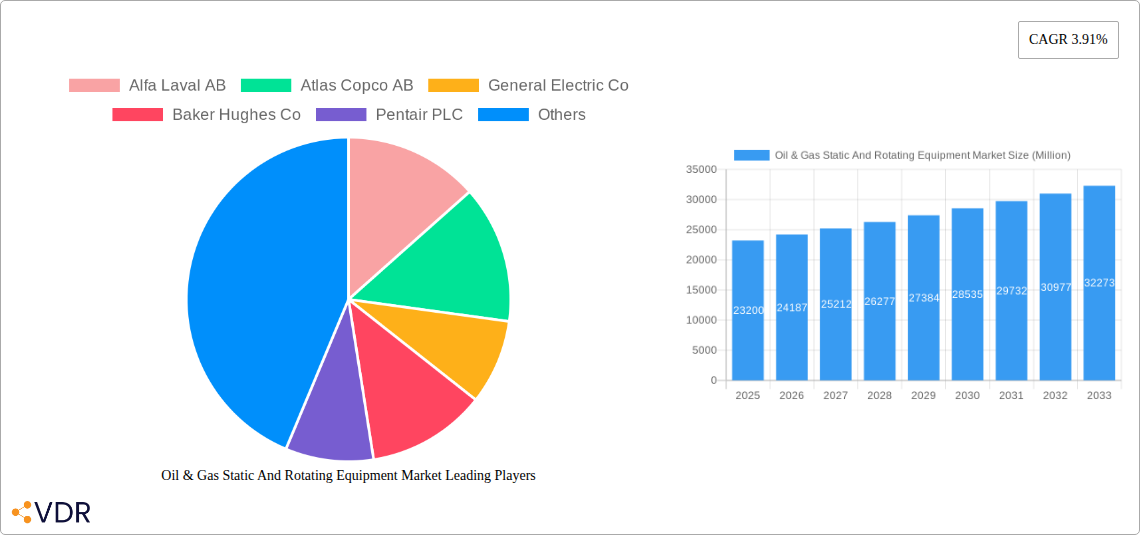
The Oil & Gas Static and Rotating Equipment market is a substantial sector, currently valued at $23.20 billion (2025), exhibiting a Compound Annual Growth Rate (CAGR) of 3.91% from 2019 to 2033. This growth is fueled by several key drivers, including increasing global energy demand, particularly in developing economies, and the ongoing expansion of oil and gas exploration and production activities. Furthermore, advancements in technology, such as the adoption of more efficient and reliable equipment, contribute significantly to market expansion. While the market faces some restraints like fluctuating oil and gas prices and stringent environmental regulations, the overall outlook remains positive, driven by long-term energy needs and investments in infrastructure upgrades. Major players like Alfa Laval AB, Atlas Copco AB, General Electric Co, and others are continuously innovating to capture market share and meet evolving customer demands. The segment showing the strongest growth is likely to be the high-efficiency equipment segment, driven by the need for cost optimization in the industry. This competitive landscape will likely result in increased mergers and acquisitions, further shaping the market dynamics in the coming years. The forecast period (2025-2033) promises steady growth, with projections suggesting the market will surpass $35 billion by 2033.
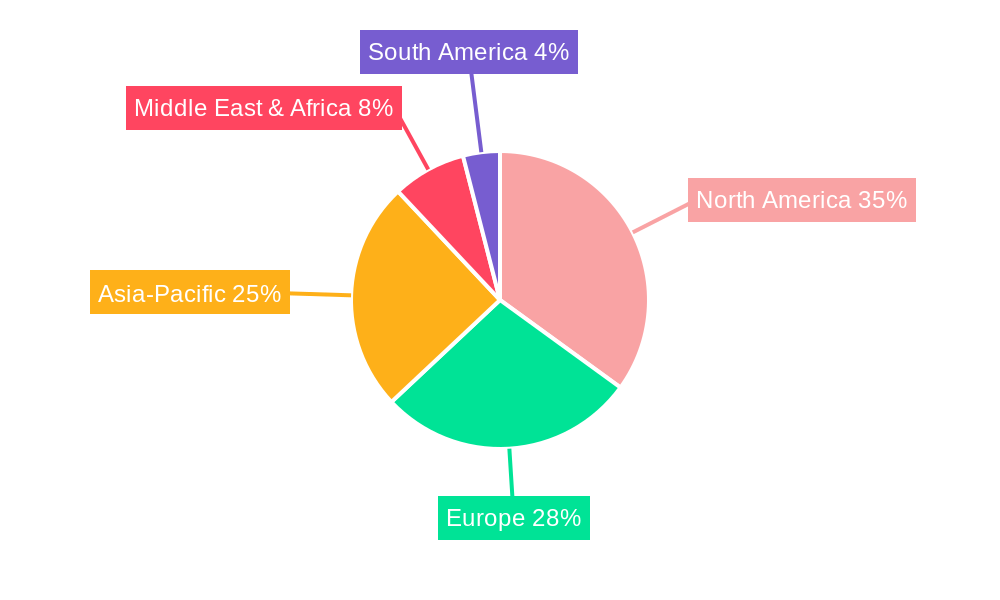
The geographic distribution of this market is expected to be diverse, with North America, Europe, and Asia-Pacific regions contributing significantly. The ongoing energy transition is also influencing the market, with a growing focus on equipment suitable for both conventional and unconventional resources, and with an increasing emphasis on sustainability and reduced environmental impact. Companies are adapting their strategies to incorporate these aspects, leading to the development of new technologies and solutions, promoting efficient operations, and minimizing environmental footprints. The market's evolution is marked by a shift towards intelligent equipment with advanced monitoring and predictive maintenance capabilities, driving efficiency and reducing operational downtime. This trend, combined with the persistent demand for energy, creates a conducive environment for sustained growth within the oil and gas static and rotating equipment market.
Oil & Gas Static and Rotating Equipment Market Report: 2019-2033
This comprehensive report provides a detailed analysis of the Oil & Gas Static and Rotating Equipment market, encompassing both the parent market (Oil & Gas Equipment) and the child market (Static and Rotating Equipment). The study period covers 2019-2033, with a base year of 2025 and a forecast period of 2025-2033. The report is essential for industry professionals, investors, and strategic decision-makers seeking to understand the market dynamics, growth trends, and future opportunities within this vital sector. The market size is projected to reach xx Million units by 2033.
Oil & Gas Static and Rotating Equipment Market Dynamics & Structure
This section delves into the intricate dynamics shaping the Oil & Gas Static and Rotating Equipment market. We analyze market concentration, revealing the dominance of key players and the competitive landscape. The report assesses the impact of technological innovation, including advancements in materials, design, and manufacturing processes. Regulatory frameworks and their influence on market growth are examined, alongside an analysis of competitive product substitutes and their market penetration. Furthermore, the report explores end-user demographics, identifying key industry segments and their specific needs. Finally, M&A activity within the sector is analyzed, including deal volumes and their impact on market consolidation.
- Market Concentration: xx% of the market is controlled by the top 5 players (as of 2024).
- Technological Innovation: Focus on digitalization, automation, and improved efficiency leading to xx% increase in productivity by 2033.
- Regulatory Landscape: Compliance with API standards and environmental regulations are major drivers, influencing xx% of equipment sales.
- M&A Activity: xx major mergers and acquisitions recorded in the past 5 years.
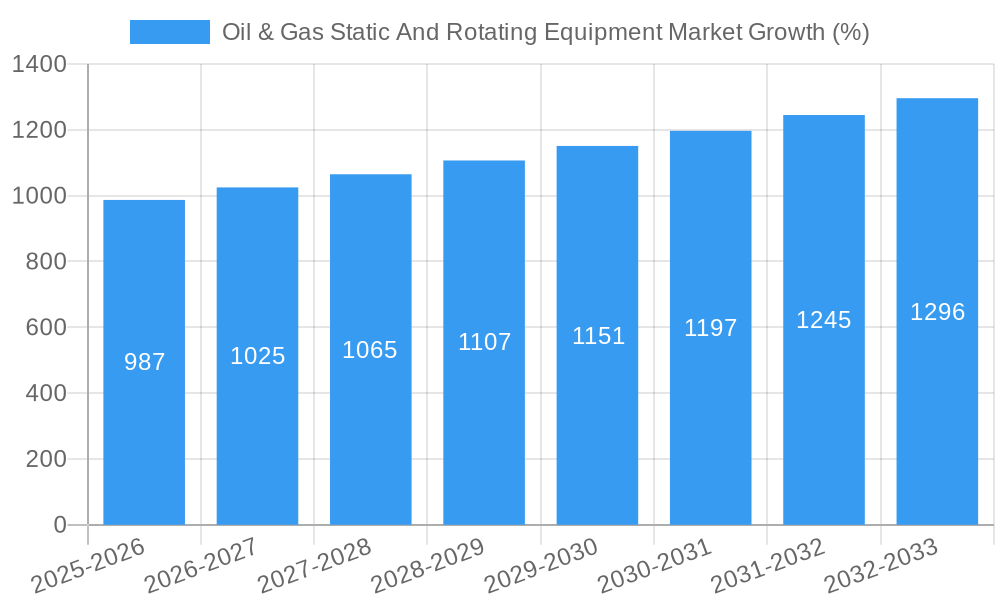
Oil & Gas Static and Rotating Equipment Market Growth Trends & Insights
This in-depth analysis leverages extensive market research data to provide a comprehensive overview of market size evolution. We project the Compound Annual Growth Rate (CAGR) and explore the factors driving adoption rates across various segments. The report also identifies technological disruptions, such as the integration of IoT and AI, and their impact on market growth. Finally, we analyze shifts in consumer behavior, including increasing demand for sustainable and energy-efficient equipment.
- Market Size Evolution: The market size grew from xx Million units in 2019 to xx Million units in 2024 and is projected to reach xx Million units by 2033.
- CAGR: The market is expected to register a CAGR of xx% during the forecast period.
- Technological Disruptions: Adoption of digital twins and predictive maintenance technologies to increase efficiency and reduce downtime.
Dominant Regions, Countries, or Segments in Oil & Gas Static and Rotating Equipment Market
This section pinpoints the leading regions, countries, and segments driving market growth. We analyze the dominance factors contributing to their success, including market share and growth potential. Key drivers such as economic policies, infrastructure development, and government initiatives are highlighted using bullet points, providing deeper insights into regional disparities.
- Leading Region: North America currently holds the largest market share due to significant oil and gas production and infrastructure investment.
- Key Drivers (North America): Strong domestic oil and gas production, investments in renewable energy infrastructure, and government support for technological advancements.
- Growth Potential (Asia-Pacific): Rapid industrialization and urbanization in Asia-Pacific are fueling significant market growth.
Oil & Gas Static and Rotating Equipment Market Product Landscape
This section provides an overview of the product landscape, detailing product innovations, applications, and performance metrics. We analyze the unique selling propositions of various products and highlight technological advancements such as the use of advanced materials, improved designs, and increased efficiency.
The market offers a wide array of static equipment (e.g., pressure vessels, heat exchangers, storage tanks) and rotating equipment (e.g., pumps, compressors, turbines). Innovations focus on enhancing durability, efficiency, and safety while minimizing environmental impact.
Key Drivers, Barriers & Challenges in Oil & Gas Static and Rotating Equipment Market
This section identifies the primary forces propelling market growth, including technological advancements, favorable economic conditions, and supportive government policies. Specific examples are provided to illustrate these drivers. Conversely, it also analyzes key challenges and restraints, such as supply chain disruptions, regulatory hurdles, and intense competition, quantifying their impact on market growth.
- Key Drivers: Increasing oil and gas exploration & production, stringent emission regulations pushing for efficient equipment.
- Challenges: Supply chain volatility leading to increased costs, stringent environmental regulations increasing compliance costs, and intense competition among established players.
Emerging Opportunities in Oil & Gas Static and Rotating Equipment Market
This section highlights emerging trends and opportunities, including untapped markets, innovative applications, and evolving consumer preferences. We analyze the potential for growth in these areas, providing insights for strategic planning.
- Opportunities: Growth in offshore oil and gas exploration, increasing adoption of digital solutions, and demand for sustainable and eco-friendly equipment.
Growth Accelerators in the Oil & Gas Static and Rotating Equipment Market Industry
This section explores the catalysts driving long-term market growth, such as technological breakthroughs, strategic partnerships, and market expansion strategies. We analyze the potential for sustained growth based on these factors.
Technological advancements in materials science, automation, and digitalization are key drivers of future growth. Strategic partnerships and mergers & acquisitions are also shaping the competitive landscape and driving innovation.
Key Players Shaping the Oil & Gas Static and Rotating Equipment Market Market
- Alfa Laval AB
- Atlas Copco AB
- General Electric Co
- Baker Hughes Co
- Pentair PLC
- Siemens AG
- Sulzer Limited
- FMC Technologies Inc
- Flowserve Corporation
- Mitsubishi Heavy Industries Ltd
- Doosan Group
- List Not Exhaustive
Notable Milestones in Oil & Gas Static and Rotating Equipment Market Sector
- January 2023: Baker Hughes supplied API-6A compliant valves to the Mero-3 FPSO in Brazil, capable of withstanding pressures up to 15,000 psi. This highlights the demand for high-pressure, high-performance equipment in deepwater projects.
- August 2023: Vitherm secured an order for a C276 heat exchanger from a major US oil and gas company. This demonstrates the ongoing need for efficient and compact heat exchangers in the industry.
In-Depth Oil & Gas Static and Rotating Equipment Market Market Outlook
The Oil & Gas Static and Rotating Equipment market is poised for continued growth, driven by sustained demand from the energy sector and ongoing technological advancements. Strategic opportunities lie in focusing on sustainable solutions, digitalization initiatives, and expanding into emerging markets. The long-term outlook remains positive, with significant potential for market expansion and innovation.
Oil & Gas Static And Rotating Equipment Market Segmentation
-
1. Application
- 1.1. Upstream
- 1.2. Midstream
- 1.3. Downstream
-
2. Type
- 2.1. Static
- 2.2. Rotating
Oil & Gas Static And Rotating Equipment Market Segmentation By Geography
-
1. North America
- 1.1. United States
- 1.2. Canada
- 1.3. Rest of North America
-
2. Europe
- 2.1. Germany
- 2.2. France
- 2.3. United Kingdom
- 2.4. Spain
- 2.5. Russia
- 2.6. NORDIC
- 2.7. Italy
- 2.8. Rest of Europe
-
3. Asia Pacific
- 3.1. China
- 3.2. India
- 3.3. Australia
- 3.4. Japan
- 3.5. Malaysia
- 3.6. Thailand
- 3.7. Indonesia
- 3.8. Vietnam
- 3.9. Rest of Asia Pacific
-
4. Middle East and Africa
- 4.1. Saudi Arabia
- 4.2. United Arab Emirates
- 4.3. Egypt
- 4.4. Qatar
- 4.5. Nigeria
- 4.6. South Africa
- 4.7. Rest of Middle East and Africa
-
5. South America
- 5.1. Brazil
- 5.2. Argentina
- 5.3. Colombia
- 5.4. Rest of South America
Oil & Gas Static And Rotating Equipment Market REPORT HIGHLIGHTS
| Aspects | Details |
|---|---|
| Study Period | 2019-2033 |
| Base Year | 2024 |
| Estimated Year | 2025 |
| Forecast Period | 2025-2033 |
| Historical Period | 2019-2024 |
| Growth Rate | CAGR of 3.91% from 2019-2033 |
| Segmentation |
|
Table of Contents
- 1. Introduction
- 1.1. Research Scope
- 1.2. Market Segmentation
- 1.3. Research Methodology
- 1.4. Definitions and Assumptions
- 2. Executive Summary
- 2.1. Introduction
- 3. Market Dynamics
- 3.1. Introduction
- 3.2. Market Drivers
- 3.2.1. 4.; Increasing Energy Demand4.; More Offshore Exploration Activities
- 3.3. Market Restrains
- 3.3.1. 4.; Increasing Energy Demand4.; More Offshore Exploration Activities
- 3.4. Market Trends
- 3.4.1. The Rotating Equipment Segment is Expected to Have a Significant Demand
- 4. Market Factor Analysis
- 4.1. Porters Five Forces
- 4.2. Supply/Value Chain
- 4.3. PESTEL analysis
- 4.4. Market Entropy
- 4.5. Patent/Trademark Analysis
- 5. Global Oil & Gas Static And Rotating Equipment Market Analysis, Insights and Forecast, 2019-2031
- 5.1. Market Analysis, Insights and Forecast - by Application
- 5.1.1. Upstream
- 5.1.2. Midstream
- 5.1.3. Downstream
- 5.2. Market Analysis, Insights and Forecast - by Type
- 5.2.1. Static
- 5.2.2. Rotating
- 5.3. Market Analysis, Insights and Forecast - by Region
- 5.3.1. North America
- 5.3.2. Europe
- 5.3.3. Asia Pacific
- 5.3.4. Middle East and Africa
- 5.3.5. South America
- 5.1. Market Analysis, Insights and Forecast - by Application
- 6. North America Oil & Gas Static And Rotating Equipment Market Analysis, Insights and Forecast, 2019-2031
- 6.1. Market Analysis, Insights and Forecast - by Application
- 6.1.1. Upstream
- 6.1.2. Midstream
- 6.1.3. Downstream
- 6.2. Market Analysis, Insights and Forecast - by Type
- 6.2.1. Static
- 6.2.2. Rotating
- 6.1. Market Analysis, Insights and Forecast - by Application
- 7. Europe Oil & Gas Static And Rotating Equipment Market Analysis, Insights and Forecast, 2019-2031
- 7.1. Market Analysis, Insights and Forecast - by Application
- 7.1.1. Upstream
- 7.1.2. Midstream
- 7.1.3. Downstream
- 7.2. Market Analysis, Insights and Forecast - by Type
- 7.2.1. Static
- 7.2.2. Rotating
- 7.1. Market Analysis, Insights and Forecast - by Application
- 8. Asia Pacific Oil & Gas Static And Rotating Equipment Market Analysis, Insights and Forecast, 2019-2031
- 8.1. Market Analysis, Insights and Forecast - by Application
- 8.1.1. Upstream
- 8.1.2. Midstream
- 8.1.3. Downstream
- 8.2. Market Analysis, Insights and Forecast - by Type
- 8.2.1. Static
- 8.2.2. Rotating
- 8.1. Market Analysis, Insights and Forecast - by Application
- 9. Middle East and Africa Oil & Gas Static And Rotating Equipment Market Analysis, Insights and Forecast, 2019-2031
- 9.1. Market Analysis, Insights and Forecast - by Application
- 9.1.1. Upstream
- 9.1.2. Midstream
- 9.1.3. Downstream
- 9.2. Market Analysis, Insights and Forecast - by Type
- 9.2.1. Static
- 9.2.2. Rotating
- 9.1. Market Analysis, Insights and Forecast - by Application
- 10. South America Oil & Gas Static And Rotating Equipment Market Analysis, Insights and Forecast, 2019-2031
- 10.1. Market Analysis, Insights and Forecast - by Application
- 10.1.1. Upstream
- 10.1.2. Midstream
- 10.1.3. Downstream
- 10.2. Market Analysis, Insights and Forecast - by Type
- 10.2.1. Static
- 10.2.2. Rotating
- 10.1. Market Analysis, Insights and Forecast - by Application
- 11. Competitive Analysis
- 11.1. Global Market Share Analysis 2024
- 11.2. Company Profiles
- 11.2.1 Alfa Laval AB
- 11.2.1.1. Overview
- 11.2.1.2. Products
- 11.2.1.3. SWOT Analysis
- 11.2.1.4. Recent Developments
- 11.2.1.5. Financials (Based on Availability)
- 11.2.2 Atlas Copco AB
- 11.2.2.1. Overview
- 11.2.2.2. Products
- 11.2.2.3. SWOT Analysis
- 11.2.2.4. Recent Developments
- 11.2.2.5. Financials (Based on Availability)
- 11.2.3 General Electric Co
- 11.2.3.1. Overview
- 11.2.3.2. Products
- 11.2.3.3. SWOT Analysis
- 11.2.3.4. Recent Developments
- 11.2.3.5. Financials (Based on Availability)
- 11.2.4 Baker Hughes Co
- 11.2.4.1. Overview
- 11.2.4.2. Products
- 11.2.4.3. SWOT Analysis
- 11.2.4.4. Recent Developments
- 11.2.4.5. Financials (Based on Availability)
- 11.2.5 Pentair PLC
- 11.2.5.1. Overview
- 11.2.5.2. Products
- 11.2.5.3. SWOT Analysis
- 11.2.5.4. Recent Developments
- 11.2.5.5. Financials (Based on Availability)
- 11.2.6 Siemens AG
- 11.2.6.1. Overview
- 11.2.6.2. Products
- 11.2.6.3. SWOT Analysis
- 11.2.6.4. Recent Developments
- 11.2.6.5. Financials (Based on Availability)
- 11.2.7 Sulzer Limited
- 11.2.7.1. Overview
- 11.2.7.2. Products
- 11.2.7.3. SWOT Analysis
- 11.2.7.4. Recent Developments
- 11.2.7.5. Financials (Based on Availability)
- 11.2.8 FMC Technologies Inc
- 11.2.8.1. Overview
- 11.2.8.2. Products
- 11.2.8.3. SWOT Analysis
- 11.2.8.4. Recent Developments
- 11.2.8.5. Financials (Based on Availability)
- 11.2.9 Flowserve Corporation
- 11.2.9.1. Overview
- 11.2.9.2. Products
- 11.2.9.3. SWOT Analysis
- 11.2.9.4. Recent Developments
- 11.2.9.5. Financials (Based on Availability)
- 11.2.10 Mitsubishi heavy Industries Ltd
- 11.2.10.1. Overview
- 11.2.10.2. Products
- 11.2.10.3. SWOT Analysis
- 11.2.10.4. Recent Developments
- 11.2.10.5. Financials (Based on Availability)
- 11.2.11 Doosan Group*List Not Exhaustive 6 4 List of Other Prominent Companies6 5 Market RankingAnalysi
- 11.2.11.1. Overview
- 11.2.11.2. Products
- 11.2.11.3. SWOT Analysis
- 11.2.11.4. Recent Developments
- 11.2.11.5. Financials (Based on Availability)
- 11.2.1 Alfa Laval AB
List of Figures
- Figure 1: Global Oil & Gas Static And Rotating Equipment Market Revenue Breakdown (Million, %) by Region 2024 & 2032
- Figure 2: Global Oil & Gas Static And Rotating Equipment Market Volume Breakdown (Billion, %) by Region 2024 & 2032
- Figure 3: North America Oil & Gas Static And Rotating Equipment Market Revenue (Million), by Application 2024 & 2032
- Figure 4: North America Oil & Gas Static And Rotating Equipment Market Volume (Billion), by Application 2024 & 2032
- Figure 5: North America Oil & Gas Static And Rotating Equipment Market Revenue Share (%), by Application 2024 & 2032
- Figure 6: North America Oil & Gas Static And Rotating Equipment Market Volume Share (%), by Application 2024 & 2032
- Figure 7: North America Oil & Gas Static And Rotating Equipment Market Revenue (Million), by Type 2024 & 2032
- Figure 8: North America Oil & Gas Static And Rotating Equipment Market Volume (Billion), by Type 2024 & 2032
- Figure 9: North America Oil & Gas Static And Rotating Equipment Market Revenue Share (%), by Type 2024 & 2032
- Figure 10: North America Oil & Gas Static And Rotating Equipment Market Volume Share (%), by Type 2024 & 2032
- Figure 11: North America Oil & Gas Static And Rotating Equipment Market Revenue (Million), by Country 2024 & 2032
- Figure 12: North America Oil & Gas Static And Rotating Equipment Market Volume (Billion), by Country 2024 & 2032
- Figure 13: North America Oil & Gas Static And Rotating Equipment Market Revenue Share (%), by Country 2024 & 2032
- Figure 14: North America Oil & Gas Static And Rotating Equipment Market Volume Share (%), by Country 2024 & 2032
- Figure 15: Europe Oil & Gas Static And Rotating Equipment Market Revenue (Million), by Application 2024 & 2032
- Figure 16: Europe Oil & Gas Static And Rotating Equipment Market Volume (Billion), by Application 2024 & 2032
- Figure 17: Europe Oil & Gas Static And Rotating Equipment Market Revenue Share (%), by Application 2024 & 2032
- Figure 18: Europe Oil & Gas Static And Rotating Equipment Market Volume Share (%), by Application 2024 & 2032
- Figure 19: Europe Oil & Gas Static And Rotating Equipment Market Revenue (Million), by Type 2024 & 2032
- Figure 20: Europe Oil & Gas Static And Rotating Equipment Market Volume (Billion), by Type 2024 & 2032
- Figure 21: Europe Oil & Gas Static And Rotating Equipment Market Revenue Share (%), by Type 2024 & 2032
- Figure 22: Europe Oil & Gas Static And Rotating Equipment Market Volume Share (%), by Type 2024 & 2032
- Figure 23: Europe Oil & Gas Static And Rotating Equipment Market Revenue (Million), by Country 2024 & 2032
- Figure 24: Europe Oil & Gas Static And Rotating Equipment Market Volume (Billion), by Country 2024 & 2032
- Figure 25: Europe Oil & Gas Static And Rotating Equipment Market Revenue Share (%), by Country 2024 & 2032
- Figure 26: Europe Oil & Gas Static And Rotating Equipment Market Volume Share (%), by Country 2024 & 2032
- Figure 27: Asia Pacific Oil & Gas Static And Rotating Equipment Market Revenue (Million), by Application 2024 & 2032
- Figure 28: Asia Pacific Oil & Gas Static And Rotating Equipment Market Volume (Billion), by Application 2024 & 2032
- Figure 29: Asia Pacific Oil & Gas Static And Rotating Equipment Market Revenue Share (%), by Application 2024 & 2032
- Figure 30: Asia Pacific Oil & Gas Static And Rotating Equipment Market Volume Share (%), by Application 2024 & 2032
- Figure 31: Asia Pacific Oil & Gas Static And Rotating Equipment Market Revenue (Million), by Type 2024 & 2032
- Figure 32: Asia Pacific Oil & Gas Static And Rotating Equipment Market Volume (Billion), by Type 2024 & 2032
- Figure 33: Asia Pacific Oil & Gas Static And Rotating Equipment Market Revenue Share (%), by Type 2024 & 2032
- Figure 34: Asia Pacific Oil & Gas Static And Rotating Equipment Market Volume Share (%), by Type 2024 & 2032
- Figure 35: Asia Pacific Oil & Gas Static And Rotating Equipment Market Revenue (Million), by Country 2024 & 2032
- Figure 36: Asia Pacific Oil & Gas Static And Rotating Equipment Market Volume (Billion), by Country 2024 & 2032
- Figure 37: Asia Pacific Oil & Gas Static And Rotating Equipment Market Revenue Share (%), by Country 2024 & 2032
- Figure 38: Asia Pacific Oil & Gas Static And Rotating Equipment Market Volume Share (%), by Country 2024 & 2032
- Figure 39: Middle East and Africa Oil & Gas Static And Rotating Equipment Market Revenue (Million), by Application 2024 & 2032
- Figure 40: Middle East and Africa Oil & Gas Static And Rotating Equipment Market Volume (Billion), by Application 2024 & 2032
- Figure 41: Middle East and Africa Oil & Gas Static And Rotating Equipment Market Revenue Share (%), by Application 2024 & 2032
- Figure 42: Middle East and Africa Oil & Gas Static And Rotating Equipment Market Volume Share (%), by Application 2024 & 2032
- Figure 43: Middle East and Africa Oil & Gas Static And Rotating Equipment Market Revenue (Million), by Type 2024 & 2032
- Figure 44: Middle East and Africa Oil & Gas Static And Rotating Equipment Market Volume (Billion), by Type 2024 & 2032
- Figure 45: Middle East and Africa Oil & Gas Static And Rotating Equipment Market Revenue Share (%), by Type 2024 & 2032
- Figure 46: Middle East and Africa Oil & Gas Static And Rotating Equipment Market Volume Share (%), by Type 2024 & 2032
- Figure 47: Middle East and Africa Oil & Gas Static And Rotating Equipment Market Revenue (Million), by Country 2024 & 2032
- Figure 48: Middle East and Africa Oil & Gas Static And Rotating Equipment Market Volume (Billion), by Country 2024 & 2032
- Figure 49: Middle East and Africa Oil & Gas Static And Rotating Equipment Market Revenue Share (%), by Country 2024 & 2032
- Figure 50: Middle East and Africa Oil & Gas Static And Rotating Equipment Market Volume Share (%), by Country 2024 & 2032
- Figure 51: South America Oil & Gas Static And Rotating Equipment Market Revenue (Million), by Application 2024 & 2032
- Figure 52: South America Oil & Gas Static And Rotating Equipment Market Volume (Billion), by Application 2024 & 2032
- Figure 53: South America Oil & Gas Static And Rotating Equipment Market Revenue Share (%), by Application 2024 & 2032
- Figure 54: South America Oil & Gas Static And Rotating Equipment Market Volume Share (%), by Application 2024 & 2032
- Figure 55: South America Oil & Gas Static And Rotating Equipment Market Revenue (Million), by Type 2024 & 2032
- Figure 56: South America Oil & Gas Static And Rotating Equipment Market Volume (Billion), by Type 2024 & 2032
- Figure 57: South America Oil & Gas Static And Rotating Equipment Market Revenue Share (%), by Type 2024 & 2032
- Figure 58: South America Oil & Gas Static And Rotating Equipment Market Volume Share (%), by Type 2024 & 2032
- Figure 59: South America Oil & Gas Static And Rotating Equipment Market Revenue (Million), by Country 2024 & 2032
- Figure 60: South America Oil & Gas Static And Rotating Equipment Market Volume (Billion), by Country 2024 & 2032
- Figure 61: South America Oil & Gas Static And Rotating Equipment Market Revenue Share (%), by Country 2024 & 2032
- Figure 62: South America Oil & Gas Static And Rotating Equipment Market Volume Share (%), by Country 2024 & 2032
List of Tables
- Table 1: Global Oil & Gas Static And Rotating Equipment Market Revenue Million Forecast, by Region 2019 & 2032
- Table 2: Global Oil & Gas Static And Rotating Equipment Market Volume Billion Forecast, by Region 2019 & 2032
- Table 3: Global Oil & Gas Static And Rotating Equipment Market Revenue Million Forecast, by Application 2019 & 2032
- Table 4: Global Oil & Gas Static And Rotating Equipment Market Volume Billion Forecast, by Application 2019 & 2032
- Table 5: Global Oil & Gas Static And Rotating Equipment Market Revenue Million Forecast, by Type 2019 & 2032
- Table 6: Global Oil & Gas Static And Rotating Equipment Market Volume Billion Forecast, by Type 2019 & 2032
- Table 7: Global Oil & Gas Static And Rotating Equipment Market Revenue Million Forecast, by Region 2019 & 2032
- Table 8: Global Oil & Gas Static And Rotating Equipment Market Volume Billion Forecast, by Region 2019 & 2032
- Table 9: Global Oil & Gas Static And Rotating Equipment Market Revenue Million Forecast, by Application 2019 & 2032
- Table 10: Global Oil & Gas Static And Rotating Equipment Market Volume Billion Forecast, by Application 2019 & 2032
- Table 11: Global Oil & Gas Static And Rotating Equipment Market Revenue Million Forecast, by Type 2019 & 2032
- Table 12: Global Oil & Gas Static And Rotating Equipment Market Volume Billion Forecast, by Type 2019 & 2032
- Table 13: Global Oil & Gas Static And Rotating Equipment Market Revenue Million Forecast, by Country 2019 & 2032
- Table 14: Global Oil & Gas Static And Rotating Equipment Market Volume Billion Forecast, by Country 2019 & 2032
- Table 15: United States Oil & Gas Static And Rotating Equipment Market Revenue (Million) Forecast, by Application 2019 & 2032
- Table 16: United States Oil & Gas Static And Rotating Equipment Market Volume (Billion) Forecast, by Application 2019 & 2032
- Table 17: Canada Oil & Gas Static And Rotating Equipment Market Revenue (Million) Forecast, by Application 2019 & 2032
- Table 18: Canada Oil & Gas Static And Rotating Equipment Market Volume (Billion) Forecast, by Application 2019 & 2032
- Table 19: Rest of North America Oil & Gas Static And Rotating Equipment Market Revenue (Million) Forecast, by Application 2019 & 2032
- Table 20: Rest of North America Oil & Gas Static And Rotating Equipment Market Volume (Billion) Forecast, by Application 2019 & 2032
- Table 21: Global Oil & Gas Static And Rotating Equipment Market Revenue Million Forecast, by Application 2019 & 2032
- Table 22: Global Oil & Gas Static And Rotating Equipment Market Volume Billion Forecast, by Application 2019 & 2032
- Table 23: Global Oil & Gas Static And Rotating Equipment Market Revenue Million Forecast, by Type 2019 & 2032
- Table 24: Global Oil & Gas Static And Rotating Equipment Market Volume Billion Forecast, by Type 2019 & 2032
- Table 25: Global Oil & Gas Static And Rotating Equipment Market Revenue Million Forecast, by Country 2019 & 2032
- Table 26: Global Oil & Gas Static And Rotating Equipment Market Volume Billion Forecast, by Country 2019 & 2032
- Table 27: Germany Oil & Gas Static And Rotating Equipment Market Revenue (Million) Forecast, by Application 2019 & 2032
- Table 28: Germany Oil & Gas Static And Rotating Equipment Market Volume (Billion) Forecast, by Application 2019 & 2032
- Table 29: France Oil & Gas Static And Rotating Equipment Market Revenue (Million) Forecast, by Application 2019 & 2032
- Table 30: France Oil & Gas Static And Rotating Equipment Market Volume (Billion) Forecast, by Application 2019 & 2032
- Table 31: United Kingdom Oil & Gas Static And Rotating Equipment Market Revenue (Million) Forecast, by Application 2019 & 2032
- Table 32: United Kingdom Oil & Gas Static And Rotating Equipment Market Volume (Billion) Forecast, by Application 2019 & 2032
- Table 33: Spain Oil & Gas Static And Rotating Equipment Market Revenue (Million) Forecast, by Application 2019 & 2032
- Table 34: Spain Oil & Gas Static And Rotating Equipment Market Volume (Billion) Forecast, by Application 2019 & 2032
- Table 35: Russia Oil & Gas Static And Rotating Equipment Market Revenue (Million) Forecast, by Application 2019 & 2032
- Table 36: Russia Oil & Gas Static And Rotating Equipment Market Volume (Billion) Forecast, by Application 2019 & 2032
- Table 37: NORDIC Oil & Gas Static And Rotating Equipment Market Revenue (Million) Forecast, by Application 2019 & 2032
- Table 38: NORDIC Oil & Gas Static And Rotating Equipment Market Volume (Billion) Forecast, by Application 2019 & 2032
- Table 39: Italy Oil & Gas Static And Rotating Equipment Market Revenue (Million) Forecast, by Application 2019 & 2032
- Table 40: Italy Oil & Gas Static And Rotating Equipment Market Volume (Billion) Forecast, by Application 2019 & 2032
- Table 41: Rest of Europe Oil & Gas Static And Rotating Equipment Market Revenue (Million) Forecast, by Application 2019 & 2032
- Table 42: Rest of Europe Oil & Gas Static And Rotating Equipment Market Volume (Billion) Forecast, by Application 2019 & 2032
- Table 43: Global Oil & Gas Static And Rotating Equipment Market Revenue Million Forecast, by Application 2019 & 2032
- Table 44: Global Oil & Gas Static And Rotating Equipment Market Volume Billion Forecast, by Application 2019 & 2032
- Table 45: Global Oil & Gas Static And Rotating Equipment Market Revenue Million Forecast, by Type 2019 & 2032
- Table 46: Global Oil & Gas Static And Rotating Equipment Market Volume Billion Forecast, by Type 2019 & 2032
- Table 47: Global Oil & Gas Static And Rotating Equipment Market Revenue Million Forecast, by Country 2019 & 2032
- Table 48: Global Oil & Gas Static And Rotating Equipment Market Volume Billion Forecast, by Country 2019 & 2032
- Table 49: China Oil & Gas Static And Rotating Equipment Market Revenue (Million) Forecast, by Application 2019 & 2032
- Table 50: China Oil & Gas Static And Rotating Equipment Market Volume (Billion) Forecast, by Application 2019 & 2032
- Table 51: India Oil & Gas Static And Rotating Equipment Market Revenue (Million) Forecast, by Application 2019 & 2032
- Table 52: India Oil & Gas Static And Rotating Equipment Market Volume (Billion) Forecast, by Application 2019 & 2032
- Table 53: Australia Oil & Gas Static And Rotating Equipment Market Revenue (Million) Forecast, by Application 2019 & 2032
- Table 54: Australia Oil & Gas Static And Rotating Equipment Market Volume (Billion) Forecast, by Application 2019 & 2032
- Table 55: Japan Oil & Gas Static And Rotating Equipment Market Revenue (Million) Forecast, by Application 2019 & 2032
- Table 56: Japan Oil & Gas Static And Rotating Equipment Market Volume (Billion) Forecast, by Application 2019 & 2032
- Table 57: Malaysia Oil & Gas Static And Rotating Equipment Market Revenue (Million) Forecast, by Application 2019 & 2032
- Table 58: Malaysia Oil & Gas Static And Rotating Equipment Market Volume (Billion) Forecast, by Application 2019 & 2032
- Table 59: Thailand Oil & Gas Static And Rotating Equipment Market Revenue (Million) Forecast, by Application 2019 & 2032
- Table 60: Thailand Oil & Gas Static And Rotating Equipment Market Volume (Billion) Forecast, by Application 2019 & 2032
- Table 61: Indonesia Oil & Gas Static And Rotating Equipment Market Revenue (Million) Forecast, by Application 2019 & 2032
- Table 62: Indonesia Oil & Gas Static And Rotating Equipment Market Volume (Billion) Forecast, by Application 2019 & 2032
- Table 63: Vietnam Oil & Gas Static And Rotating Equipment Market Revenue (Million) Forecast, by Application 2019 & 2032
- Table 64: Vietnam Oil & Gas Static And Rotating Equipment Market Volume (Billion) Forecast, by Application 2019 & 2032
- Table 65: Rest of Asia Pacific Oil & Gas Static And Rotating Equipment Market Revenue (Million) Forecast, by Application 2019 & 2032
- Table 66: Rest of Asia Pacific Oil & Gas Static And Rotating Equipment Market Volume (Billion) Forecast, by Application 2019 & 2032
- Table 67: Global Oil & Gas Static And Rotating Equipment Market Revenue Million Forecast, by Application 2019 & 2032
- Table 68: Global Oil & Gas Static And Rotating Equipment Market Volume Billion Forecast, by Application 2019 & 2032
- Table 69: Global Oil & Gas Static And Rotating Equipment Market Revenue Million Forecast, by Type 2019 & 2032
- Table 70: Global Oil & Gas Static And Rotating Equipment Market Volume Billion Forecast, by Type 2019 & 2032
- Table 71: Global Oil & Gas Static And Rotating Equipment Market Revenue Million Forecast, by Country 2019 & 2032
- Table 72: Global Oil & Gas Static And Rotating Equipment Market Volume Billion Forecast, by Country 2019 & 2032
- Table 73: Saudi Arabia Oil & Gas Static And Rotating Equipment Market Revenue (Million) Forecast, by Application 2019 & 2032
- Table 74: Saudi Arabia Oil & Gas Static And Rotating Equipment Market Volume (Billion) Forecast, by Application 2019 & 2032
- Table 75: United Arab Emirates Oil & Gas Static And Rotating Equipment Market Revenue (Million) Forecast, by Application 2019 & 2032
- Table 76: United Arab Emirates Oil & Gas Static And Rotating Equipment Market Volume (Billion) Forecast, by Application 2019 & 2032
- Table 77: Egypt Oil & Gas Static And Rotating Equipment Market Revenue (Million) Forecast, by Application 2019 & 2032
- Table 78: Egypt Oil & Gas Static And Rotating Equipment Market Volume (Billion) Forecast, by Application 2019 & 2032
- Table 79: Qatar Oil & Gas Static And Rotating Equipment Market Revenue (Million) Forecast, by Application 2019 & 2032
- Table 80: Qatar Oil & Gas Static And Rotating Equipment Market Volume (Billion) Forecast, by Application 2019 & 2032
- Table 81: Nigeria Oil & Gas Static And Rotating Equipment Market Revenue (Million) Forecast, by Application 2019 & 2032
- Table 82: Nigeria Oil & Gas Static And Rotating Equipment Market Volume (Billion) Forecast, by Application 2019 & 2032
- Table 83: South Africa Oil & Gas Static And Rotating Equipment Market Revenue (Million) Forecast, by Application 2019 & 2032
- Table 84: South Africa Oil & Gas Static And Rotating Equipment Market Volume (Billion) Forecast, by Application 2019 & 2032
- Table 85: Rest of Middle East and Africa Oil & Gas Static And Rotating Equipment Market Revenue (Million) Forecast, by Application 2019 & 2032
- Table 86: Rest of Middle East and Africa Oil & Gas Static And Rotating Equipment Market Volume (Billion) Forecast, by Application 2019 & 2032
- Table 87: Global Oil & Gas Static And Rotating Equipment Market Revenue Million Forecast, by Application 2019 & 2032
- Table 88: Global Oil & Gas Static And Rotating Equipment Market Volume Billion Forecast, by Application 2019 & 2032
- Table 89: Global Oil & Gas Static And Rotating Equipment Market Revenue Million Forecast, by Type 2019 & 2032
- Table 90: Global Oil & Gas Static And Rotating Equipment Market Volume Billion Forecast, by Type 2019 & 2032
- Table 91: Global Oil & Gas Static And Rotating Equipment Market Revenue Million Forecast, by Country 2019 & 2032
- Table 92: Global Oil & Gas Static And Rotating Equipment Market Volume Billion Forecast, by Country 2019 & 2032
- Table 93: Brazil Oil & Gas Static And Rotating Equipment Market Revenue (Million) Forecast, by Application 2019 & 2032
- Table 94: Brazil Oil & Gas Static And Rotating Equipment Market Volume (Billion) Forecast, by Application 2019 & 2032
- Table 95: Argentina Oil & Gas Static And Rotating Equipment Market Revenue (Million) Forecast, by Application 2019 & 2032
- Table 96: Argentina Oil & Gas Static And Rotating Equipment Market Volume (Billion) Forecast, by Application 2019 & 2032
- Table 97: Colombia Oil & Gas Static And Rotating Equipment Market Revenue (Million) Forecast, by Application 2019 & 2032
- Table 98: Colombia Oil & Gas Static And Rotating Equipment Market Volume (Billion) Forecast, by Application 2019 & 2032
- Table 99: Rest of South America Oil & Gas Static And Rotating Equipment Market Revenue (Million) Forecast, by Application 2019 & 2032
- Table 100: Rest of South America Oil & Gas Static And Rotating Equipment Market Volume (Billion) Forecast, by Application 2019 & 2032
Frequently Asked Questions
1. What is the projected Compound Annual Growth Rate (CAGR) of the Oil & Gas Static And Rotating Equipment Market?
The projected CAGR is approximately 3.91%.
2. Which companies are prominent players in the Oil & Gas Static And Rotating Equipment Market?
Key companies in the market include Alfa Laval AB, Atlas Copco AB, General Electric Co, Baker Hughes Co, Pentair PLC, Siemens AG, Sulzer Limited, FMC Technologies Inc, Flowserve Corporation, Mitsubishi heavy Industries Ltd, Doosan Group*List Not Exhaustive 6 4 List of Other Prominent Companies6 5 Market RankingAnalysi.
3. What are the main segments of the Oil & Gas Static And Rotating Equipment Market?
The market segments include Application, Type.
4. Can you provide details about the market size?
The market size is estimated to be USD 23.20 Million as of 2022.
5. What are some drivers contributing to market growth?
4.; Increasing Energy Demand4.; More Offshore Exploration Activities.
6. What are the notable trends driving market growth?
The Rotating Equipment Segment is Expected to Have a Significant Demand.
7. Are there any restraints impacting market growth?
4.; Increasing Energy Demand4.; More Offshore Exploration Activities.
8. Can you provide examples of recent developments in the market?
January 2023: Baker Hughes provided forged duplex stainless steel valves to Mero-3 FPSO in Brazil. The supply equipment is API-6A compliant and capable of working pressures up to 15,000 psi. The company provided these valves after they were designed, manufactured, and tested with successful first-pass yield.August 2023: Vitherm got an order from a renowned oil and gas company in the United States for the supply of a C276 heat exchanger. The company's heat exchangers are compact, highly efficient, and provide good heat transfer capabilities while minimizing the required footprint.
9. What pricing options are available for accessing the report?
Pricing options include single-user, multi-user, and enterprise licenses priced at USD 4750, USD 5250, and USD 8750 respectively.
10. Is the market size provided in terms of value or volume?
The market size is provided in terms of value, measured in Million and volume, measured in Billion.
11. Are there any specific market keywords associated with the report?
Yes, the market keyword associated with the report is "Oil & Gas Static And Rotating Equipment Market," which aids in identifying and referencing the specific market segment covered.
12. How do I determine which pricing option suits my needs best?
The pricing options vary based on user requirements and access needs. Individual users may opt for single-user licenses, while businesses requiring broader access may choose multi-user or enterprise licenses for cost-effective access to the report.
13. Are there any additional resources or data provided in the Oil & Gas Static And Rotating Equipment Market report?
While the report offers comprehensive insights, it's advisable to review the specific contents or supplementary materials provided to ascertain if additional resources or data are available.
14. How can I stay updated on further developments or reports in the Oil & Gas Static And Rotating Equipment Market?
To stay informed about further developments, trends, and reports in the Oil & Gas Static And Rotating Equipment Market, consider subscribing to industry newsletters, following relevant companies and organizations, or regularly checking reputable industry news sources and publications.
Methodology
Step 1 - Identification of Relevant Samples Size from Population Database


Step 2 - Approaches for Defining Global Market Size (Value, Volume* & Price*)

Note*: In applicable scenarios
Step 3 - Data Sources
Primary Research
- Web Analytics
- Survey Reports
- Research Institute
- Latest Research Reports
- Opinion Leaders
Secondary Research
- Annual Reports
- White Paper
- Latest Press Release
- Industry Association
- Paid Database
- Investor Presentations

Step 4 - Data Triangulation
Involves using different sources of information in order to increase the validity of a study
These sources are likely to be stakeholders in a program - participants, other researchers, program staff, other community members, and so on.
Then we put all data in single framework & apply various statistical tools to find out the dynamic on the market.
During the analysis stage, feedback from the stakeholder groups would be compared to determine areas of agreement as well as areas of divergence


