
Key Insights
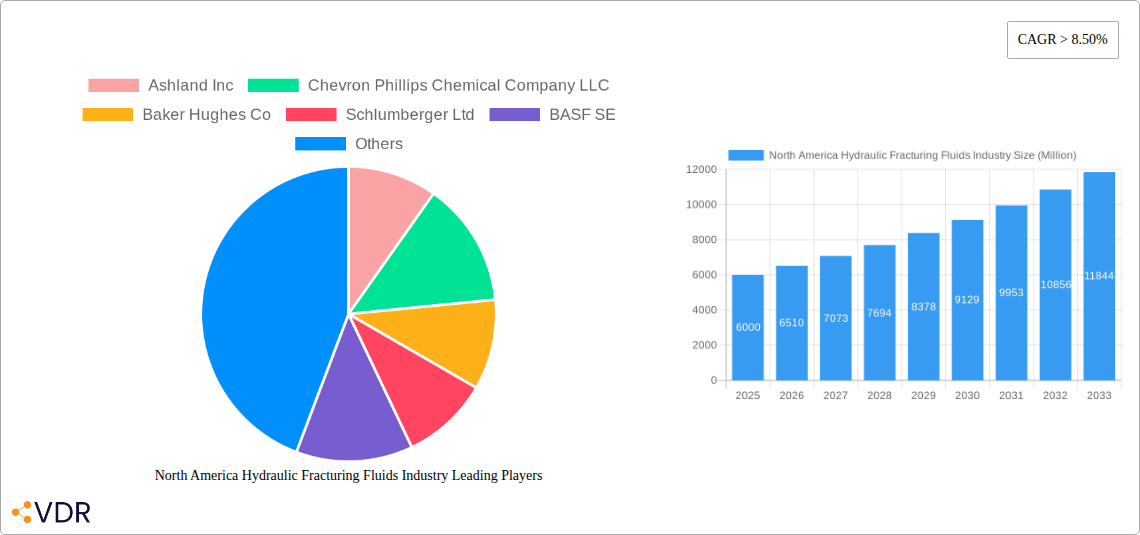
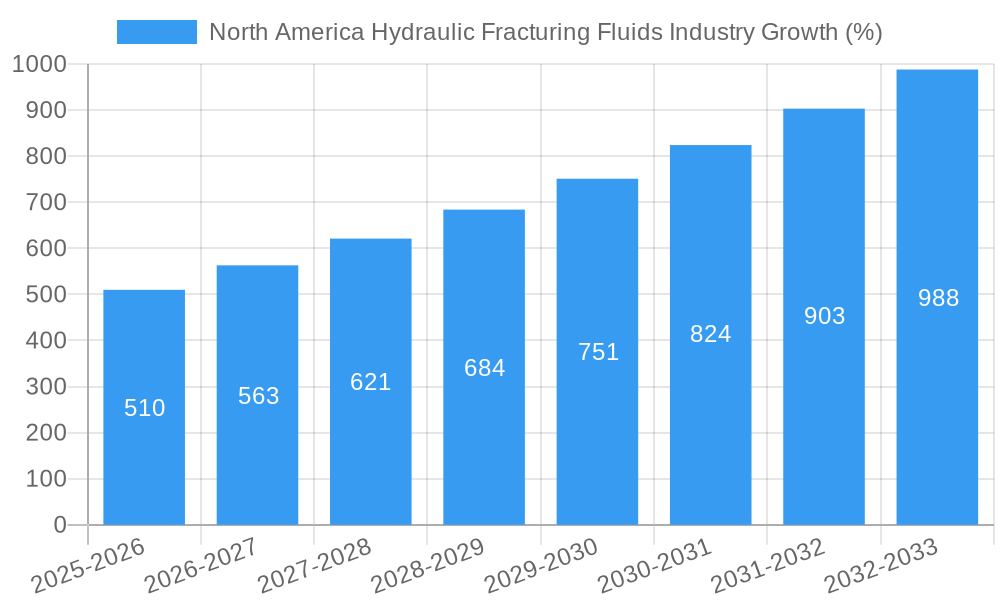
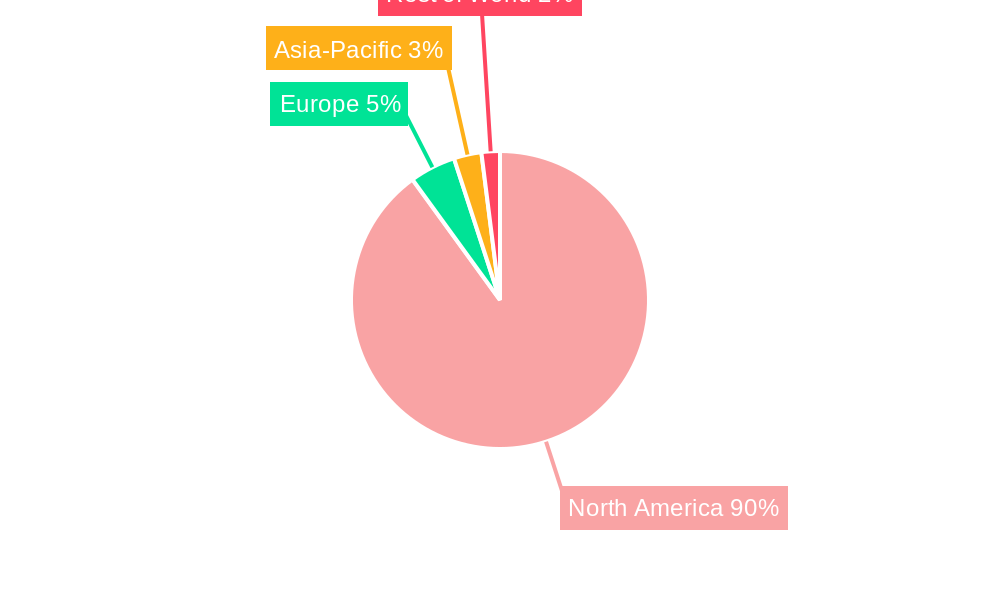
The North America hydraulic fracturing fluids market, valued at approximately $6 billion in 2025, is projected to experience robust growth, exhibiting a Compound Annual Growth Rate (CAGR) exceeding 8.5% from 2025 to 2033. This expansion is primarily driven by the sustained demand for shale gas and oil extraction in the region, particularly in the United States. The increasing adoption of horizontal drilling techniques, coupled with advancements in fluid technology focusing on environmentally friendly and efficient slick water-based fluids, further fuels market growth. The segment encompassing slick water-based fluids holds a significant market share, owing to its cost-effectiveness and relatively lower environmental impact compared to oil-based alternatives. However, stringent environmental regulations and concerns regarding water scarcity pose challenges to market expansion. Furthermore, fluctuations in oil and gas prices can impact the overall demand for hydraulic fracturing fluids, creating some degree of market uncertainty. Major players like Ashland Inc., Baker Hughes, Schlumberger, and Halliburton are actively involved in innovation, mergers, and acquisitions, to strengthen their market positions and cater to the evolving needs of the industry. The growth is expected to be geographically concentrated in the United States, driven by its vast shale reserves and robust energy production activities. Canada and Mexico will contribute to regional growth, but to a lesser extent than the US.
The forecast period (2025-2033) anticipates continued market expansion, propelled by ongoing exploration and production activities. Technological advancements in fluid formulations, aimed at improving efficiency and minimizing environmental impact, will continue to shape the market landscape. Companies are focusing on developing environmentally sustainable solutions to meet increasingly stringent regulations. Competition among major players will intensify, leading to price adjustments and strategic partnerships. Long-term projections depend significantly on government policies, energy pricing, and the overall health of the North American oil and gas sector. Nevertheless, the forecast suggests that the market will maintain a strong growth trajectory, solidifying its position as a crucial component of the region's energy production ecosystem.
North America Hydraulic Fracturing Fluids Industry Market Report: 2019-2033
This comprehensive report provides an in-depth analysis of the North America hydraulic fracturing fluids market, offering invaluable insights for industry professionals, investors, and stakeholders. The study covers the period from 2019 to 2033, with 2025 serving as the base and estimated year. The report meticulously examines market dynamics, growth trends, dominant segments, and key players, providing a complete picture of this crucial energy sector. The market is segmented by Well Type (Horizontal, Vertical) and Fluid Type (Slick Water-based Fluid, Foam-based Fluid, Gelled Oil-based Fluid, Other Base Fluids). The total market size in 2025 is estimated at $XX Million.
Keywords: Hydraulic Fracturing Fluids, North America, Fracking Fluids, Slickwater, Oil & Gas, Shale Gas, Horizontal Drilling, Vertical Drilling, Market Analysis, Market Forecast, Industry Report, Ashland Inc, Chevron Phillips Chemical, Baker Hughes, Schlumberger, BASF, DuPont, Halliburton, Akzonobel, Clariant, Calfrac Well Services.
North America Hydraulic Fracturing Fluids Industry Market Dynamics & Structure
The North American hydraulic fracturing fluids market is characterized by moderate concentration, with a few major players holding significant market share. Technological innovation, particularly in environmentally friendly fluid formulations, is a key driver. Stringent environmental regulations and evolving safety standards significantly influence market dynamics. Competitive pressures are high, with companies focusing on cost optimization and differentiation through specialized fluid offerings. The market has witnessed several mergers and acquisitions (M&A) in recent years, reflecting consolidation trends. The number of M&A deals in the period 2019-2024 was xx.
- Market Concentration: Moderately concentrated, with the top 5 players holding approximately xx% market share in 2025.
- Technological Innovation: Focus on environmentally friendly fluids, improved efficiency, and reduced water usage.
- Regulatory Framework: Stringent environmental regulations impacting fluid composition and disposal methods.
- Competitive Substitutes: Limited substitutes, but ongoing research in alternative fracturing techniques.
- End-User Demographics: Primarily oil and gas exploration and production companies.
- M&A Trends: Consolidation continues, with larger players acquiring smaller specialized firms.
North America Hydraulic Fracturing Fluids Industry Growth Trends & Insights
The North American hydraulic fracturing fluids market experienced significant growth during the historical period (2019-2024), driven by increasing shale gas production and exploration activities. The market size grew from $XX Million in 2019 to $XX Million in 2024, exhibiting a CAGR of xx%. The forecast period (2025-2033) anticipates continued growth, albeit at a slightly moderated pace, driven by factors such as technological advancements, increasing demand for natural gas, and government support for energy independence. However, fluctuating oil and gas prices and environmental concerns pose potential challenges. Adoption rates of advanced fluid technologies are expected to rise, leading to a shift in market share towards more efficient and environmentally friendly products. Market penetration of slickwater-based fluids remains high, exceeding xx% in 2025.
Dominant Regions, Countries, or Segments in North America Hydraulic Fracturing Fluids Industry
The Permian Basin in the US remains the dominant region for hydraulic fracturing fluids consumption, accounting for approximately xx% of the market in 2025. This is largely attributed to its extensive shale gas reserves and high levels of exploration and production activity. Within fluid types, slickwater-based fluids dominate, holding over xx% market share in 2025 due to cost-effectiveness and performance. The horizontal well type accounts for the majority (xx%) of overall fluid demand, reflecting the industry's preference for maximizing extraction from shale formations.
- Key Drivers in the Permian Basin: Abundant shale gas reserves, supportive government policies, and robust infrastructure.
- Dominance of Slickwater-based Fluids: Cost-effectiveness and proven efficacy in shale formations.
- Horizontal Well Type Dominance: Maximizing extraction from shale gas formations.
North America Hydraulic Fracturing Fluids Industry Product Landscape
The product landscape is characterized by a range of fluid types tailored to specific well conditions and geological formations. Innovations focus on enhancing fluid performance, reducing environmental impact, and optimizing cost-effectiveness. Advanced formulations incorporate additives to enhance proppant transport, improve fracture conductivity, and minimize formation damage. Key performance metrics include fluid viscosity, proppant carrying capacity, and environmental impact. Unique selling propositions often center on reduced water usage, improved efficiency, and specialized additives targeting specific formation challenges.
Key Drivers, Barriers & Challenges in North America Hydraulic Fracturing Fluids Industry
Key Drivers: Increased shale gas exploration and production, technological advancements in fluid formulations, and government support for energy independence.
Challenges: Fluctuations in oil and gas prices, stringent environmental regulations, and increasing concerns about water usage and waste disposal. Supply chain disruptions can also impact availability and pricing, potentially affecting market growth. These disruptions accounted for a xx% decrease in production in 2022.
Emerging Opportunities in North America Hydraulic Fracturing Fluids Industry
Emerging opportunities lie in developing sustainable and environmentally friendly fracturing fluids, expanding into unconventional resource plays, and leveraging digital technologies to optimize fluid performance and reduce operational costs. Untapped markets exist in less-explored shale formations and emerging energy frontiers. The increasing demand for natural gas is pushing market participants to develop more sophisticated products and techniques.
Growth Accelerators in the North America Hydraulic Fracturing Fluids Industry
Technological breakthroughs in fluid chemistry, along with strategic partnerships among oilfield service companies and chemical manufacturers, are driving significant growth. Expansion into international markets and the adoption of innovative fracturing techniques further enhance the market's potential. Focusing on cost reduction and improving efficiency remains key for sustained growth.
Key Players Shaping the North America Hydraulic Fracturing Fluids Industry Market
- Ashland Inc
- Chevron Phillips Chemical Company LLC
- Baker Hughes Co
- Schlumberger Ltd
- BASF SE
- DuPont de Nemours Inc
- Halliburton Company
- Akzonobel NV
- Clariant International Ltd
- Calfrac Well Services Ltd
Notable Milestones in North America Hydraulic Fracturing Fluids Industry Sector
- 2020, Q2: Introduction of a new, eco-friendly fracturing fluid by Ashland Inc.
- 2021, Q4: Merger between two smaller fluid providers, leading to increased market consolidation.
- 2022, Q1: Significant investment in R&D for improved fluid efficiency by Schlumberger Ltd.
In-Depth North America Hydraulic Fracturing Fluids Industry Market Outlook
The North America hydraulic fracturing fluids market is poised for continued growth driven by ongoing exploration and production activities, particularly in shale gas formations. Strategic partnerships, technological innovations, and a focus on sustainability will shape the market's future. The market presents significant opportunities for companies focused on developing environmentally friendly, cost-effective, and high-performance fluids. The long-term outlook remains positive, with anticipated growth driven by technological advances and increasing demand for natural gas.
North America Hydraulic Fracturing Fluids Industry Segmentation
-
1. Well Type
- 1.1. Horizontal
- 1.2. Vertical
-
2. Fluid Type
- 2.1. Slick Water-based Fluid
- 2.2. Foam-based Fluid
- 2.3. Gelled Oil-based Fluid
- 2.4. Other Base Fluids
-
3. Geography
- 3.1. United States
- 3.2. Canada
- 3.3. Rest of North America
North America Hydraulic Fracturing Fluids Industry Segmentation By Geography
- 1. United States
- 2. Canada
- 3. Rest of North America
North America Hydraulic Fracturing Fluids Industry REPORT HIGHLIGHTS
| Aspects | Details |
|---|---|
| Study Period | 2019-2033 |
| Base Year | 2024 |
| Estimated Year | 2025 |
| Forecast Period | 2025-2033 |
| Historical Period | 2019-2024 |
| Growth Rate | CAGR of > 8.50% from 2019-2033 |
| Segmentation |
|
Table of Contents
- 1. Introduction
- 1.1. Research Scope
- 1.2. Market Segmentation
- 1.3. Research Methodology
- 1.4. Definitions and Assumptions
- 2. Executive Summary
- 2.1. Introduction
- 3. Market Dynamics
- 3.1. Introduction
- 3.2. Market Drivers
- 3.2.1. 4.; Presence of Strict Government Regulations to Control Air Pollution
- 3.3. Market Restrains
- 3.3.1. 4.; Increasing Adoption of Renewable Energy
- 3.4. Market Trends
- 3.4.1. Horizontal Wells to Dominate the Market
- 4. Market Factor Analysis
- 4.1. Porters Five Forces
- 4.2. Supply/Value Chain
- 4.3. PESTEL analysis
- 4.4. Market Entropy
- 4.5. Patent/Trademark Analysis
- 5. North America Hydraulic Fracturing Fluids Industry Analysis, Insights and Forecast, 2019-2031
- 5.1. Market Analysis, Insights and Forecast - by Well Type
- 5.1.1. Horizontal
- 5.1.2. Vertical
- 5.2. Market Analysis, Insights and Forecast - by Fluid Type
- 5.2.1. Slick Water-based Fluid
- 5.2.2. Foam-based Fluid
- 5.2.3. Gelled Oil-based Fluid
- 5.2.4. Other Base Fluids
- 5.3. Market Analysis, Insights and Forecast - by Geography
- 5.3.1. United States
- 5.3.2. Canada
- 5.3.3. Rest of North America
- 5.4. Market Analysis, Insights and Forecast - by Region
- 5.4.1. United States
- 5.4.2. Canada
- 5.4.3. Rest of North America
- 5.1. Market Analysis, Insights and Forecast - by Well Type
- 6. United States North America Hydraulic Fracturing Fluids Industry Analysis, Insights and Forecast, 2019-2031
- 6.1. Market Analysis, Insights and Forecast - by Well Type
- 6.1.1. Horizontal
- 6.1.2. Vertical
- 6.2. Market Analysis, Insights and Forecast - by Fluid Type
- 6.2.1. Slick Water-based Fluid
- 6.2.2. Foam-based Fluid
- 6.2.3. Gelled Oil-based Fluid
- 6.2.4. Other Base Fluids
- 6.3. Market Analysis, Insights and Forecast - by Geography
- 6.3.1. United States
- 6.3.2. Canada
- 6.3.3. Rest of North America
- 6.1. Market Analysis, Insights and Forecast - by Well Type
- 7. Canada North America Hydraulic Fracturing Fluids Industry Analysis, Insights and Forecast, 2019-2031
- 7.1. Market Analysis, Insights and Forecast - by Well Type
- 7.1.1. Horizontal
- 7.1.2. Vertical
- 7.2. Market Analysis, Insights and Forecast - by Fluid Type
- 7.2.1. Slick Water-based Fluid
- 7.2.2. Foam-based Fluid
- 7.2.3. Gelled Oil-based Fluid
- 7.2.4. Other Base Fluids
- 7.3. Market Analysis, Insights and Forecast - by Geography
- 7.3.1. United States
- 7.3.2. Canada
- 7.3.3. Rest of North America
- 7.1. Market Analysis, Insights and Forecast - by Well Type
- 8. Rest of North America North America Hydraulic Fracturing Fluids Industry Analysis, Insights and Forecast, 2019-2031
- 8.1. Market Analysis, Insights and Forecast - by Well Type
- 8.1.1. Horizontal
- 8.1.2. Vertical
- 8.2. Market Analysis, Insights and Forecast - by Fluid Type
- 8.2.1. Slick Water-based Fluid
- 8.2.2. Foam-based Fluid
- 8.2.3. Gelled Oil-based Fluid
- 8.2.4. Other Base Fluids
- 8.3. Market Analysis, Insights and Forecast - by Geography
- 8.3.1. United States
- 8.3.2. Canada
- 8.3.3. Rest of North America
- 8.1. Market Analysis, Insights and Forecast - by Well Type
- 9. United States North America Hydraulic Fracturing Fluids Industry Analysis, Insights and Forecast, 2019-2031
- 10. Canada North America Hydraulic Fracturing Fluids Industry Analysis, Insights and Forecast, 2019-2031
- 11. Mexico North America Hydraulic Fracturing Fluids Industry Analysis, Insights and Forecast, 2019-2031
- 12. Rest of North America North America Hydraulic Fracturing Fluids Industry Analysis, Insights and Forecast, 2019-2031
- 13. Competitive Analysis
- 13.1. Market Share Analysis 2024
- 13.2. Company Profiles
- 13.2.1 Ashland Inc
- 13.2.1.1. Overview
- 13.2.1.2. Products
- 13.2.1.3. SWOT Analysis
- 13.2.1.4. Recent Developments
- 13.2.1.5. Financials (Based on Availability)
- 13.2.2 Chevron Phillips Chemical Company LLC
- 13.2.2.1. Overview
- 13.2.2.2. Products
- 13.2.2.3. SWOT Analysis
- 13.2.2.4. Recent Developments
- 13.2.2.5. Financials (Based on Availability)
- 13.2.3 Baker Hughes Co
- 13.2.3.1. Overview
- 13.2.3.2. Products
- 13.2.3.3. SWOT Analysis
- 13.2.3.4. Recent Developments
- 13.2.3.5. Financials (Based on Availability)
- 13.2.4 Schlumberger Ltd
- 13.2.4.1. Overview
- 13.2.4.2. Products
- 13.2.4.3. SWOT Analysis
- 13.2.4.4. Recent Developments
- 13.2.4.5. Financials (Based on Availability)
- 13.2.5 BASF SE
- 13.2.5.1. Overview
- 13.2.5.2. Products
- 13.2.5.3. SWOT Analysis
- 13.2.5.4. Recent Developments
- 13.2.5.5. Financials (Based on Availability)
- 13.2.6 DuPont de Nemours Inc *List Not Exhaustive
- 13.2.6.1. Overview
- 13.2.6.2. Products
- 13.2.6.3. SWOT Analysis
- 13.2.6.4. Recent Developments
- 13.2.6.5. Financials (Based on Availability)
- 13.2.7 Halliburton Company
- 13.2.7.1. Overview
- 13.2.7.2. Products
- 13.2.7.3. SWOT Analysis
- 13.2.7.4. Recent Developments
- 13.2.7.5. Financials (Based on Availability)
- 13.2.8 Akzonobel NV
- 13.2.8.1. Overview
- 13.2.8.2. Products
- 13.2.8.3. SWOT Analysis
- 13.2.8.4. Recent Developments
- 13.2.8.5. Financials (Based on Availability)
- 13.2.9 Clariant International Ltd
- 13.2.9.1. Overview
- 13.2.9.2. Products
- 13.2.9.3. SWOT Analysis
- 13.2.9.4. Recent Developments
- 13.2.9.5. Financials (Based on Availability)
- 13.2.10 Calfrac Well Services Ltd
- 13.2.10.1. Overview
- 13.2.10.2. Products
- 13.2.10.3. SWOT Analysis
- 13.2.10.4. Recent Developments
- 13.2.10.5. Financials (Based on Availability)
- 13.2.1 Ashland Inc
List of Figures
- Figure 1: North America Hydraulic Fracturing Fluids Industry Revenue Breakdown (Million, %) by Product 2024 & 2032
- Figure 2: North America Hydraulic Fracturing Fluids Industry Share (%) by Company 2024
List of Tables
- Table 1: North America Hydraulic Fracturing Fluids Industry Revenue Million Forecast, by Region 2019 & 2032
- Table 2: North America Hydraulic Fracturing Fluids Industry Revenue Million Forecast, by Well Type 2019 & 2032
- Table 3: North America Hydraulic Fracturing Fluids Industry Revenue Million Forecast, by Fluid Type 2019 & 2032
- Table 4: North America Hydraulic Fracturing Fluids Industry Revenue Million Forecast, by Geography 2019 & 2032
- Table 5: North America Hydraulic Fracturing Fluids Industry Revenue Million Forecast, by Region 2019 & 2032
- Table 6: North America Hydraulic Fracturing Fluids Industry Revenue Million Forecast, by Country 2019 & 2032
- Table 7: United States North America Hydraulic Fracturing Fluids Industry Revenue (Million) Forecast, by Application 2019 & 2032
- Table 8: Canada North America Hydraulic Fracturing Fluids Industry Revenue (Million) Forecast, by Application 2019 & 2032
- Table 9: Mexico North America Hydraulic Fracturing Fluids Industry Revenue (Million) Forecast, by Application 2019 & 2032
- Table 10: Rest of North America North America Hydraulic Fracturing Fluids Industry Revenue (Million) Forecast, by Application 2019 & 2032
- Table 11: North America Hydraulic Fracturing Fluids Industry Revenue Million Forecast, by Well Type 2019 & 2032
- Table 12: North America Hydraulic Fracturing Fluids Industry Revenue Million Forecast, by Fluid Type 2019 & 2032
- Table 13: North America Hydraulic Fracturing Fluids Industry Revenue Million Forecast, by Geography 2019 & 2032
- Table 14: North America Hydraulic Fracturing Fluids Industry Revenue Million Forecast, by Country 2019 & 2032
- Table 15: North America Hydraulic Fracturing Fluids Industry Revenue Million Forecast, by Well Type 2019 & 2032
- Table 16: North America Hydraulic Fracturing Fluids Industry Revenue Million Forecast, by Fluid Type 2019 & 2032
- Table 17: North America Hydraulic Fracturing Fluids Industry Revenue Million Forecast, by Geography 2019 & 2032
- Table 18: North America Hydraulic Fracturing Fluids Industry Revenue Million Forecast, by Country 2019 & 2032
- Table 19: North America Hydraulic Fracturing Fluids Industry Revenue Million Forecast, by Well Type 2019 & 2032
- Table 20: North America Hydraulic Fracturing Fluids Industry Revenue Million Forecast, by Fluid Type 2019 & 2032
- Table 21: North America Hydraulic Fracturing Fluids Industry Revenue Million Forecast, by Geography 2019 & 2032
- Table 22: North America Hydraulic Fracturing Fluids Industry Revenue Million Forecast, by Country 2019 & 2032
Frequently Asked Questions
1. What is the projected Compound Annual Growth Rate (CAGR) of the North America Hydraulic Fracturing Fluids Industry?
The projected CAGR is approximately > 8.50%.
2. Which companies are prominent players in the North America Hydraulic Fracturing Fluids Industry?
Key companies in the market include Ashland Inc, Chevron Phillips Chemical Company LLC, Baker Hughes Co, Schlumberger Ltd, BASF SE, DuPont de Nemours Inc *List Not Exhaustive, Halliburton Company, Akzonobel NV, Clariant International Ltd, Calfrac Well Services Ltd.
3. What are the main segments of the North America Hydraulic Fracturing Fluids Industry?
The market segments include Well Type, Fluid Type, Geography.
4. Can you provide details about the market size?
The market size is estimated to be USD XX Million as of 2022.
5. What are some drivers contributing to market growth?
4.; Presence of Strict Government Regulations to Control Air Pollution.
6. What are the notable trends driving market growth?
Horizontal Wells to Dominate the Market.
7. Are there any restraints impacting market growth?
4.; Increasing Adoption of Renewable Energy.
8. Can you provide examples of recent developments in the market?
N/A
9. What pricing options are available for accessing the report?
Pricing options include single-user, multi-user, and enterprise licenses priced at USD 4750, USD 5250, and USD 8750 respectively.
10. Is the market size provided in terms of value or volume?
The market size is provided in terms of value, measured in Million.
11. Are there any specific market keywords associated with the report?
Yes, the market keyword associated with the report is "North America Hydraulic Fracturing Fluids Industry," which aids in identifying and referencing the specific market segment covered.
12. How do I determine which pricing option suits my needs best?
The pricing options vary based on user requirements and access needs. Individual users may opt for single-user licenses, while businesses requiring broader access may choose multi-user or enterprise licenses for cost-effective access to the report.
13. Are there any additional resources or data provided in the North America Hydraulic Fracturing Fluids Industry report?
While the report offers comprehensive insights, it's advisable to review the specific contents or supplementary materials provided to ascertain if additional resources or data are available.
14. How can I stay updated on further developments or reports in the North America Hydraulic Fracturing Fluids Industry?
To stay informed about further developments, trends, and reports in the North America Hydraulic Fracturing Fluids Industry, consider subscribing to industry newsletters, following relevant companies and organizations, or regularly checking reputable industry news sources and publications.
Methodology
Step 1 - Identification of Relevant Samples Size from Population Database


Step 2 - Approaches for Defining Global Market Size (Value, Volume* & Price*)

Note*: In applicable scenarios
Step 3 - Data Sources
Primary Research
- Web Analytics
- Survey Reports
- Research Institute
- Latest Research Reports
- Opinion Leaders
Secondary Research
- Annual Reports
- White Paper
- Latest Press Release
- Industry Association
- Paid Database
- Investor Presentations

Step 4 - Data Triangulation
Involves using different sources of information in order to increase the validity of a study
These sources are likely to be stakeholders in a program - participants, other researchers, program staff, other community members, and so on.
Then we put all data in single framework & apply various statistical tools to find out the dynamic on the market.
During the analysis stage, feedback from the stakeholder groups would be compared to determine areas of agreement as well as areas of divergence


