
Key Insights
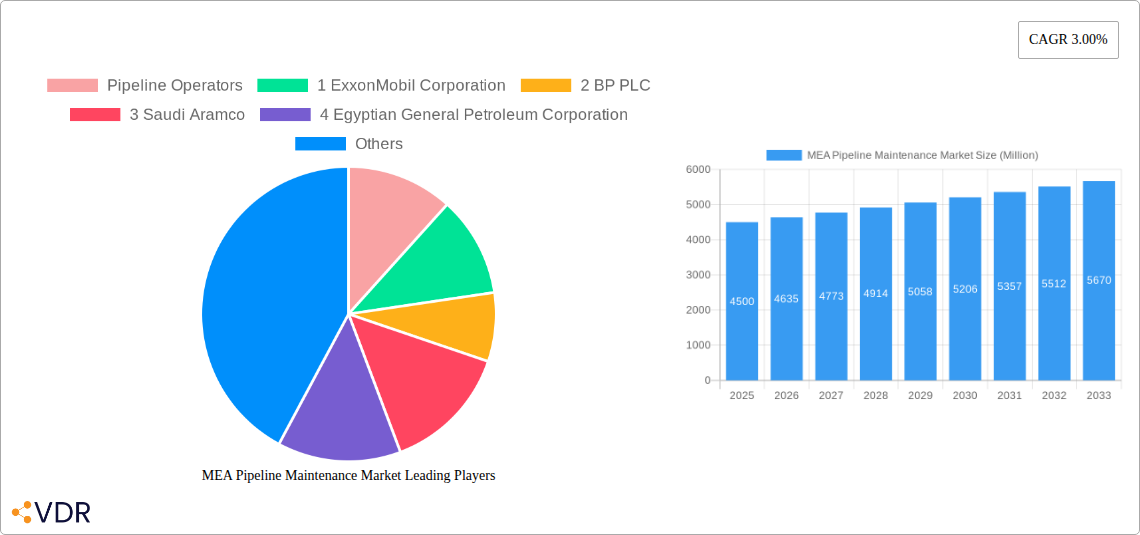
The Middle East and Africa (MEA) pipeline maintenance market is experiencing steady growth, driven by the increasing demand for energy resources and the expansion of existing pipeline networks. The market's Compound Annual Growth Rate (CAGR) of 3.00% from 2019 to 2024 suggests a consistent, albeit moderate, expansion. This growth is fueled by several factors: the ongoing need for regular maintenance to ensure operational efficiency and safety of aging pipelines; increasing investments in pipeline infrastructure projects across the region; and stringent regulatory compliance requirements emphasizing pipeline integrity management. Key players in this market, such as ExxonMobil, BP, Saudi Aramco, and several regional pipeline operators, are investing heavily in advanced technologies and sophisticated maintenance strategies to mitigate risks and optimize operational costs. The market is segmented into pipeline operators and pipeline maintenance service providers, with the latter encompassing companies specializing in inspection, repair, and replacement services. While exact market size figures are unavailable, based on industry averages and comparable markets, the MEA pipeline maintenance market size in 2025 can be estimated at approximately $4.5 Billion, considering the significant energy infrastructure present in the region.
Significant growth opportunities exist for pipeline maintenance service providers specializing in innovative technologies, such as pipeline integrity management (PIM) systems, advanced inspection techniques (e.g., smart pigs), and predictive maintenance solutions. The demand for these services is expected to increase in line with the growing emphasis on minimizing environmental risks and enhancing operational safety. However, market growth might be challenged by factors such as fluctuating oil prices, geopolitical instability in certain regions, and the potential for project delays. The overall forecast for the MEA pipeline maintenance market between 2025 and 2033 remains positive, although sustained growth hinges on continued investment in infrastructure and a stable geopolitical environment.
MEA Pipeline Maintenance Market: A Comprehensive Report (2019-2033)
This in-depth report provides a comprehensive analysis of the Middle East & Africa (MEA) Pipeline Maintenance Market, covering the period from 2019 to 2033. It delves into market dynamics, growth trends, regional variations, and key players, offering valuable insights for industry professionals, investors, and stakeholders. The report segments the market by key players (Pipeline Operators and Pipeline Maintenance Services Providers) and geographical regions, providing a granular understanding of this vital sector. The study period covers the historical period (2019-2024), the base year (2025), and the forecast period (2025-2033), with estimated values for 2025. This report uses Million units as the unit of measure for all values.
MEA Pipeline Maintenance Market Dynamics & Structure
The MEA pipeline maintenance market is characterized by a moderately concentrated structure with a mix of large multinational corporations and regional players. Technological innovation, driven by the need for improved efficiency, safety, and reduced environmental impact, is a key driver. Stringent regulatory frameworks, varying across different MEA countries, influence maintenance practices and investment decisions. Competitive pressures exist from substitute technologies and alternative transportation methods. The end-user demographic primarily comprises oil and gas companies, with increasing involvement of renewable energy players. M&A activity has been relatively moderate in recent years, with a total estimated deal value of xx Million in the historical period, reflecting consolidation trends.
- Market Concentration: Moderately concentrated, with a few dominant players.
- Technological Innovation: Driven by enhanced efficiency, safety, and environmental considerations. Specific examples include implementation of advanced inspection techniques and the use of predictive maintenance software. Barriers to innovation include high upfront investment costs and limited access to technology in some regions.
- Regulatory Framework: Varies across MEA countries, influencing maintenance standards and investment decisions.
- Competitive Substitutes: Alternative transportation methods (e.g., road, rail) pose competition.
- End-User Demographics: Primarily oil and gas companies, with growth from renewable energy sectors.
- M&A Trends: Moderate activity observed in the historical period, with a total estimated deal volume of xx Million.
MEA Pipeline Maintenance Market Growth Trends & Insights
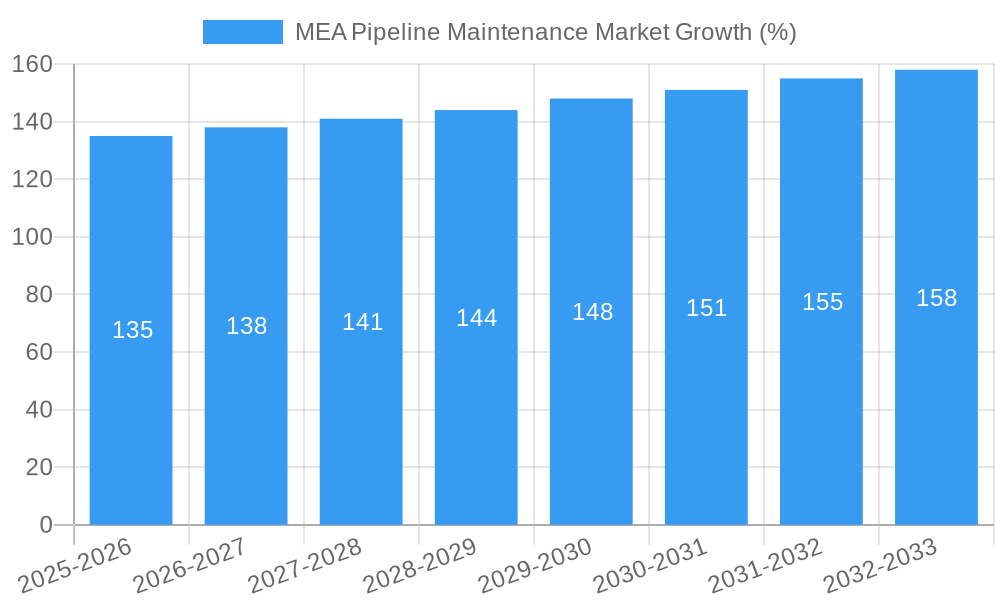
The MEA pipeline maintenance market is projected to witness significant growth during the forecast period (2025-2033), driven by rising oil and gas production, expansion of pipeline networks, and increasing focus on pipeline integrity management. Market size is expected to increase from xx Million in 2025 to xx Million by 2033, exhibiting a CAGR of xx%. Technological advancements, such as the adoption of smart pipelines and advanced inspection techniques, are accelerating market expansion. Consumer behavior shifts towards prioritizing safety and environmental sustainability are further bolstering demand for robust maintenance solutions. Adoption rates for advanced technologies are steadily increasing, though challenges persist in integrating these solutions across diverse pipeline infrastructure.
Dominant Regions, Countries, or Segments in MEA Pipeline Maintenance Market
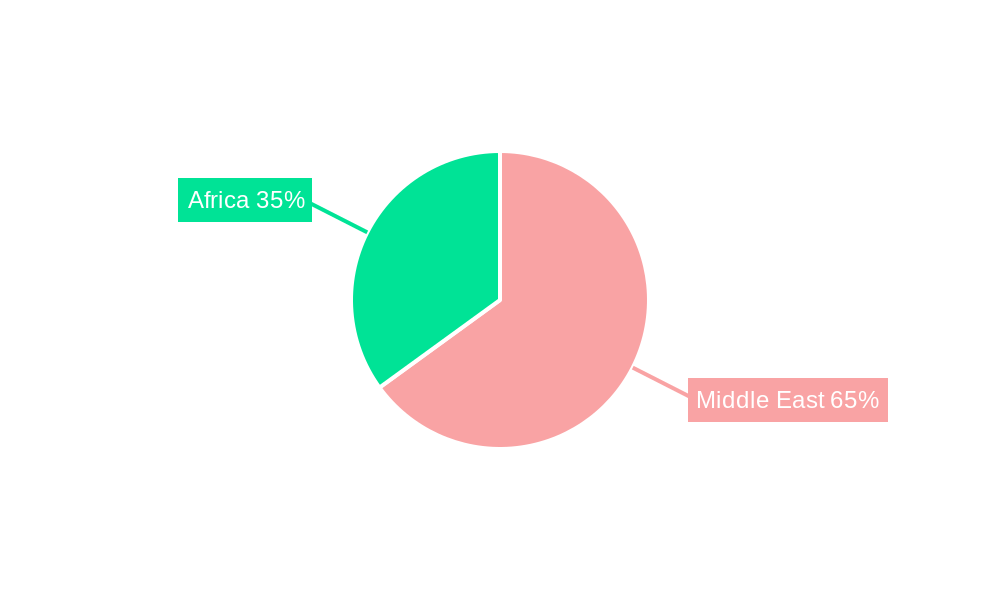
The GCC region currently dominates the MEA pipeline maintenance market, driven by substantial oil and gas production and extensive pipeline infrastructure. Saudi Arabia and the UAE represent significant market segments due to their large hydrocarbon reserves and investments in pipeline modernization. However, other regions such as North Africa and East Africa are exhibiting strong growth potential owing to increased exploration and production activities.
- Key Drivers: Large oil and gas reserves, significant investment in pipeline infrastructure, and government initiatives promoting pipeline safety.
- Dominance Factors: High oil and gas production, existing mature pipeline infrastructure requiring maintenance.
MEA Pipeline Maintenance Market Product Landscape
The MEA pipeline maintenance market encompasses a wide range of products, including inspection tools (e.g., in-line inspection (ILI) tools, aerial drones), repair and replacement parts, maintenance services (e.g., preventative, corrective, and emergency maintenance), and specialized software for pipeline monitoring and management. Recent innovations focus on improving inspection accuracy, reducing downtime, and enhancing pipeline integrity. The integration of advanced technologies like AI and machine learning in pipeline monitoring systems is transforming the industry by increasing operational efficiency and safety.
Key Drivers, Barriers & Challenges in MEA Pipeline Maintenance Market
Key Drivers:
- Growing oil and gas production and expansion of pipeline networks across the MEA region.
- Increasing focus on pipeline safety and regulatory compliance.
- Technological advancements leading to improved maintenance efficiency.
Challenges and Restraints:
- High initial investment costs associated with adopting advanced technologies.
- Supply chain disruptions and fluctuations in raw material prices.
- Shortage of skilled workforce specialized in pipeline maintenance.
- Complex regulatory landscapes varying across different MEA countries.
Emerging Opportunities in MEA Pipeline Maintenance Market
- Expanding into renewable energy sectors (e.g., maintenance of carbon capture and storage pipelines).
- Development of innovative maintenance solutions using AI and machine learning.
- Increased adoption of predictive maintenance strategies.
- Focus on sustainable maintenance practices to reduce environmental impact.
Growth Accelerators in the MEA Pipeline Maintenance Market Industry
Strategic partnerships between pipeline operators and maintenance service providers are driving growth. Technological breakthroughs, such as the use of robotics and automation in pipeline inspections and repairs, are enhancing efficiency and safety. Expanding pipeline networks and the growing focus on pipeline integrity management contribute significantly to market growth. Government policies promoting pipeline safety and infrastructure development further accelerate market expansion.
Key Players Shaping the MEA Pipeline Maintenance Market Market
Pipeline Operators:
- ExxonMobil Corporation
- BP PLC
- Saudi Aramco
- Egyptian General Petroleum Corporation
- East Mediterranean Gas Company
- Chevron Corporation
- West African Gas Pipeline Company
- SECO
Pipeline Maintenance Services Providers:
- Arabian Pipes Company
- Rezayat Group
- Vallourec SA
- EEW Group
- Frontier Pipeline services
- OLEUM Process & Pipeline Services
- STATS Group
- Halliburton Company
- T D Williamson Inc
- *List Not Exhaustive
Notable Milestones in MEA Pipeline Maintenance Market Sector
- August 2022: Seplat Petroleum Development Company commenced commercial crude oil injection through the new Amukpe-Escravos Pipeline (67 km), improving export reliability.
- February 2022: Aramco signed a USD 15.5 billion lease and leaseback agreement for its gas pipeline network with a consortium including BlackRock and Hassana Investment Company.
In-Depth MEA Pipeline Maintenance Market Market Outlook
The MEA pipeline maintenance market holds immense potential, driven by factors such as increasing investments in pipeline infrastructure, growing demand for efficient maintenance solutions, and technological advancements. Strategic opportunities exist for companies to capitalize on the rising demand for advanced technologies and services, particularly in the areas of predictive maintenance, digitalization, and sustainable solutions. The market is expected to experience sustained growth driven by both organic expansion and strategic acquisitions, making it an attractive sector for investment and growth.
MEA Pipeline Maintenance Market Segmentation
-
1. Service Type
- 1.1. Pigging
- 1.2. Flushing & Chemical Cleaning
- 1.3. Pipeline Repair & Maintenance
- 1.4. Drying
- 1.5. Others
-
2. Location of Deployment
- 2.1. Onshore
- 2.2. Offshore
-
3. Geography
- 3.1. UAE
- 3.2. Algeria
- 3.3. Nigeria
- 3.4. Saudi Arabia
- 3.5. Rest of Middle East & Africa
MEA Pipeline Maintenance Market Segmentation By Geography
- 1. UAE
- 2. Algeria
- 3. Nigeria
- 4. Saudi Arabia
- 5. Rest of Middle East
MEA Pipeline Maintenance Market REPORT HIGHLIGHTS
| Aspects | Details |
|---|---|
| Study Period | 2019-2033 |
| Base Year | 2024 |
| Estimated Year | 2025 |
| Forecast Period | 2025-2033 |
| Historical Period | 2019-2024 |
| Growth Rate | CAGR of 3.00% from 2019-2033 |
| Segmentation |
|
Table of Contents
- 1. Introduction
- 1.1. Research Scope
- 1.2. Market Segmentation
- 1.3. Research Methodology
- 1.4. Definitions and Assumptions
- 2. Executive Summary
- 2.1. Introduction
- 3. Market Dynamics
- 3.1. Introduction
- 3.2. Market Drivers
- 3.3. Market Restrains
- 3.4. Market Trends
- 3.4.1. Pigging Segment to have a Significant Share in the Market
- 4. Market Factor Analysis
- 4.1. Porters Five Forces
- 4.2. Supply/Value Chain
- 4.3. PESTEL analysis
- 4.4. Market Entropy
- 4.5. Patent/Trademark Analysis
- 5. Global MEA Pipeline Maintenance Market Analysis, Insights and Forecast, 2019-2031
- 5.1. Market Analysis, Insights and Forecast - by Service Type
- 5.1.1. Pigging
- 5.1.2. Flushing & Chemical Cleaning
- 5.1.3. Pipeline Repair & Maintenance
- 5.1.4. Drying
- 5.1.5. Others
- 5.2. Market Analysis, Insights and Forecast - by Location of Deployment
- 5.2.1. Onshore
- 5.2.2. Offshore
- 5.3. Market Analysis, Insights and Forecast - by Geography
- 5.3.1. UAE
- 5.3.2. Algeria
- 5.3.3. Nigeria
- 5.3.4. Saudi Arabia
- 5.3.5. Rest of Middle East & Africa
- 5.4. Market Analysis, Insights and Forecast - by Region
- 5.4.1. UAE
- 5.4.2. Algeria
- 5.4.3. Nigeria
- 5.4.4. Saudi Arabia
- 5.4.5. Rest of Middle East
- 5.1. Market Analysis, Insights and Forecast - by Service Type
- 6. UAE MEA Pipeline Maintenance Market Analysis, Insights and Forecast, 2019-2031
- 6.1. Market Analysis, Insights and Forecast - by Service Type
- 6.1.1. Pigging
- 6.1.2. Flushing & Chemical Cleaning
- 6.1.3. Pipeline Repair & Maintenance
- 6.1.4. Drying
- 6.1.5. Others
- 6.2. Market Analysis, Insights and Forecast - by Location of Deployment
- 6.2.1. Onshore
- 6.2.2. Offshore
- 6.3. Market Analysis, Insights and Forecast - by Geography
- 6.3.1. UAE
- 6.3.2. Algeria
- 6.3.3. Nigeria
- 6.3.4. Saudi Arabia
- 6.3.5. Rest of Middle East & Africa
- 6.1. Market Analysis, Insights and Forecast - by Service Type
- 7. Algeria MEA Pipeline Maintenance Market Analysis, Insights and Forecast, 2019-2031
- 7.1. Market Analysis, Insights and Forecast - by Service Type
- 7.1.1. Pigging
- 7.1.2. Flushing & Chemical Cleaning
- 7.1.3. Pipeline Repair & Maintenance
- 7.1.4. Drying
- 7.1.5. Others
- 7.2. Market Analysis, Insights and Forecast - by Location of Deployment
- 7.2.1. Onshore
- 7.2.2. Offshore
- 7.3. Market Analysis, Insights and Forecast - by Geography
- 7.3.1. UAE
- 7.3.2. Algeria
- 7.3.3. Nigeria
- 7.3.4. Saudi Arabia
- 7.3.5. Rest of Middle East & Africa
- 7.1. Market Analysis, Insights and Forecast - by Service Type
- 8. Nigeria MEA Pipeline Maintenance Market Analysis, Insights and Forecast, 2019-2031
- 8.1. Market Analysis, Insights and Forecast - by Service Type
- 8.1.1. Pigging
- 8.1.2. Flushing & Chemical Cleaning
- 8.1.3. Pipeline Repair & Maintenance
- 8.1.4. Drying
- 8.1.5. Others
- 8.2. Market Analysis, Insights and Forecast - by Location of Deployment
- 8.2.1. Onshore
- 8.2.2. Offshore
- 8.3. Market Analysis, Insights and Forecast - by Geography
- 8.3.1. UAE
- 8.3.2. Algeria
- 8.3.3. Nigeria
- 8.3.4. Saudi Arabia
- 8.3.5. Rest of Middle East & Africa
- 8.1. Market Analysis, Insights and Forecast - by Service Type
- 9. Saudi Arabia MEA Pipeline Maintenance Market Analysis, Insights and Forecast, 2019-2031
- 9.1. Market Analysis, Insights and Forecast - by Service Type
- 9.1.1. Pigging
- 9.1.2. Flushing & Chemical Cleaning
- 9.1.3. Pipeline Repair & Maintenance
- 9.1.4. Drying
- 9.1.5. Others
- 9.2. Market Analysis, Insights and Forecast - by Location of Deployment
- 9.2.1. Onshore
- 9.2.2. Offshore
- 9.3. Market Analysis, Insights and Forecast - by Geography
- 9.3.1. UAE
- 9.3.2. Algeria
- 9.3.3. Nigeria
- 9.3.4. Saudi Arabia
- 9.3.5. Rest of Middle East & Africa
- 9.1. Market Analysis, Insights and Forecast - by Service Type
- 10. Rest of Middle East MEA Pipeline Maintenance Market Analysis, Insights and Forecast, 2019-2031
- 10.1. Market Analysis, Insights and Forecast - by Service Type
- 10.1.1. Pigging
- 10.1.2. Flushing & Chemical Cleaning
- 10.1.3. Pipeline Repair & Maintenance
- 10.1.4. Drying
- 10.1.5. Others
- 10.2. Market Analysis, Insights and Forecast - by Location of Deployment
- 10.2.1. Onshore
- 10.2.2. Offshore
- 10.3. Market Analysis, Insights and Forecast - by Geography
- 10.3.1. UAE
- 10.3.2. Algeria
- 10.3.3. Nigeria
- 10.3.4. Saudi Arabia
- 10.3.5. Rest of Middle East & Africa
- 10.1. Market Analysis, Insights and Forecast - by Service Type
- 11. Competitive Analysis
- 11.1. Global Market Share Analysis 2024
- 11.2. Company Profiles
- 11.2.1 Pipeline Operators
- 11.2.1.1. Overview
- 11.2.1.2. Products
- 11.2.1.3. SWOT Analysis
- 11.2.1.4. Recent Developments
- 11.2.1.5. Financials (Based on Availability)
- 11.2.2 1 ExxonMobil Corporation
- 11.2.2.1. Overview
- 11.2.2.2. Products
- 11.2.2.3. SWOT Analysis
- 11.2.2.4. Recent Developments
- 11.2.2.5. Financials (Based on Availability)
- 11.2.3 2 BP PLC
- 11.2.3.1. Overview
- 11.2.3.2. Products
- 11.2.3.3. SWOT Analysis
- 11.2.3.4. Recent Developments
- 11.2.3.5. Financials (Based on Availability)
- 11.2.4 3 Saudi Aramco
- 11.2.4.1. Overview
- 11.2.4.2. Products
- 11.2.4.3. SWOT Analysis
- 11.2.4.4. Recent Developments
- 11.2.4.5. Financials (Based on Availability)
- 11.2.5 4 Egyptian General Petroleum Corporation
- 11.2.5.1. Overview
- 11.2.5.2. Products
- 11.2.5.3. SWOT Analysis
- 11.2.5.4. Recent Developments
- 11.2.5.5. Financials (Based on Availability)
- 11.2.6 5 East Mediterranean Gas Company
- 11.2.6.1. Overview
- 11.2.6.2. Products
- 11.2.6.3. SWOT Analysis
- 11.2.6.4. Recent Developments
- 11.2.6.5. Financials (Based on Availability)
- 11.2.7 6 Chevron Corporation
- 11.2.7.1. Overview
- 11.2.7.2. Products
- 11.2.7.3. SWOT Analysis
- 11.2.7.4. Recent Developments
- 11.2.7.5. Financials (Based on Availability)
- 11.2.8 7 West African Gas Pipeline Company
- 11.2.8.1. Overview
- 11.2.8.2. Products
- 11.2.8.3. SWOT Analysis
- 11.2.8.4. Recent Developments
- 11.2.8.5. Financials (Based on Availability)
- 11.2.9 8 SECO
- 11.2.9.1. Overview
- 11.2.9.2. Products
- 11.2.9.3. SWOT Analysis
- 11.2.9.4. Recent Developments
- 11.2.9.5. Financials (Based on Availability)
- 11.2.10 Pipeline Maintenance Services Providers
- 11.2.10.1. Overview
- 11.2.10.2. Products
- 11.2.10.3. SWOT Analysis
- 11.2.10.4. Recent Developments
- 11.2.10.5. Financials (Based on Availability)
- 11.2.11 1 Arabian Pipes Company
- 11.2.11.1. Overview
- 11.2.11.2. Products
- 11.2.11.3. SWOT Analysis
- 11.2.11.4. Recent Developments
- 11.2.11.5. Financials (Based on Availability)
- 11.2.12 3 Rezayat Group
- 11.2.12.1. Overview
- 11.2.12.2. Products
- 11.2.12.3. SWOT Analysis
- 11.2.12.4. Recent Developments
- 11.2.12.5. Financials (Based on Availability)
- 11.2.13 4 Vallourec SA
- 11.2.13.1. Overview
- 11.2.13.2. Products
- 11.2.13.3. SWOT Analysis
- 11.2.13.4. Recent Developments
- 11.2.13.5. Financials (Based on Availability)
- 11.2.14 5 EEW Group
- 11.2.14.1. Overview
- 11.2.14.2. Products
- 11.2.14.3. SWOT Analysis
- 11.2.14.4. Recent Developments
- 11.2.14.5. Financials (Based on Availability)
- 11.2.15 6 Frontier Pipeline services
- 11.2.15.1. Overview
- 11.2.15.2. Products
- 11.2.15.3. SWOT Analysis
- 11.2.15.4. Recent Developments
- 11.2.15.5. Financials (Based on Availability)
- 11.2.16 7 OLEUM Process & Pipeline Services
- 11.2.16.1. Overview
- 11.2.16.2. Products
- 11.2.16.3. SWOT Analysis
- 11.2.16.4. Recent Developments
- 11.2.16.5. Financials (Based on Availability)
- 11.2.17 8 STATS Group
- 11.2.17.1. Overview
- 11.2.17.2. Products
- 11.2.17.3. SWOT Analysis
- 11.2.17.4. Recent Developments
- 11.2.17.5. Financials (Based on Availability)
- 11.2.18 9 Halliburton Company
- 11.2.18.1. Overview
- 11.2.18.2. Products
- 11.2.18.3. SWOT Analysis
- 11.2.18.4. Recent Developments
- 11.2.18.5. Financials (Based on Availability)
- 11.2.19 10 T D Williamson Inc*List Not Exhaustive
- 11.2.19.1. Overview
- 11.2.19.2. Products
- 11.2.19.3. SWOT Analysis
- 11.2.19.4. Recent Developments
- 11.2.19.5. Financials (Based on Availability)
- 11.2.1 Pipeline Operators
List of Figures
- Figure 1: Global MEA Pipeline Maintenance Market Revenue Breakdown (Million, %) by Region 2024 & 2032
- Figure 2: UAE MEA Pipeline Maintenance Market Revenue (Million), by Service Type 2024 & 2032
- Figure 3: UAE MEA Pipeline Maintenance Market Revenue Share (%), by Service Type 2024 & 2032
- Figure 4: UAE MEA Pipeline Maintenance Market Revenue (Million), by Location of Deployment 2024 & 2032
- Figure 5: UAE MEA Pipeline Maintenance Market Revenue Share (%), by Location of Deployment 2024 & 2032
- Figure 6: UAE MEA Pipeline Maintenance Market Revenue (Million), by Geography 2024 & 2032
- Figure 7: UAE MEA Pipeline Maintenance Market Revenue Share (%), by Geography 2024 & 2032
- Figure 8: UAE MEA Pipeline Maintenance Market Revenue (Million), by Country 2024 & 2032
- Figure 9: UAE MEA Pipeline Maintenance Market Revenue Share (%), by Country 2024 & 2032
- Figure 10: Algeria MEA Pipeline Maintenance Market Revenue (Million), by Service Type 2024 & 2032
- Figure 11: Algeria MEA Pipeline Maintenance Market Revenue Share (%), by Service Type 2024 & 2032
- Figure 12: Algeria MEA Pipeline Maintenance Market Revenue (Million), by Location of Deployment 2024 & 2032
- Figure 13: Algeria MEA Pipeline Maintenance Market Revenue Share (%), by Location of Deployment 2024 & 2032
- Figure 14: Algeria MEA Pipeline Maintenance Market Revenue (Million), by Geography 2024 & 2032
- Figure 15: Algeria MEA Pipeline Maintenance Market Revenue Share (%), by Geography 2024 & 2032
- Figure 16: Algeria MEA Pipeline Maintenance Market Revenue (Million), by Country 2024 & 2032
- Figure 17: Algeria MEA Pipeline Maintenance Market Revenue Share (%), by Country 2024 & 2032
- Figure 18: Nigeria MEA Pipeline Maintenance Market Revenue (Million), by Service Type 2024 & 2032
- Figure 19: Nigeria MEA Pipeline Maintenance Market Revenue Share (%), by Service Type 2024 & 2032
- Figure 20: Nigeria MEA Pipeline Maintenance Market Revenue (Million), by Location of Deployment 2024 & 2032
- Figure 21: Nigeria MEA Pipeline Maintenance Market Revenue Share (%), by Location of Deployment 2024 & 2032
- Figure 22: Nigeria MEA Pipeline Maintenance Market Revenue (Million), by Geography 2024 & 2032
- Figure 23: Nigeria MEA Pipeline Maintenance Market Revenue Share (%), by Geography 2024 & 2032
- Figure 24: Nigeria MEA Pipeline Maintenance Market Revenue (Million), by Country 2024 & 2032
- Figure 25: Nigeria MEA Pipeline Maintenance Market Revenue Share (%), by Country 2024 & 2032
- Figure 26: Saudi Arabia MEA Pipeline Maintenance Market Revenue (Million), by Service Type 2024 & 2032
- Figure 27: Saudi Arabia MEA Pipeline Maintenance Market Revenue Share (%), by Service Type 2024 & 2032
- Figure 28: Saudi Arabia MEA Pipeline Maintenance Market Revenue (Million), by Location of Deployment 2024 & 2032
- Figure 29: Saudi Arabia MEA Pipeline Maintenance Market Revenue Share (%), by Location of Deployment 2024 & 2032
- Figure 30: Saudi Arabia MEA Pipeline Maintenance Market Revenue (Million), by Geography 2024 & 2032
- Figure 31: Saudi Arabia MEA Pipeline Maintenance Market Revenue Share (%), by Geography 2024 & 2032
- Figure 32: Saudi Arabia MEA Pipeline Maintenance Market Revenue (Million), by Country 2024 & 2032
- Figure 33: Saudi Arabia MEA Pipeline Maintenance Market Revenue Share (%), by Country 2024 & 2032
- Figure 34: Rest of Middle East MEA Pipeline Maintenance Market Revenue (Million), by Service Type 2024 & 2032
- Figure 35: Rest of Middle East MEA Pipeline Maintenance Market Revenue Share (%), by Service Type 2024 & 2032
- Figure 36: Rest of Middle East MEA Pipeline Maintenance Market Revenue (Million), by Location of Deployment 2024 & 2032
- Figure 37: Rest of Middle East MEA Pipeline Maintenance Market Revenue Share (%), by Location of Deployment 2024 & 2032
- Figure 38: Rest of Middle East MEA Pipeline Maintenance Market Revenue (Million), by Geography 2024 & 2032
- Figure 39: Rest of Middle East MEA Pipeline Maintenance Market Revenue Share (%), by Geography 2024 & 2032
- Figure 40: Rest of Middle East MEA Pipeline Maintenance Market Revenue (Million), by Country 2024 & 2032
- Figure 41: Rest of Middle East MEA Pipeline Maintenance Market Revenue Share (%), by Country 2024 & 2032
List of Tables
- Table 1: Global MEA Pipeline Maintenance Market Revenue Million Forecast, by Region 2019 & 2032
- Table 2: Global MEA Pipeline Maintenance Market Revenue Million Forecast, by Service Type 2019 & 2032
- Table 3: Global MEA Pipeline Maintenance Market Revenue Million Forecast, by Location of Deployment 2019 & 2032
- Table 4: Global MEA Pipeline Maintenance Market Revenue Million Forecast, by Geography 2019 & 2032
- Table 5: Global MEA Pipeline Maintenance Market Revenue Million Forecast, by Region 2019 & 2032
- Table 6: Global MEA Pipeline Maintenance Market Revenue Million Forecast, by Service Type 2019 & 2032
- Table 7: Global MEA Pipeline Maintenance Market Revenue Million Forecast, by Location of Deployment 2019 & 2032
- Table 8: Global MEA Pipeline Maintenance Market Revenue Million Forecast, by Geography 2019 & 2032
- Table 9: Global MEA Pipeline Maintenance Market Revenue Million Forecast, by Country 2019 & 2032
- Table 10: Global MEA Pipeline Maintenance Market Revenue Million Forecast, by Service Type 2019 & 2032
- Table 11: Global MEA Pipeline Maintenance Market Revenue Million Forecast, by Location of Deployment 2019 & 2032
- Table 12: Global MEA Pipeline Maintenance Market Revenue Million Forecast, by Geography 2019 & 2032
- Table 13: Global MEA Pipeline Maintenance Market Revenue Million Forecast, by Country 2019 & 2032
- Table 14: Global MEA Pipeline Maintenance Market Revenue Million Forecast, by Service Type 2019 & 2032
- Table 15: Global MEA Pipeline Maintenance Market Revenue Million Forecast, by Location of Deployment 2019 & 2032
- Table 16: Global MEA Pipeline Maintenance Market Revenue Million Forecast, by Geography 2019 & 2032
- Table 17: Global MEA Pipeline Maintenance Market Revenue Million Forecast, by Country 2019 & 2032
- Table 18: Global MEA Pipeline Maintenance Market Revenue Million Forecast, by Service Type 2019 & 2032
- Table 19: Global MEA Pipeline Maintenance Market Revenue Million Forecast, by Location of Deployment 2019 & 2032
- Table 20: Global MEA Pipeline Maintenance Market Revenue Million Forecast, by Geography 2019 & 2032
- Table 21: Global MEA Pipeline Maintenance Market Revenue Million Forecast, by Country 2019 & 2032
- Table 22: Global MEA Pipeline Maintenance Market Revenue Million Forecast, by Service Type 2019 & 2032
- Table 23: Global MEA Pipeline Maintenance Market Revenue Million Forecast, by Location of Deployment 2019 & 2032
- Table 24: Global MEA Pipeline Maintenance Market Revenue Million Forecast, by Geography 2019 & 2032
- Table 25: Global MEA Pipeline Maintenance Market Revenue Million Forecast, by Country 2019 & 2032
Frequently Asked Questions
1. What is the projected Compound Annual Growth Rate (CAGR) of the MEA Pipeline Maintenance Market?
The projected CAGR is approximately 3.00%.
2. Which companies are prominent players in the MEA Pipeline Maintenance Market?
Key companies in the market include Pipeline Operators, 1 ExxonMobil Corporation, 2 BP PLC, 3 Saudi Aramco, 4 Egyptian General Petroleum Corporation, 5 East Mediterranean Gas Company, 6 Chevron Corporation, 7 West African Gas Pipeline Company, 8 SECO, Pipeline Maintenance Services Providers, 1 Arabian Pipes Company, 3 Rezayat Group, 4 Vallourec SA, 5 EEW Group, 6 Frontier Pipeline services, 7 OLEUM Process & Pipeline Services, 8 STATS Group, 9 Halliburton Company, 10 T D Williamson Inc*List Not Exhaustive.
3. What are the main segments of the MEA Pipeline Maintenance Market?
The market segments include Service Type, Location of Deployment, Geography.
4. Can you provide details about the market size?
The market size is estimated to be USD XX Million as of 2022.
5. What are some drivers contributing to market growth?
N/A
6. What are the notable trends driving market growth?
Pigging Segment to have a Significant Share in the Market.
7. Are there any restraints impacting market growth?
N/A
8. Can you provide examples of recent developments in the market?
August 2022: Seplat Petroleum Development Company began commercial injection of crude oil through the new Amukpe-Escravos Pipeline. The 67-kilo-meter, mostly underground pipeline is expected to provide a more reliable and secure export route for liquids from Seplat Energy's major assets.
9. What pricing options are available for accessing the report?
Pricing options include single-user, multi-user, and enterprise licenses priced at USD 4750, USD 5250, and USD 8750 respectively.
10. Is the market size provided in terms of value or volume?
The market size is provided in terms of value, measured in Million.
11. Are there any specific market keywords associated with the report?
Yes, the market keyword associated with the report is "MEA Pipeline Maintenance Market," which aids in identifying and referencing the specific market segment covered.
12. How do I determine which pricing option suits my needs best?
The pricing options vary based on user requirements and access needs. Individual users may opt for single-user licenses, while businesses requiring broader access may choose multi-user or enterprise licenses for cost-effective access to the report.
13. Are there any additional resources or data provided in the MEA Pipeline Maintenance Market report?
While the report offers comprehensive insights, it's advisable to review the specific contents or supplementary materials provided to ascertain if additional resources or data are available.
14. How can I stay updated on further developments or reports in the MEA Pipeline Maintenance Market?
To stay informed about further developments, trends, and reports in the MEA Pipeline Maintenance Market, consider subscribing to industry newsletters, following relevant companies and organizations, or regularly checking reputable industry news sources and publications.
Methodology
Step 1 - Identification of Relevant Samples Size from Population Database


Step 2 - Approaches for Defining Global Market Size (Value, Volume* & Price*)

Note*: In applicable scenarios
Step 3 - Data Sources
Primary Research
- Web Analytics
- Survey Reports
- Research Institute
- Latest Research Reports
- Opinion Leaders
Secondary Research
- Annual Reports
- White Paper
- Latest Press Release
- Industry Association
- Paid Database
- Investor Presentations

Step 4 - Data Triangulation
Involves using different sources of information in order to increase the validity of a study
These sources are likely to be stakeholders in a program - participants, other researchers, program staff, other community members, and so on.
Then we put all data in single framework & apply various statistical tools to find out the dynamic on the market.
During the analysis stage, feedback from the stakeholder groups would be compared to determine areas of agreement as well as areas of divergence


