
Key Insights
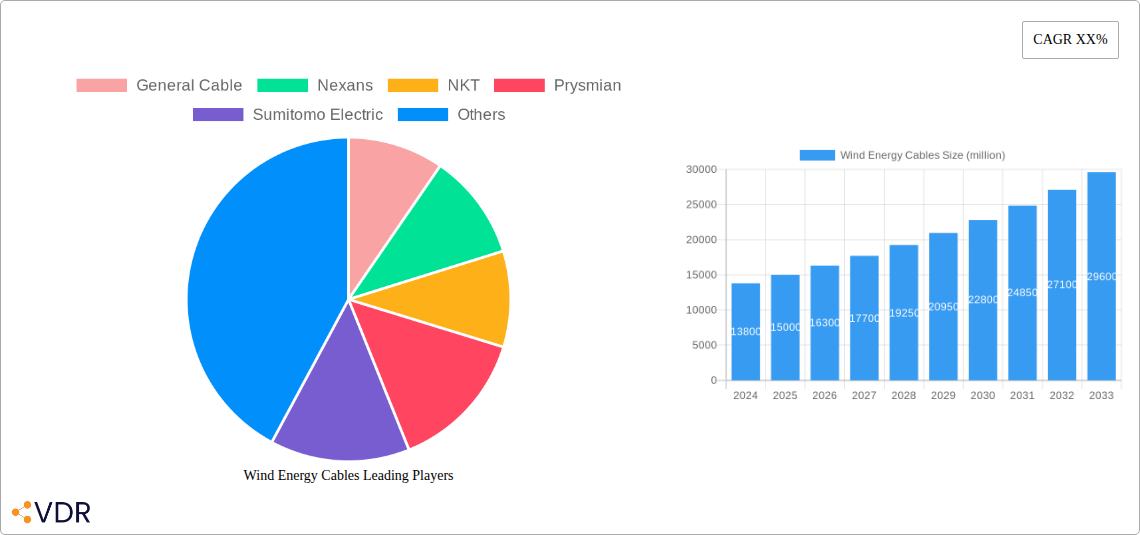
The global Wind Energy Cables market is poised for significant expansion, projected to reach an estimated market size of $15,000 million by 2025 and grow at a robust CAGR of 8.5% through 2033. This upward trajectory is primarily fueled by the accelerating global transition towards renewable energy sources, with wind power leading the charge. Government initiatives, favorable policies, and increasing investments in both offshore and onshore wind energy projects are acting as powerful catalysts for market growth. The burgeoning demand for reliable and efficient power transmission solutions for these large-scale wind farms, coupled with technological advancements in cable manufacturing, further supports this optimistic outlook.
The market is segmented across various applications, with Offshore Wind Energy emerging as a particularly dynamic segment due to the increasing complexity and scale of offshore installations requiring specialized, high-performance cables. Onshore Wind Energy remains a substantial contributor, driven by widespread adoption and continuous development. Within cable types, VFD Cables are experiencing heightened demand owing to their crucial role in controlling wind turbine performance and efficiency. Key industry players like Prysmian, Nexans, and General Cable are actively investing in research and development to innovate and meet the evolving needs of the wind energy sector, focusing on durability, safety, and cost-effectiveness. Despite these strong growth drivers, challenges such as stringent regulatory approvals and the high initial cost of infrastructure development could present minor restraints, though the overarching trend points towards substantial market opportunities.
Wind Energy Cables Market Research Report 2024-2033
This comprehensive report delves into the dynamic global Wind Energy Cables market, offering a detailed analysis of its structure, growth trajectory, and future outlook. Covering the Study Period: 2019–2033, with a Base Year: 2025 and Forecast Period: 2025–2033, this research provides invaluable insights for industry stakeholders, investors, and decision-makers. The report meticulously examines critical segments including Application (Offshore Wind Energy, Onshore Wind Energy) and Types (Standard Cable, Premium Cable, Servo Cable, VFD Cable, Others), while also highlighting key industry developments.
Wind Energy Cables Market Dynamics & Structure
The global Wind Energy Cables market is characterized by a moderate to high concentration, with key players like Prysmian, Nexans, and NKT holding significant market share. Technological innovation is a primary driver, with continuous advancements in materials science, insulation techniques, and manufacturing processes enhancing cable performance, durability, and efficiency for both offshore and onshore wind energy applications. Regulatory frameworks, driven by global climate change initiatives and government incentives for renewable energy, are increasingly favoring the adoption of advanced wind energy infrastructure, directly impacting the demand for specialized wind energy cables. Competitive product substitutes are limited, as the stringent performance and safety requirements of the wind energy sector necessitate highly specialized cable solutions. End-user demographics are shifting towards large-scale utility providers and independent power producers investing heavily in expanding wind farm capacities. Mergers and acquisitions (M&A) trends are observed as established players seek to consolidate their market position and expand their product portfolios, as evidenced by xx M&A deals in the historical period.
- Market Concentration: Dominated by a few large global manufacturers.
- Technological Innovation: Focus on high-voltage AC/DC transmission, enhanced insulation, and fire-retardant materials.
- Regulatory Frameworks: Supportive government policies and renewable energy targets globally.
- Competitive Substitutes: Limited due to specialized performance and safety requirements.
- End-User Demographics: Primarily large-scale wind farm developers and grid operators.
- M&A Trends: Strategic acquisitions to gain market share and expand technological capabilities.
Wind Energy Cables Growth Trends & Insights
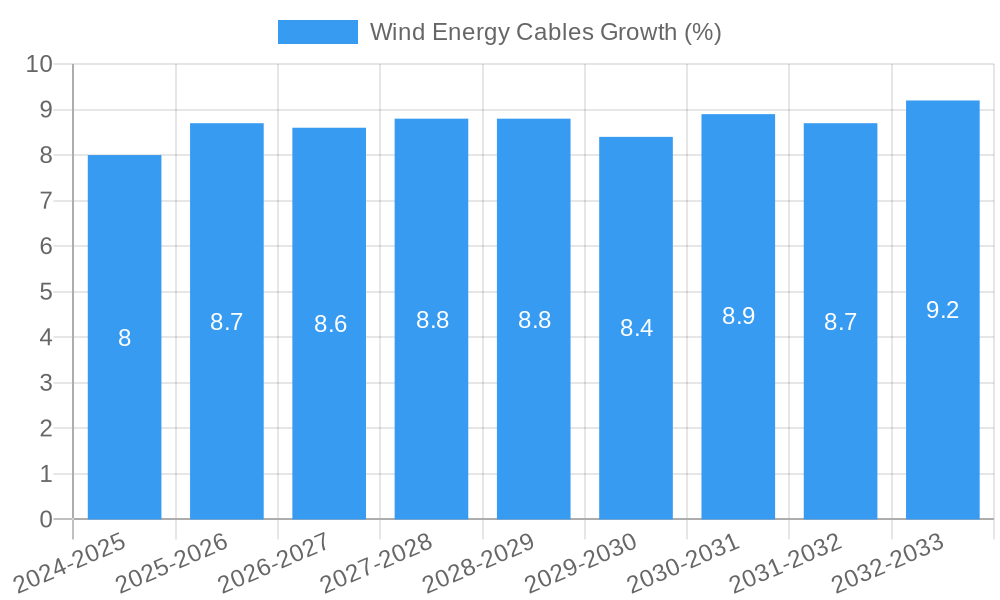
The Wind Energy Cables market is projected to witness robust growth throughout the forecast period, propelled by the escalating global demand for renewable energy and the continuous expansion of wind power generation capacity. This market is expected to experience a Compound Annual Growth Rate (CAGR) of xx% from 2025 to 2033, driven by significant investments in both offshore and onshore wind projects. The adoption rates for advanced wind energy cable solutions are rising as developers prioritize reliability, performance, and reduced operational costs. Technological disruptions, such as the development of higher voltage and more efficient transmission cables for larger turbines and remote wind farms, are key to this market's evolution. Consumer behavior shifts, influenced by increasing environmental consciousness and the desire for sustainable energy sources, further fuel the demand for wind energy. The market size, estimated at $xx billion in the base year 2025, is anticipated to reach $xx billion by 2033. Penetration of premium and specialized cables like VFD (Variable Frequency Drive) and servo cables is increasing as wind turbine technology advances, demanding more sophisticated electrical solutions. The ongoing transition to cleaner energy sources is a fundamental driver, creating sustained demand for all types of wind energy cables, from standard to highly specialized premium variants. The increasing complexity of wind turbine systems and the need for robust power transmission and control solutions are directly translating into higher market penetration for advanced cable types.
Dominant Regions, Countries, or Segments in Wind Energy Cables
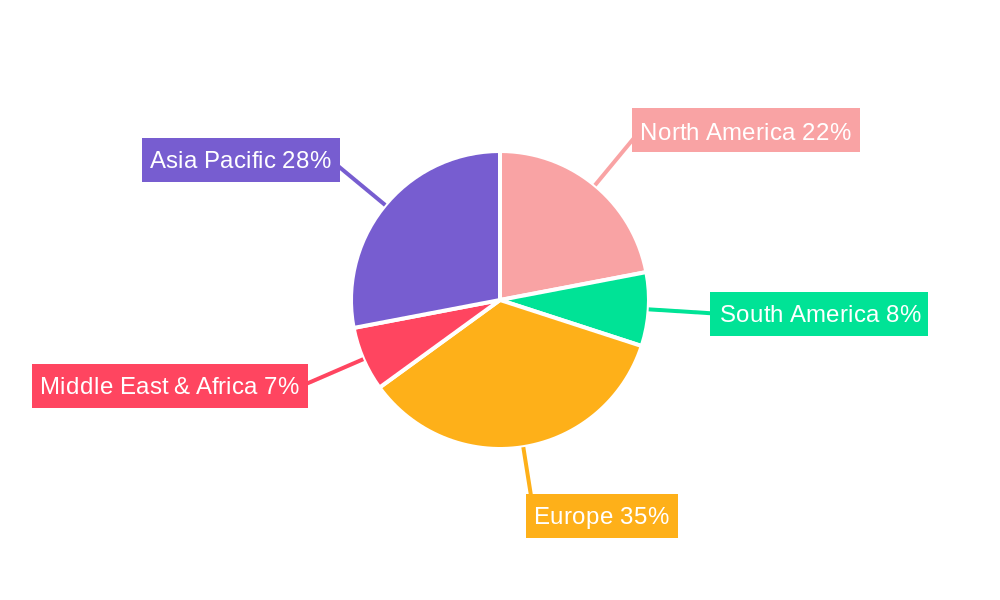
The Offshore Wind Energy application segment is anticipated to be the dominant force driving market growth for Wind Energy Cables. This dominance is attributed to several key factors, including substantial government investments in offshore wind farm development, the deployment of larger and more powerful offshore turbines requiring advanced high-voltage transmission cables, and the favorable economics of large-scale offshore projects. Europe, particularly countries like the UK, Germany, and the Netherlands, has been at the forefront of offshore wind development, establishing a strong demand for specialized offshore wind energy cables. Asia-Pacific, with countries such as China and South Korea, is rapidly expanding its offshore wind capacity, presenting significant growth potential. The development of robust infrastructure, including specialized ports and installation vessels, further supports offshore wind expansion. The technical demands of offshore environments—including harsh marine conditions, greater distances to shore, and higher power transmission requirements—necessitate the use of premium, high-performance cables designed for extreme durability and reliability. These premium cables often feature advanced insulation materials, enhanced protection against corrosion, and sophisticated fault detection capabilities, commanding a higher market share within the offshore segment. The growth potential in this segment is further amplified by ambitious national targets for renewable energy and the technological advancements enabling turbines to be sited further from shore, requiring even more sophisticated cable solutions. The economic policies in these dominant regions actively encourage investment in renewable energy, creating a fertile ground for the Wind Energy Cables market.
- Dominant Segment: Offshore Wind Energy
- Key Drivers: Government incentives, large-scale turbine deployment, advancements in transmission technology, demand for high-voltage AC/DC cables.
- Growth Potential: Significant due to expanding offshore wind farms in Europe and Asia-Pacific.
- Market Share: Expected to hold the largest share within the Wind Energy Cables market.
- Leading Regions/Countries:
- Europe: UK, Germany, Netherlands (established offshore markets).
- Asia-Pacific: China, South Korea (rapidly growing offshore markets).
- Dominance Factors:
- Economic Policies: Strong support for renewable energy development.
- Infrastructure Development: Investment in ports, installation vessels, and grid connections.
- Technological Advancements: Development of higher voltage and longer-reach cables.
Wind Energy Cables Product Landscape
The Wind Energy Cables product landscape is characterized by continuous innovation aimed at enhancing efficiency, durability, and safety in demanding wind farm environments. Manufacturers are developing advanced premium cable solutions incorporating state-of-the-art insulation materials like cross-linked polyethylene (XLPE) and improved sheathing compounds for superior resistance to UV radiation, chemicals, and mechanical stress. These premium cables are crucial for high-voltage AC and DC transmission in both offshore and onshore wind farms, ensuring reliable power delivery over long distances. Innovations in VFD cables are also significant, designed to minimize electromagnetic interference (EMI) and reduce motor overheating in variable frequency drive systems used to control turbine speed and power output. Furthermore, advancements in servo cables are enabling more precise control and faster response times for turbine pitch and yaw systems. The industry is witnessing a trend towards integrated cable solutions and the development of fire-retardant and low-smoke halogen-free (LSHF) cables for enhanced safety in enclosed turbine nacelles and substations.
Key Drivers, Barriers & Challenges in Wind Energy Cables
Key Drivers:
The Wind Energy Cables market is primarily propelled by the global imperative to decarbonize energy systems and achieve sustainability goals. Robust government support through favorable policies, subsidies, and renewable energy targets is a significant catalyst, driving substantial investment in wind farm development. Technological advancements in turbine efficiency and size necessitate increasingly sophisticated and higher-capacity wind energy cables. Furthermore, the declining cost of wind energy, making it competitive with traditional power sources, fuels its adoption worldwide.
- Global Climate Change Initiatives: Driving demand for renewable energy solutions.
- Government Policies & Incentives: Subsidies, tax credits, and renewable portfolio standards.
- Technological Advancements in Turbines: Larger, more powerful turbines require advanced cabling.
- Cost Competitiveness of Wind Energy: Making it an attractive investment.
Barriers & Challenges:
Despite robust growth, the market faces several hurdles. The upfront capital investment required for establishing manufacturing facilities for specialized high-voltage cables can be substantial, acting as a barrier to entry for new players. Supply chain disruptions, particularly for raw materials like copper and specialized insulation compounds, can lead to price volatility and production delays, impacting project timelines. Stringent quality control and certification processes for wind energy cables add to the cost and complexity of production. Intense competition among established manufacturers also pressures profit margins. Furthermore, the development and deployment of offshore wind farms face unique challenges, including complex installation logistics, harsh environmental conditions, and the need for specialized vessels, which indirectly affect cable demand and deployment.
- High Capital Investment: For specialized manufacturing infrastructure.
- Supply Chain Volatility: Fluctuations in raw material prices and availability.
- Stringent Quality & Certification Requirements: Adding to production costs and lead times.
- Intense Market Competition: Leading to price pressures.
- Offshore Installation Complexities: Logistics and environmental challenges.
Emerging Opportunities in Wind Energy Cables
Emerging opportunities in the Wind Energy Cables market lie in the burgeoning offshore wind sector, particularly in developing markets and the expansion into deeper waters requiring advanced floating wind turbine technology. The increasing demand for highly efficient and reliable VFD and servo cables to support the sophisticated control systems of next-generation turbines presents a significant growth avenue. Innovations in cable insulation and conductor materials that offer improved performance at higher temperatures and voltages, while also being more sustainable, are gaining traction. The development of smart cables with integrated sensing capabilities for real-time condition monitoring and predictive maintenance offers a substantial opportunity for value-added services. Furthermore, the integration of energy storage solutions with wind farms will drive demand for specialized interconnecting cables.
- Floating Offshore Wind Technology: Requiring specialized subsea cables.
- Advanced Control System Cables: High demand for VFD and servo cables.
- Sustainable & High-Performance Materials: Focus on eco-friendly and durable insulation.
- Smart Cables with IoT Integration: For condition monitoring and predictive maintenance.
- Wind Farm Energy Storage Integration: Cables for hybrid renewable energy systems.
Growth Accelerators in the Wind Energy Cables Industry
Long-term growth in the Wind Energy Cables industry is being accelerated by continuous technological breakthroughs in cable design and manufacturing. The development of higher voltage (e.g., 66kV and above) and longer-length cables for offshore applications is a key accelerator, enabling the development of larger and more remote wind farms. Strategic partnerships between cable manufacturers, turbine OEMs, and wind farm developers are fostering innovation and ensuring that cable solutions are tailored to the evolving needs of the industry. The expansion of manufacturing capacities and the adoption of advanced automation in production processes are improving efficiency and reducing costs, further stimulating market growth. Moreover, the increasing focus on grid modernization and the integration of renewable energy sources into the existing power infrastructure are creating sustained demand for reliable and robust wind energy transmission and distribution cables.
Key Players Shaping the Wind Energy Cables Market
- General Cable
- Nexans
- NKT
- Prysmian
- Sumitomo Electric
- Belden
- Encore Wire
- Finolex
- Hangzhou
- Hengtong
- International Wire
- JDR Cables
- KEI Industries
- LS Cable & System
- Southwire
- TPC Wire
Notable Milestones in Wind Energy Cables Sector
- 2021: Prysmian Group announces a significant contract for the supply of export cables for a major offshore wind farm in the North Sea.
- 2022: Nexans unveils its groundbreaking 66kV inter-array cable technology, enhancing efficiency for offshore wind farms.
- 2023: NKT completes a major project supplying HVAC subsea cables for a large-scale offshore wind development.
- 2023: Sumitomo Electric Industries develops a new generation of high-voltage submarine cables for deep-sea wind energy applications.
- 2024: JDR Cables secures a contract for the supply of subsea inter-array cables for a new offshore wind project in the UK.
In-Depth Wind Energy Cables Market Outlook
The future outlook for the Wind Energy Cables market remains exceptionally positive, driven by the global transition to renewable energy and sustained investment in wind power infrastructure. Growth accelerators include ongoing technological advancements in high-voltage transmission and specialized cable types, coupled with strategic collaborations that align cable solutions with evolving turbine technologies. The expansion of offshore wind capacity, particularly in emerging markets, and the development of floating offshore wind platforms, will create substantial demand for advanced subsea cable systems. The increasing focus on grid modernization and the electrification of various sectors further solidify the long-term potential of this market. Companies are poised to benefit from the growing need for reliable, high-performance, and sustainable cabling solutions essential for powering the global energy transition.
Wind Energy Cables Segmentation
-
1. Application
- 1.1. Offshore Wind Energy
- 1.2. Onshore Wind Energy
-
2. Types
- 2.1. Standard Cable
- 2.2. Premium Cable
- 2.3. Servo Cable
- 2.4. VFD Cable
- 2.5. Others
Wind Energy Cables Segmentation By Geography
-
1. North America
- 1.1. United States
- 1.2. Canada
- 1.3. Mexico
-
2. South America
- 2.1. Brazil
- 2.2. Argentina
- 2.3. Rest of South America
-
3. Europe
- 3.1. United Kingdom
- 3.2. Germany
- 3.3. France
- 3.4. Italy
- 3.5. Spain
- 3.6. Russia
- 3.7. Benelux
- 3.8. Nordics
- 3.9. Rest of Europe
-
4. Middle East & Africa
- 4.1. Turkey
- 4.2. Israel
- 4.3. GCC
- 4.4. North Africa
- 4.5. South Africa
- 4.6. Rest of Middle East & Africa
-
5. Asia Pacific
- 5.1. China
- 5.2. India
- 5.3. Japan
- 5.4. South Korea
- 5.5. ASEAN
- 5.6. Oceania
- 5.7. Rest of Asia Pacific
Wind Energy Cables REPORT HIGHLIGHTS
| Aspects | Details |
|---|---|
| Study Period | 2019-2033 |
| Base Year | 2024 |
| Estimated Year | 2025 |
| Forecast Period | 2025-2033 |
| Historical Period | 2019-2024 |
| Growth Rate | CAGR of XX% from 2019-2033 |
| Segmentation |
|
Table of Contents
- 1. Introduction
- 1.1. Research Scope
- 1.2. Market Segmentation
- 1.3. Research Methodology
- 1.4. Definitions and Assumptions
- 2. Executive Summary
- 2.1. Introduction
- 3. Market Dynamics
- 3.1. Introduction
- 3.2. Market Drivers
- 3.3. Market Restrains
- 3.4. Market Trends
- 4. Market Factor Analysis
- 4.1. Porters Five Forces
- 4.2. Supply/Value Chain
- 4.3. PESTEL analysis
- 4.4. Market Entropy
- 4.5. Patent/Trademark Analysis
- 5. Global Wind Energy Cables Analysis, Insights and Forecast, 2019-2031
- 5.1. Market Analysis, Insights and Forecast - by Application
- 5.1.1. Offshore Wind Energy
- 5.1.2. Onshore Wind Energy
- 5.2. Market Analysis, Insights and Forecast - by Types
- 5.2.1. Standard Cable
- 5.2.2. Premium Cable
- 5.2.3. Servo Cable
- 5.2.4. VFD Cable
- 5.2.5. Others
- 5.3. Market Analysis, Insights and Forecast - by Region
- 5.3.1. North America
- 5.3.2. South America
- 5.3.3. Europe
- 5.3.4. Middle East & Africa
- 5.3.5. Asia Pacific
- 5.1. Market Analysis, Insights and Forecast - by Application
- 6. North America Wind Energy Cables Analysis, Insights and Forecast, 2019-2031
- 6.1. Market Analysis, Insights and Forecast - by Application
- 6.1.1. Offshore Wind Energy
- 6.1.2. Onshore Wind Energy
- 6.2. Market Analysis, Insights and Forecast - by Types
- 6.2.1. Standard Cable
- 6.2.2. Premium Cable
- 6.2.3. Servo Cable
- 6.2.4. VFD Cable
- 6.2.5. Others
- 6.1. Market Analysis, Insights and Forecast - by Application
- 7. South America Wind Energy Cables Analysis, Insights and Forecast, 2019-2031
- 7.1. Market Analysis, Insights and Forecast - by Application
- 7.1.1. Offshore Wind Energy
- 7.1.2. Onshore Wind Energy
- 7.2. Market Analysis, Insights and Forecast - by Types
- 7.2.1. Standard Cable
- 7.2.2. Premium Cable
- 7.2.3. Servo Cable
- 7.2.4. VFD Cable
- 7.2.5. Others
- 7.1. Market Analysis, Insights and Forecast - by Application
- 8. Europe Wind Energy Cables Analysis, Insights and Forecast, 2019-2031
- 8.1. Market Analysis, Insights and Forecast - by Application
- 8.1.1. Offshore Wind Energy
- 8.1.2. Onshore Wind Energy
- 8.2. Market Analysis, Insights and Forecast - by Types
- 8.2.1. Standard Cable
- 8.2.2. Premium Cable
- 8.2.3. Servo Cable
- 8.2.4. VFD Cable
- 8.2.5. Others
- 8.1. Market Analysis, Insights and Forecast - by Application
- 9. Middle East & Africa Wind Energy Cables Analysis, Insights and Forecast, 2019-2031
- 9.1. Market Analysis, Insights and Forecast - by Application
- 9.1.1. Offshore Wind Energy
- 9.1.2. Onshore Wind Energy
- 9.2. Market Analysis, Insights and Forecast - by Types
- 9.2.1. Standard Cable
- 9.2.2. Premium Cable
- 9.2.3. Servo Cable
- 9.2.4. VFD Cable
- 9.2.5. Others
- 9.1. Market Analysis, Insights and Forecast - by Application
- 10. Asia Pacific Wind Energy Cables Analysis, Insights and Forecast, 2019-2031
- 10.1. Market Analysis, Insights and Forecast - by Application
- 10.1.1. Offshore Wind Energy
- 10.1.2. Onshore Wind Energy
- 10.2. Market Analysis, Insights and Forecast - by Types
- 10.2.1. Standard Cable
- 10.2.2. Premium Cable
- 10.2.3. Servo Cable
- 10.2.4. VFD Cable
- 10.2.5. Others
- 10.1. Market Analysis, Insights and Forecast - by Application
- 11. Competitive Analysis
- 11.1. Global Market Share Analysis 2024
- 11.2. Company Profiles
- 11.2.1 General Cable
- 11.2.1.1. Overview
- 11.2.1.2. Products
- 11.2.1.3. SWOT Analysis
- 11.2.1.4. Recent Developments
- 11.2.1.5. Financials (Based on Availability)
- 11.2.2 Nexans
- 11.2.2.1. Overview
- 11.2.2.2. Products
- 11.2.2.3. SWOT Analysis
- 11.2.2.4. Recent Developments
- 11.2.2.5. Financials (Based on Availability)
- 11.2.3 NKT
- 11.2.3.1. Overview
- 11.2.3.2. Products
- 11.2.3.3. SWOT Analysis
- 11.2.3.4. Recent Developments
- 11.2.3.5. Financials (Based on Availability)
- 11.2.4 Prysmian
- 11.2.4.1. Overview
- 11.2.4.2. Products
- 11.2.4.3. SWOT Analysis
- 11.2.4.4. Recent Developments
- 11.2.4.5. Financials (Based on Availability)
- 11.2.5 Sumitomo Electric
- 11.2.5.1. Overview
- 11.2.5.2. Products
- 11.2.5.3. SWOT Analysis
- 11.2.5.4. Recent Developments
- 11.2.5.5. Financials (Based on Availability)
- 11.2.6 Belden
- 11.2.6.1. Overview
- 11.2.6.2. Products
- 11.2.6.3. SWOT Analysis
- 11.2.6.4. Recent Developments
- 11.2.6.5. Financials (Based on Availability)
- 11.2.7 Encore Wire
- 11.2.7.1. Overview
- 11.2.7.2. Products
- 11.2.7.3. SWOT Analysis
- 11.2.7.4. Recent Developments
- 11.2.7.5. Financials (Based on Availability)
- 11.2.8 Finolex
- 11.2.8.1. Overview
- 11.2.8.2. Products
- 11.2.8.3. SWOT Analysis
- 11.2.8.4. Recent Developments
- 11.2.8.5. Financials (Based on Availability)
- 11.2.9 Hangzhou
- 11.2.9.1. Overview
- 11.2.9.2. Products
- 11.2.9.3. SWOT Analysis
- 11.2.9.4. Recent Developments
- 11.2.9.5. Financials (Based on Availability)
- 11.2.10 Hengtong
- 11.2.10.1. Overview
- 11.2.10.2. Products
- 11.2.10.3. SWOT Analysis
- 11.2.10.4. Recent Developments
- 11.2.10.5. Financials (Based on Availability)
- 11.2.11 International Wire
- 11.2.11.1. Overview
- 11.2.11.2. Products
- 11.2.11.3. SWOT Analysis
- 11.2.11.4. Recent Developments
- 11.2.11.5. Financials (Based on Availability)
- 11.2.12 JDR Cables
- 11.2.12.1. Overview
- 11.2.12.2. Products
- 11.2.12.3. SWOT Analysis
- 11.2.12.4. Recent Developments
- 11.2.12.5. Financials (Based on Availability)
- 11.2.13 KEI Industries
- 11.2.13.1. Overview
- 11.2.13.2. Products
- 11.2.13.3. SWOT Analysis
- 11.2.13.4. Recent Developments
- 11.2.13.5. Financials (Based on Availability)
- 11.2.14 LS Cable & System
- 11.2.14.1. Overview
- 11.2.14.2. Products
- 11.2.14.3. SWOT Analysis
- 11.2.14.4. Recent Developments
- 11.2.14.5. Financials (Based on Availability)
- 11.2.15 Southwire
- 11.2.15.1. Overview
- 11.2.15.2. Products
- 11.2.15.3. SWOT Analysis
- 11.2.15.4. Recent Developments
- 11.2.15.5. Financials (Based on Availability)
- 11.2.16 TPC Wire
- 11.2.16.1. Overview
- 11.2.16.2. Products
- 11.2.16.3. SWOT Analysis
- 11.2.16.4. Recent Developments
- 11.2.16.5. Financials (Based on Availability)
- 11.2.1 General Cable
List of Figures
- Figure 1: Global Wind Energy Cables Revenue Breakdown (million, %) by Region 2024 & 2032
- Figure 2: North America Wind Energy Cables Revenue (million), by Application 2024 & 2032
- Figure 3: North America Wind Energy Cables Revenue Share (%), by Application 2024 & 2032
- Figure 4: North America Wind Energy Cables Revenue (million), by Types 2024 & 2032
- Figure 5: North America Wind Energy Cables Revenue Share (%), by Types 2024 & 2032
- Figure 6: North America Wind Energy Cables Revenue (million), by Country 2024 & 2032
- Figure 7: North America Wind Energy Cables Revenue Share (%), by Country 2024 & 2032
- Figure 8: South America Wind Energy Cables Revenue (million), by Application 2024 & 2032
- Figure 9: South America Wind Energy Cables Revenue Share (%), by Application 2024 & 2032
- Figure 10: South America Wind Energy Cables Revenue (million), by Types 2024 & 2032
- Figure 11: South America Wind Energy Cables Revenue Share (%), by Types 2024 & 2032
- Figure 12: South America Wind Energy Cables Revenue (million), by Country 2024 & 2032
- Figure 13: South America Wind Energy Cables Revenue Share (%), by Country 2024 & 2032
- Figure 14: Europe Wind Energy Cables Revenue (million), by Application 2024 & 2032
- Figure 15: Europe Wind Energy Cables Revenue Share (%), by Application 2024 & 2032
- Figure 16: Europe Wind Energy Cables Revenue (million), by Types 2024 & 2032
- Figure 17: Europe Wind Energy Cables Revenue Share (%), by Types 2024 & 2032
- Figure 18: Europe Wind Energy Cables Revenue (million), by Country 2024 & 2032
- Figure 19: Europe Wind Energy Cables Revenue Share (%), by Country 2024 & 2032
- Figure 20: Middle East & Africa Wind Energy Cables Revenue (million), by Application 2024 & 2032
- Figure 21: Middle East & Africa Wind Energy Cables Revenue Share (%), by Application 2024 & 2032
- Figure 22: Middle East & Africa Wind Energy Cables Revenue (million), by Types 2024 & 2032
- Figure 23: Middle East & Africa Wind Energy Cables Revenue Share (%), by Types 2024 & 2032
- Figure 24: Middle East & Africa Wind Energy Cables Revenue (million), by Country 2024 & 2032
- Figure 25: Middle East & Africa Wind Energy Cables Revenue Share (%), by Country 2024 & 2032
- Figure 26: Asia Pacific Wind Energy Cables Revenue (million), by Application 2024 & 2032
- Figure 27: Asia Pacific Wind Energy Cables Revenue Share (%), by Application 2024 & 2032
- Figure 28: Asia Pacific Wind Energy Cables Revenue (million), by Types 2024 & 2032
- Figure 29: Asia Pacific Wind Energy Cables Revenue Share (%), by Types 2024 & 2032
- Figure 30: Asia Pacific Wind Energy Cables Revenue (million), by Country 2024 & 2032
- Figure 31: Asia Pacific Wind Energy Cables Revenue Share (%), by Country 2024 & 2032
List of Tables
- Table 1: Global Wind Energy Cables Revenue million Forecast, by Region 2019 & 2032
- Table 2: Global Wind Energy Cables Revenue million Forecast, by Application 2019 & 2032
- Table 3: Global Wind Energy Cables Revenue million Forecast, by Types 2019 & 2032
- Table 4: Global Wind Energy Cables Revenue million Forecast, by Region 2019 & 2032
- Table 5: Global Wind Energy Cables Revenue million Forecast, by Application 2019 & 2032
- Table 6: Global Wind Energy Cables Revenue million Forecast, by Types 2019 & 2032
- Table 7: Global Wind Energy Cables Revenue million Forecast, by Country 2019 & 2032
- Table 8: United States Wind Energy Cables Revenue (million) Forecast, by Application 2019 & 2032
- Table 9: Canada Wind Energy Cables Revenue (million) Forecast, by Application 2019 & 2032
- Table 10: Mexico Wind Energy Cables Revenue (million) Forecast, by Application 2019 & 2032
- Table 11: Global Wind Energy Cables Revenue million Forecast, by Application 2019 & 2032
- Table 12: Global Wind Energy Cables Revenue million Forecast, by Types 2019 & 2032
- Table 13: Global Wind Energy Cables Revenue million Forecast, by Country 2019 & 2032
- Table 14: Brazil Wind Energy Cables Revenue (million) Forecast, by Application 2019 & 2032
- Table 15: Argentina Wind Energy Cables Revenue (million) Forecast, by Application 2019 & 2032
- Table 16: Rest of South America Wind Energy Cables Revenue (million) Forecast, by Application 2019 & 2032
- Table 17: Global Wind Energy Cables Revenue million Forecast, by Application 2019 & 2032
- Table 18: Global Wind Energy Cables Revenue million Forecast, by Types 2019 & 2032
- Table 19: Global Wind Energy Cables Revenue million Forecast, by Country 2019 & 2032
- Table 20: United Kingdom Wind Energy Cables Revenue (million) Forecast, by Application 2019 & 2032
- Table 21: Germany Wind Energy Cables Revenue (million) Forecast, by Application 2019 & 2032
- Table 22: France Wind Energy Cables Revenue (million) Forecast, by Application 2019 & 2032
- Table 23: Italy Wind Energy Cables Revenue (million) Forecast, by Application 2019 & 2032
- Table 24: Spain Wind Energy Cables Revenue (million) Forecast, by Application 2019 & 2032
- Table 25: Russia Wind Energy Cables Revenue (million) Forecast, by Application 2019 & 2032
- Table 26: Benelux Wind Energy Cables Revenue (million) Forecast, by Application 2019 & 2032
- Table 27: Nordics Wind Energy Cables Revenue (million) Forecast, by Application 2019 & 2032
- Table 28: Rest of Europe Wind Energy Cables Revenue (million) Forecast, by Application 2019 & 2032
- Table 29: Global Wind Energy Cables Revenue million Forecast, by Application 2019 & 2032
- Table 30: Global Wind Energy Cables Revenue million Forecast, by Types 2019 & 2032
- Table 31: Global Wind Energy Cables Revenue million Forecast, by Country 2019 & 2032
- Table 32: Turkey Wind Energy Cables Revenue (million) Forecast, by Application 2019 & 2032
- Table 33: Israel Wind Energy Cables Revenue (million) Forecast, by Application 2019 & 2032
- Table 34: GCC Wind Energy Cables Revenue (million) Forecast, by Application 2019 & 2032
- Table 35: North Africa Wind Energy Cables Revenue (million) Forecast, by Application 2019 & 2032
- Table 36: South Africa Wind Energy Cables Revenue (million) Forecast, by Application 2019 & 2032
- Table 37: Rest of Middle East & Africa Wind Energy Cables Revenue (million) Forecast, by Application 2019 & 2032
- Table 38: Global Wind Energy Cables Revenue million Forecast, by Application 2019 & 2032
- Table 39: Global Wind Energy Cables Revenue million Forecast, by Types 2019 & 2032
- Table 40: Global Wind Energy Cables Revenue million Forecast, by Country 2019 & 2032
- Table 41: China Wind Energy Cables Revenue (million) Forecast, by Application 2019 & 2032
- Table 42: India Wind Energy Cables Revenue (million) Forecast, by Application 2019 & 2032
- Table 43: Japan Wind Energy Cables Revenue (million) Forecast, by Application 2019 & 2032
- Table 44: South Korea Wind Energy Cables Revenue (million) Forecast, by Application 2019 & 2032
- Table 45: ASEAN Wind Energy Cables Revenue (million) Forecast, by Application 2019 & 2032
- Table 46: Oceania Wind Energy Cables Revenue (million) Forecast, by Application 2019 & 2032
- Table 47: Rest of Asia Pacific Wind Energy Cables Revenue (million) Forecast, by Application 2019 & 2032
Frequently Asked Questions
1. What is the projected Compound Annual Growth Rate (CAGR) of the Wind Energy Cables?
The projected CAGR is approximately XX%.
2. Which companies are prominent players in the Wind Energy Cables?
Key companies in the market include General Cable, Nexans, NKT, Prysmian, Sumitomo Electric, Belden, Encore Wire, Finolex, Hangzhou, Hengtong, International Wire, JDR Cables, KEI Industries, LS Cable & System, Southwire, TPC Wire.
3. What are the main segments of the Wind Energy Cables?
The market segments include Application, Types.
4. Can you provide details about the market size?
The market size is estimated to be USD XXX million as of 2022.
5. What are some drivers contributing to market growth?
N/A
6. What are the notable trends driving market growth?
N/A
7. Are there any restraints impacting market growth?
N/A
8. Can you provide examples of recent developments in the market?
N/A
9. What pricing options are available for accessing the report?
Pricing options include single-user, multi-user, and enterprise licenses priced at USD 4900.00, USD 7350.00, and USD 9800.00 respectively.
10. Is the market size provided in terms of value or volume?
The market size is provided in terms of value, measured in million.
11. Are there any specific market keywords associated with the report?
Yes, the market keyword associated with the report is "Wind Energy Cables," which aids in identifying and referencing the specific market segment covered.
12. How do I determine which pricing option suits my needs best?
The pricing options vary based on user requirements and access needs. Individual users may opt for single-user licenses, while businesses requiring broader access may choose multi-user or enterprise licenses for cost-effective access to the report.
13. Are there any additional resources or data provided in the Wind Energy Cables report?
While the report offers comprehensive insights, it's advisable to review the specific contents or supplementary materials provided to ascertain if additional resources or data are available.
14. How can I stay updated on further developments or reports in the Wind Energy Cables?
To stay informed about further developments, trends, and reports in the Wind Energy Cables, consider subscribing to industry newsletters, following relevant companies and organizations, or regularly checking reputable industry news sources and publications.
Methodology
Step 1 - Identification of Relevant Samples Size from Population Database


Step 2 - Approaches for Defining Global Market Size (Value, Volume* & Price*)

Note*: In applicable scenarios
Step 3 - Data Sources
Primary Research
- Web Analytics
- Survey Reports
- Research Institute
- Latest Research Reports
- Opinion Leaders
Secondary Research
- Annual Reports
- White Paper
- Latest Press Release
- Industry Association
- Paid Database
- Investor Presentations

Step 4 - Data Triangulation
Involves using different sources of information in order to increase the validity of a study
These sources are likely to be stakeholders in a program - participants, other researchers, program staff, other community members, and so on.
Then we put all data in single framework & apply various statistical tools to find out the dynamic on the market.
During the analysis stage, feedback from the stakeholder groups would be compared to determine areas of agreement as well as areas of divergence


