
Key Insights
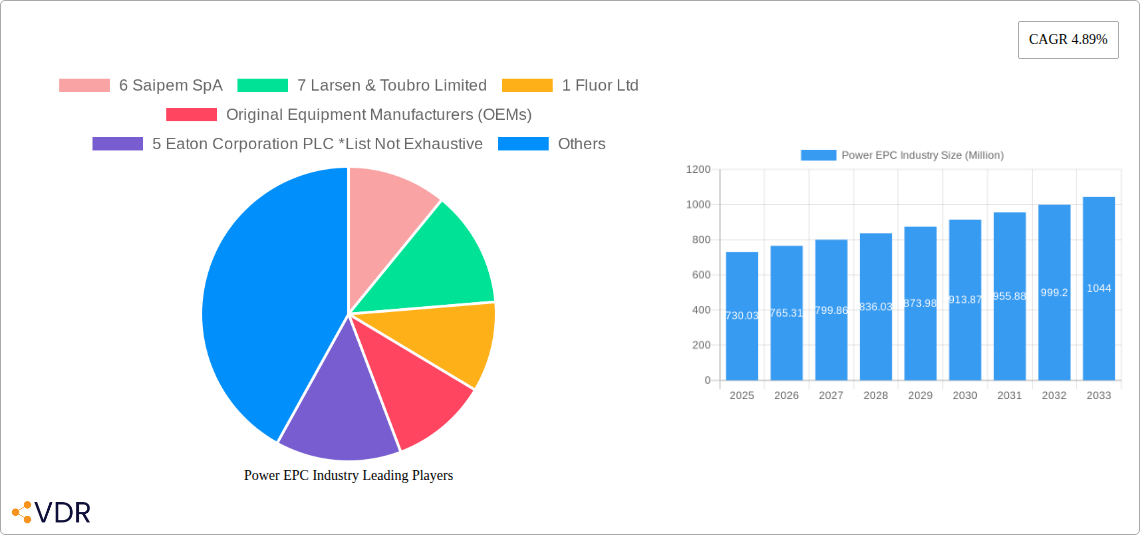
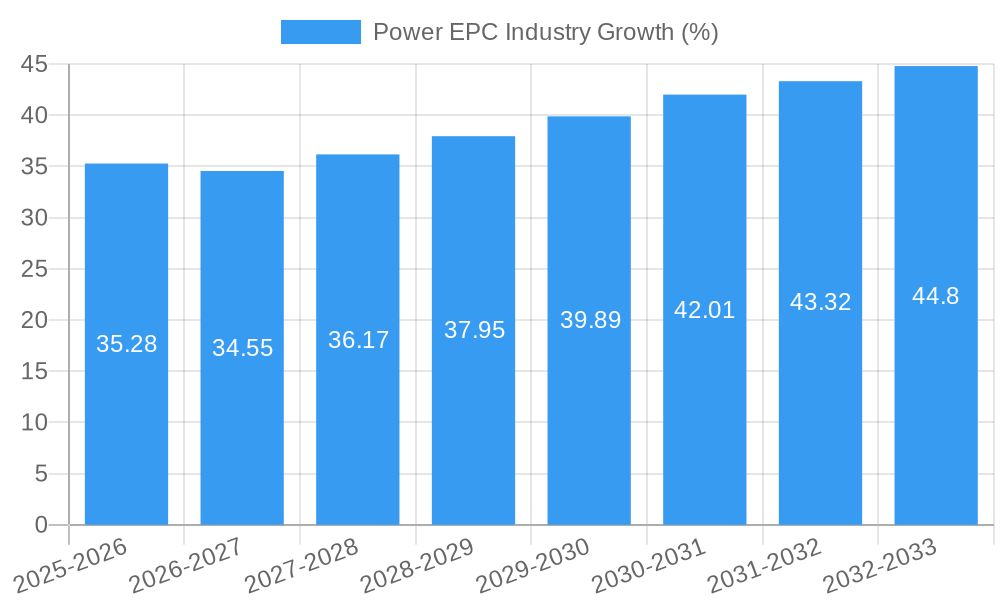
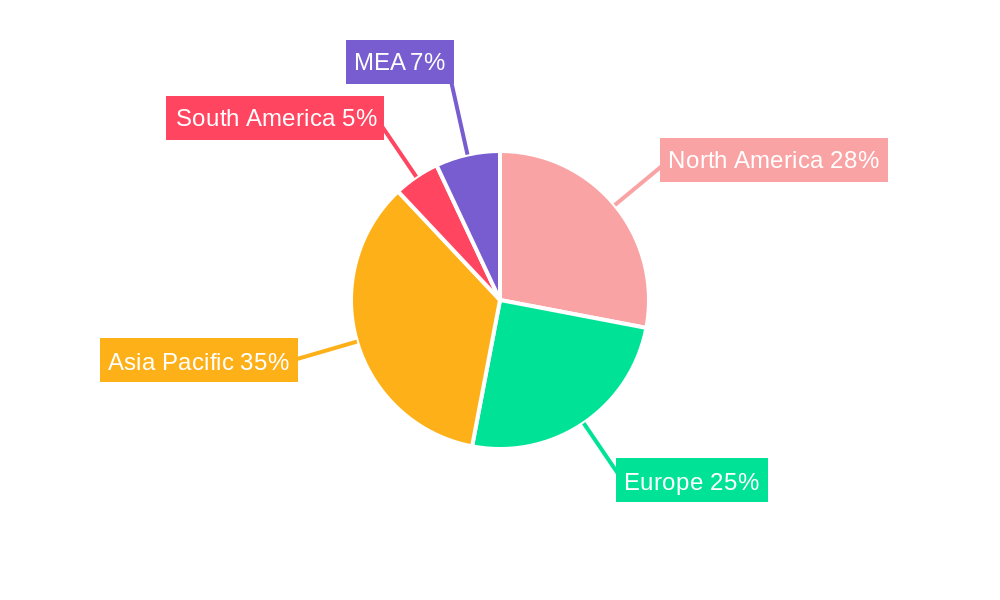
The global Power EPC (Engineering, Procurement, and Construction) industry, valued at $730.03 million in 2025, is projected to experience robust growth, driven by increasing global energy demand and the imperative to transition towards cleaner energy sources. A compound annual growth rate (CAGR) of 4.89% from 2025 to 2033 signifies a considerable expansion of the market. Key drivers include the rising adoption of renewable energy technologies (solar, wind, hydro), government initiatives promoting energy independence and infrastructure development, and the modernization of aging power grids. The industry is segmented by power generation type, with thermal, hydroelectric, nuclear, and renewables representing significant market segments. Renewables are expected to witness the most substantial growth, fueled by environmental concerns and supportive government policies. Geographic expansion, particularly in rapidly developing economies in Asia-Pacific and the Middle East and Africa (MEA), presents significant opportunities for EPC companies. However, challenges remain, including fluctuating raw material prices, project complexities, and geopolitical uncertainties that may influence market growth.
Competition within the Power EPC sector is intense, with major players like Siemens Energy AG, General Electric Company, and ABB Ltd. vying for market share. These established players are facing competition from smaller, specialized EPC firms, particularly in the renewable energy segment. Furthermore, Original Equipment Manufacturers (OEMs) are increasingly integrating EPC capabilities, leading to greater competition and potentially impacting profit margins. The industry's future trajectory is likely to be shaped by technological advancements in energy storage, smart grids, and digitalization, creating opportunities for companies adept at innovation and technological integration. Successful companies will likely demonstrate expertise in multiple power generation technologies, project management capabilities, and a strong global presence to navigate the complex regulatory landscape and effectively serve diverse clientele.
Power EPC Industry Market Report: 2019-2033
This comprehensive report provides a detailed analysis of the Power EPC (Engineering, Procurement, and Construction) industry, encompassing market dynamics, growth trends, regional insights, competitive landscape, and future outlook. The study period covers 2019-2033, with 2025 as the base and estimated year. The report is essential for industry professionals, investors, and strategic decision-makers seeking to understand and capitalize on opportunities within this dynamic sector.
Keywords: Power EPC, Engineering Procurement Construction, Power Generation, Renewables, Thermal Power, Hydroelectric Power, Nuclear Power, EPC Developers, Market Size, Market Share, Growth Rate, CAGR, Market Analysis, Competitive Landscape, Industry Trends, Saipem, Larsen & Toubro, Fluor, Siemens Energy, ABB, Bechtel, KBR, Schneider Electric, Kiewit, NTPC, NEEPCO, Tata Power Solar.
Power EPC Industry Market Dynamics & Structure
The Power EPC market is characterized by moderate concentration, with several multinational corporations and specialized EPC developers dominating. Technological innovation, driven by the increasing adoption of renewable energy sources and smart grids, significantly shapes market dynamics. Stringent regulatory frameworks, varying across regions, influence project development and execution. Competitive product substitutes, primarily focusing on cost-effectiveness and efficiency, pose challenges to traditional EPC models. End-user demographics, including government agencies, private power producers, and independent power producers (IPPs), drive demand variations. M&A activity has been moderate in recent years, with xx deals valued at approximately xx Million USD recorded between 2019 and 2024.
- Market Concentration: Moderately concentrated, with top 10 players holding approximately xx% market share in 2024.
- Technological Innovation: Strong focus on digitalization, automation, and renewable energy integration.
- Regulatory Frameworks: Vary significantly across regions, impacting project timelines and costs.
- Competitive Substitutes: Modular construction and prefabricated components are gaining traction.
- End-User Demographics: Government initiatives and private sector investment drive substantial demand.
- M&A Trends: Consolidation expected to increase in the forecast period, driven by economies of scale and geographical expansion.
Power EPC Industry Growth Trends & Insights
The global Power EPC market is witnessing robust growth, driven by rising energy demand, expanding power generation capacity, and increasing investments in renewable energy infrastructure. From 2019 to 2024, the market witnessed a CAGR of xx%, reaching xx Million USD in 2024. This growth is propelled by significant government investments in power infrastructure projects across various regions, notably in developing economies. The adoption of advanced technologies, such as digital twins and AI-powered predictive maintenance, has improved project efficiency and reduced downtime, further boosting market expansion. Consumer behavior is shifting towards sustainable energy sources, driving increased demand for renewable energy EPC projects. The forecast period (2025-2033) projects a CAGR of xx%, with the market size expected to reach xx Million USD by 2033. Market penetration for renewable energy EPC projects is expected to increase from xx% in 2024 to xx% by 2033.
Dominant Regions, Countries, or Segments in Power EPC Industry
The Asia-Pacific region emerged as the dominant market in 2024, accounting for xx% of the global market share, driven by large-scale infrastructure projects and significant investments in renewable energy. China and India are key growth drivers in this region. The North American market shows substantial growth potential due to increasing renewable energy installations and grid modernization initiatives.
- Key Drivers:
- Asia-Pacific: Massive infrastructure development, supportive government policies, and a large energy demand.
- North America: Renewables expansion, grid modernization efforts, and technological advancements.
- Europe: Stringent environmental regulations and investments in sustainable energy transition.
- Dominance Factors: Favorable government policies, large-scale projects, and robust economic growth contribute to regional dominance.
- Growth Potential: Developing economies in Asia and Africa present significant growth opportunities, driven by increasing urbanization and energy access initiatives. The Renewables segment is poised for the most rapid growth, driven by government incentives and decreasing technology costs.
Power EPC Industry Product Landscape
The Power EPC industry offers a diverse range of products and services, including design, engineering, procurement, construction, commissioning, and operation and maintenance (O&M) of power generation facilities. Recent innovations focus on modular construction, prefabricated components, and digital solutions to optimize project timelines and costs. Technological advancements such as AI-powered predictive maintenance and smart grid integration are enhancing operational efficiency and reducing downtime. Unique selling propositions include specialized expertise in specific power generation technologies (e.g., offshore wind, solar PV), and integrated project delivery models to optimize efficiency and control costs.
Key Drivers, Barriers & Challenges in Power EPC Industry
Key Drivers:
- Increasing global energy demand.
- Government initiatives promoting renewable energy.
- Technological advancements in power generation and transmission.
- Investments in grid modernization and smart grid technologies.
Challenges and Restraints:
- Supply chain disruptions resulting in material cost increases and project delays. Quantifiable impact: xx% increase in project costs in 2024.
- Stringent regulatory approvals and permitting processes causing significant delays. Average delay: xx months per project in 2024.
- Intense competition from established players and new entrants affecting profit margins. Average profit margin reduction: xx% in 2024.
Emerging Opportunities in Power EPC Industry
- Growth in off-grid and decentralized power generation solutions.
- Increasing demand for microgrids and distributed energy resources (DERs).
- Expansion into emerging markets with untapped power generation potential.
- Development of innovative financing models for large-scale EPC projects.
Growth Accelerators in the Power EPC Industry
Technological breakthroughs in renewable energy technologies, such as advancements in solar PV and wind turbine efficiency, are accelerating market growth. Strategic partnerships between EPC companies and technology providers are facilitating the adoption of innovative solutions. Expansion into new geographic markets, particularly in developing economies with significant power generation needs, will drive significant growth in the coming years.
Key Players Shaping the Power EPC Industry Market
- Saipem SpA
- Larsen & Toubro Limited
- Fluor Ltd
- Original Equipment Manufacturers (OEMs)
- Eaton Corporation PLC
- McDermott International Inc
- Siemens Energy AG
- John Wood PLC
- EPC Developers
- ABB Ltd
- General Electric Company
- Bechtel Corporation
- KBR Inc
- Schneider Electric SE
- Kiewit Corporation
Notable Milestones in Power EPC Industry Sector
- October 2023: NTPC Green Energy Ltd (NGEL) tenders a 300 MW solar EPC package for NEEPCO, highlighting growth in renewable energy projects.
- June 2022: Tata Power Solar Systems commissions a 66 MW EPC project for Vibrant Energy, demonstrating continued investment in renewable energy infrastructure.
In-Depth Power EPC Industry Market Outlook
The Power EPC market is poised for sustained growth, driven by increasing energy demand, the transition to renewable energy sources, and technological advancements. Strategic opportunities exist in leveraging digital technologies to enhance project efficiency and reduce costs, expanding into emerging markets, and developing innovative financing models for large-scale projects. The continued focus on sustainability and the need for reliable power infrastructure will propel significant growth in the forecast period.
Power EPC Industry Segmentation
-
1. Power Generation
- 1.1. Thermal
- 1.2. Hydroelectric
- 1.3. Nuclear
- 1.4. Renewables
- 2. Power Tr
Power EPC Industry Segmentation By Geography
-
1. North America
- 1.1. United States
- 1.2. Canada
- 1.3. Rest of North America
-
2. Europe
- 2.1. Germany
- 2.2. United Kingdom
- 2.3. Italy
- 2.4. Spain
- 2.5. France
- 2.6. Rest of Europe
-
3. Asia Pacific
- 3.1. China
- 3.2. India
- 3.3. Japan
- 3.4. Australia
- 3.5. South Korea
- 3.6. Rest of Asia Pacific
-
4. South America
- 4.1. Brazil
- 4.2. Argentina
- 4.3. Chile
- 4.4. Rest of South America
-
5. Middle East and Africa
- 5.1. Saudi Arabia
- 5.2. United Arab Emirates
- 5.3. South Africa
- 5.4. Nigeria
- 5.5. Egypt
- 5.6. Rest of Middle East and Africa
Power EPC Industry REPORT HIGHLIGHTS
| Aspects | Details |
|---|---|
| Study Period | 2019-2033 |
| Base Year | 2024 |
| Estimated Year | 2025 |
| Forecast Period | 2025-2033 |
| Historical Period | 2019-2024 |
| Growth Rate | CAGR of 4.89% from 2019-2033 |
| Segmentation |
|
Table of Contents
- 1. Introduction
- 1.1. Research Scope
- 1.2. Market Segmentation
- 1.3. Research Methodology
- 1.4. Definitions and Assumptions
- 2. Executive Summary
- 2.1. Introduction
- 3. Market Dynamics
- 3.1. Introduction
- 3.2. Market Drivers
- 3.2.1. 4.; Growing Energy Demand4.; Renewable Energy Transition
- 3.3. Market Restrains
- 3.3.1. 4.; Phasing out of Conventional Sources of Electricity
- 3.4. Market Trends
- 3.4.1. Renewable Expected to be the Fastest-growing Market Segment
- 4. Market Factor Analysis
- 4.1. Porters Five Forces
- 4.2. Supply/Value Chain
- 4.3. PESTEL analysis
- 4.4. Market Entropy
- 4.5. Patent/Trademark Analysis
- 5. Global Power EPC Industry Analysis, Insights and Forecast, 2019-2031
- 5.1. Market Analysis, Insights and Forecast - by Power Generation
- 5.1.1. Thermal
- 5.1.2. Hydroelectric
- 5.1.3. Nuclear
- 5.1.4. Renewables
- 5.2. Market Analysis, Insights and Forecast - by Power Tr
- 5.3. Market Analysis, Insights and Forecast - by Region
- 5.3.1. North America
- 5.3.2. Europe
- 5.3.3. Asia Pacific
- 5.3.4. South America
- 5.3.5. Middle East and Africa
- 5.1. Market Analysis, Insights and Forecast - by Power Generation
- 6. North America Power EPC Industry Analysis, Insights and Forecast, 2019-2031
- 6.1. Market Analysis, Insights and Forecast - by Power Generation
- 6.1.1. Thermal
- 6.1.2. Hydroelectric
- 6.1.3. Nuclear
- 6.1.4. Renewables
- 6.2. Market Analysis, Insights and Forecast - by Power Tr
- 6.1. Market Analysis, Insights and Forecast - by Power Generation
- 7. Europe Power EPC Industry Analysis, Insights and Forecast, 2019-2031
- 7.1. Market Analysis, Insights and Forecast - by Power Generation
- 7.1.1. Thermal
- 7.1.2. Hydroelectric
- 7.1.3. Nuclear
- 7.1.4. Renewables
- 7.2. Market Analysis, Insights and Forecast - by Power Tr
- 7.1. Market Analysis, Insights and Forecast - by Power Generation
- 8. Asia Pacific Power EPC Industry Analysis, Insights and Forecast, 2019-2031
- 8.1. Market Analysis, Insights and Forecast - by Power Generation
- 8.1.1. Thermal
- 8.1.2. Hydroelectric
- 8.1.3. Nuclear
- 8.1.4. Renewables
- 8.2. Market Analysis, Insights and Forecast - by Power Tr
- 8.1. Market Analysis, Insights and Forecast - by Power Generation
- 9. South America Power EPC Industry Analysis, Insights and Forecast, 2019-2031
- 9.1. Market Analysis, Insights and Forecast - by Power Generation
- 9.1.1. Thermal
- 9.1.2. Hydroelectric
- 9.1.3. Nuclear
- 9.1.4. Renewables
- 9.2. Market Analysis, Insights and Forecast - by Power Tr
- 9.1. Market Analysis, Insights and Forecast - by Power Generation
- 10. Middle East and Africa Power EPC Industry Analysis, Insights and Forecast, 2019-2031
- 10.1. Market Analysis, Insights and Forecast - by Power Generation
- 10.1.1. Thermal
- 10.1.2. Hydroelectric
- 10.1.3. Nuclear
- 10.1.4. Renewables
- 10.2. Market Analysis, Insights and Forecast - by Power Tr
- 10.1. Market Analysis, Insights and Forecast - by Power Generation
- 11. North America Power EPC Industry Analysis, Insights and Forecast, 2019-2031
- 11.1. Market Analysis, Insights and Forecast - By Country/Sub-region
- 11.1.1 United States
- 11.1.2 Canada
- 11.1.3 Mexico
- 12. Europe Power EPC Industry Analysis, Insights and Forecast, 2019-2031
- 12.1. Market Analysis, Insights and Forecast - By Country/Sub-region
- 12.1.1 Germany
- 12.1.2 United Kingdom
- 12.1.3 France
- 12.1.4 Spain
- 12.1.5 Italy
- 12.1.6 Spain
- 12.1.7 Belgium
- 12.1.8 Netherland
- 12.1.9 Nordics
- 12.1.10 Rest of Europe
- 13. Asia Pacific Power EPC Industry Analysis, Insights and Forecast, 2019-2031
- 13.1. Market Analysis, Insights and Forecast - By Country/Sub-region
- 13.1.1 China
- 13.1.2 Japan
- 13.1.3 India
- 13.1.4 South Korea
- 13.1.5 Southeast Asia
- 13.1.6 Australia
- 13.1.7 Indonesia
- 13.1.8 Phillipes
- 13.1.9 Singapore
- 13.1.10 Thailandc
- 13.1.11 Rest of Asia Pacific
- 14. South America Power EPC Industry Analysis, Insights and Forecast, 2019-2031
- 14.1. Market Analysis, Insights and Forecast - By Country/Sub-region
- 14.1.1 Brazil
- 14.1.2 Argentina
- 14.1.3 Peru
- 14.1.4 Chile
- 14.1.5 Colombia
- 14.1.6 Ecuador
- 14.1.7 Venezuela
- 14.1.8 Rest of South America
- 15. North America Power EPC Industry Analysis, Insights and Forecast, 2019-2031
- 15.1. Market Analysis, Insights and Forecast - By Country/Sub-region
- 15.1.1 United States
- 15.1.2 Canada
- 15.1.3 Mexico
- 16. MEA Power EPC Industry Analysis, Insights and Forecast, 2019-2031
- 16.1. Market Analysis, Insights and Forecast - By Country/Sub-region
- 16.1.1 United Arab Emirates
- 16.1.2 Saudi Arabia
- 16.1.3 South Africa
- 16.1.4 Rest of Middle East and Africa
- 17. Competitive Analysis
- 17.1. Global Market Share Analysis 2024
- 17.2. Company Profiles
- 17.2.1 6 Saipem SpA
- 17.2.1.1. Overview
- 17.2.1.2. Products
- 17.2.1.3. SWOT Analysis
- 17.2.1.4. Recent Developments
- 17.2.1.5. Financials (Based on Availability)
- 17.2.2 7 Larsen & Toubro Limited
- 17.2.2.1. Overview
- 17.2.2.2. Products
- 17.2.2.3. SWOT Analysis
- 17.2.2.4. Recent Developments
- 17.2.2.5. Financials (Based on Availability)
- 17.2.3 1 Fluor Ltd
- 17.2.3.1. Overview
- 17.2.3.2. Products
- 17.2.3.3. SWOT Analysis
- 17.2.3.4. Recent Developments
- 17.2.3.5. Financials (Based on Availability)
- 17.2.4 Original Equipment Manufacturers (OEMs)
- 17.2.4.1. Overview
- 17.2.4.2. Products
- 17.2.4.3. SWOT Analysis
- 17.2.4.4. Recent Developments
- 17.2.4.5. Financials (Based on Availability)
- 17.2.5 5 Eaton Corporation PLC *List Not Exhaustive
- 17.2.5.1. Overview
- 17.2.5.2. Products
- 17.2.5.3. SWOT Analysis
- 17.2.5.4. Recent Developments
- 17.2.5.5. Financials (Based on Availability)
- 17.2.6 4 McDermott International Inc
- 17.2.6.1. Overview
- 17.2.6.2. Products
- 17.2.6.3. SWOT Analysis
- 17.2.6.4. Recent Developments
- 17.2.6.5. Financials (Based on Availability)
- 17.2.7 2 Siemens Energy AG
- 17.2.7.1. Overview
- 17.2.7.2. Products
- 17.2.7.3. SWOT Analysis
- 17.2.7.4. Recent Developments
- 17.2.7.5. Financials (Based on Availability)
- 17.2.8 2 John Wood PLC
- 17.2.8.1. Overview
- 17.2.8.2. Products
- 17.2.8.3. SWOT Analysis
- 17.2.8.4. Recent Developments
- 17.2.8.5. Financials (Based on Availability)
- 17.2.9 EPC Developers
- 17.2.9.1. Overview
- 17.2.9.2. Products
- 17.2.9.3. SWOT Analysis
- 17.2.9.4. Recent Developments
- 17.2.9.5. Financials (Based on Availability)
- 17.2.10 3 ABB Ltd
- 17.2.10.1. Overview
- 17.2.10.2. Products
- 17.2.10.3. SWOT Analysis
- 17.2.10.4. Recent Developments
- 17.2.10.5. Financials (Based on Availability)
- 17.2.11 1 General Electric Company
- 17.2.11.1. Overview
- 17.2.11.2. Products
- 17.2.11.3. SWOT Analysis
- 17.2.11.4. Recent Developments
- 17.2.11.5. Financials (Based on Availability)
- 17.2.12 5 Bechtel Corporation
- 17.2.12.1. Overview
- 17.2.12.2. Products
- 17.2.12.3. SWOT Analysis
- 17.2.12.4. Recent Developments
- 17.2.12.5. Financials (Based on Availability)
- 17.2.13 8 KBR Inc
- 17.2.13.1. Overview
- 17.2.13.2. Products
- 17.2.13.3. SWOT Analysis
- 17.2.13.4. Recent Developments
- 17.2.13.5. Financials (Based on Availability)
- 17.2.14 4 Schneider Electric SE
- 17.2.14.1. Overview
- 17.2.14.2. Products
- 17.2.14.3. SWOT Analysis
- 17.2.14.4. Recent Developments
- 17.2.14.5. Financials (Based on Availability)
- 17.2.15 3 Kiewit Corporation
- 17.2.15.1. Overview
- 17.2.15.2. Products
- 17.2.15.3. SWOT Analysis
- 17.2.15.4. Recent Developments
- 17.2.15.5. Financials (Based on Availability)
- 17.2.1 6 Saipem SpA
List of Figures
- Figure 1: Global Power EPC Industry Revenue Breakdown (Million, %) by Region 2024 & 2032
- Figure 2: Global Power EPC Industry Volume Breakdown (Gigawatt, %) by Region 2024 & 2032
- Figure 3: North America Power EPC Industry Revenue (Million), by Country 2024 & 2032
- Figure 4: North America Power EPC Industry Volume (Gigawatt), by Country 2024 & 2032
- Figure 5: North America Power EPC Industry Revenue Share (%), by Country 2024 & 2032
- Figure 6: North America Power EPC Industry Volume Share (%), by Country 2024 & 2032
- Figure 7: Europe Power EPC Industry Revenue (Million), by Country 2024 & 2032
- Figure 8: Europe Power EPC Industry Volume (Gigawatt), by Country 2024 & 2032
- Figure 9: Europe Power EPC Industry Revenue Share (%), by Country 2024 & 2032
- Figure 10: Europe Power EPC Industry Volume Share (%), by Country 2024 & 2032
- Figure 11: Asia Pacific Power EPC Industry Revenue (Million), by Country 2024 & 2032
- Figure 12: Asia Pacific Power EPC Industry Volume (Gigawatt), by Country 2024 & 2032
- Figure 13: Asia Pacific Power EPC Industry Revenue Share (%), by Country 2024 & 2032
- Figure 14: Asia Pacific Power EPC Industry Volume Share (%), by Country 2024 & 2032
- Figure 15: South America Power EPC Industry Revenue (Million), by Country 2024 & 2032
- Figure 16: South America Power EPC Industry Volume (Gigawatt), by Country 2024 & 2032
- Figure 17: South America Power EPC Industry Revenue Share (%), by Country 2024 & 2032
- Figure 18: South America Power EPC Industry Volume Share (%), by Country 2024 & 2032
- Figure 19: North America Power EPC Industry Revenue (Million), by Country 2024 & 2032
- Figure 20: North America Power EPC Industry Volume (Gigawatt), by Country 2024 & 2032
- Figure 21: North America Power EPC Industry Revenue Share (%), by Country 2024 & 2032
- Figure 22: North America Power EPC Industry Volume Share (%), by Country 2024 & 2032
- Figure 23: MEA Power EPC Industry Revenue (Million), by Country 2024 & 2032
- Figure 24: MEA Power EPC Industry Volume (Gigawatt), by Country 2024 & 2032
- Figure 25: MEA Power EPC Industry Revenue Share (%), by Country 2024 & 2032
- Figure 26: MEA Power EPC Industry Volume Share (%), by Country 2024 & 2032
- Figure 27: North America Power EPC Industry Revenue (Million), by Power Generation 2024 & 2032
- Figure 28: North America Power EPC Industry Volume (Gigawatt), by Power Generation 2024 & 2032
- Figure 29: North America Power EPC Industry Revenue Share (%), by Power Generation 2024 & 2032
- Figure 30: North America Power EPC Industry Volume Share (%), by Power Generation 2024 & 2032
- Figure 31: North America Power EPC Industry Revenue (Million), by Power Tr 2024 & 2032
- Figure 32: North America Power EPC Industry Volume (Gigawatt), by Power Tr 2024 & 2032
- Figure 33: North America Power EPC Industry Revenue Share (%), by Power Tr 2024 & 2032
- Figure 34: North America Power EPC Industry Volume Share (%), by Power Tr 2024 & 2032
- Figure 35: North America Power EPC Industry Revenue (Million), by Country 2024 & 2032
- Figure 36: North America Power EPC Industry Volume (Gigawatt), by Country 2024 & 2032
- Figure 37: North America Power EPC Industry Revenue Share (%), by Country 2024 & 2032
- Figure 38: North America Power EPC Industry Volume Share (%), by Country 2024 & 2032
- Figure 39: Europe Power EPC Industry Revenue (Million), by Power Generation 2024 & 2032
- Figure 40: Europe Power EPC Industry Volume (Gigawatt), by Power Generation 2024 & 2032
- Figure 41: Europe Power EPC Industry Revenue Share (%), by Power Generation 2024 & 2032
- Figure 42: Europe Power EPC Industry Volume Share (%), by Power Generation 2024 & 2032
- Figure 43: Europe Power EPC Industry Revenue (Million), by Power Tr 2024 & 2032
- Figure 44: Europe Power EPC Industry Volume (Gigawatt), by Power Tr 2024 & 2032
- Figure 45: Europe Power EPC Industry Revenue Share (%), by Power Tr 2024 & 2032
- Figure 46: Europe Power EPC Industry Volume Share (%), by Power Tr 2024 & 2032
- Figure 47: Europe Power EPC Industry Revenue (Million), by Country 2024 & 2032
- Figure 48: Europe Power EPC Industry Volume (Gigawatt), by Country 2024 & 2032
- Figure 49: Europe Power EPC Industry Revenue Share (%), by Country 2024 & 2032
- Figure 50: Europe Power EPC Industry Volume Share (%), by Country 2024 & 2032
- Figure 51: Asia Pacific Power EPC Industry Revenue (Million), by Power Generation 2024 & 2032
- Figure 52: Asia Pacific Power EPC Industry Volume (Gigawatt), by Power Generation 2024 & 2032
- Figure 53: Asia Pacific Power EPC Industry Revenue Share (%), by Power Generation 2024 & 2032
- Figure 54: Asia Pacific Power EPC Industry Volume Share (%), by Power Generation 2024 & 2032
- Figure 55: Asia Pacific Power EPC Industry Revenue (Million), by Power Tr 2024 & 2032
- Figure 56: Asia Pacific Power EPC Industry Volume (Gigawatt), by Power Tr 2024 & 2032
- Figure 57: Asia Pacific Power EPC Industry Revenue Share (%), by Power Tr 2024 & 2032
- Figure 58: Asia Pacific Power EPC Industry Volume Share (%), by Power Tr 2024 & 2032
- Figure 59: Asia Pacific Power EPC Industry Revenue (Million), by Country 2024 & 2032
- Figure 60: Asia Pacific Power EPC Industry Volume (Gigawatt), by Country 2024 & 2032
- Figure 61: Asia Pacific Power EPC Industry Revenue Share (%), by Country 2024 & 2032
- Figure 62: Asia Pacific Power EPC Industry Volume Share (%), by Country 2024 & 2032
- Figure 63: South America Power EPC Industry Revenue (Million), by Power Generation 2024 & 2032
- Figure 64: South America Power EPC Industry Volume (Gigawatt), by Power Generation 2024 & 2032
- Figure 65: South America Power EPC Industry Revenue Share (%), by Power Generation 2024 & 2032
- Figure 66: South America Power EPC Industry Volume Share (%), by Power Generation 2024 & 2032
- Figure 67: South America Power EPC Industry Revenue (Million), by Power Tr 2024 & 2032
- Figure 68: South America Power EPC Industry Volume (Gigawatt), by Power Tr 2024 & 2032
- Figure 69: South America Power EPC Industry Revenue Share (%), by Power Tr 2024 & 2032
- Figure 70: South America Power EPC Industry Volume Share (%), by Power Tr 2024 & 2032
- Figure 71: South America Power EPC Industry Revenue (Million), by Country 2024 & 2032
- Figure 72: South America Power EPC Industry Volume (Gigawatt), by Country 2024 & 2032
- Figure 73: South America Power EPC Industry Revenue Share (%), by Country 2024 & 2032
- Figure 74: South America Power EPC Industry Volume Share (%), by Country 2024 & 2032
- Figure 75: Middle East and Africa Power EPC Industry Revenue (Million), by Power Generation 2024 & 2032
- Figure 76: Middle East and Africa Power EPC Industry Volume (Gigawatt), by Power Generation 2024 & 2032
- Figure 77: Middle East and Africa Power EPC Industry Revenue Share (%), by Power Generation 2024 & 2032
- Figure 78: Middle East and Africa Power EPC Industry Volume Share (%), by Power Generation 2024 & 2032
- Figure 79: Middle East and Africa Power EPC Industry Revenue (Million), by Power Tr 2024 & 2032
- Figure 80: Middle East and Africa Power EPC Industry Volume (Gigawatt), by Power Tr 2024 & 2032
- Figure 81: Middle East and Africa Power EPC Industry Revenue Share (%), by Power Tr 2024 & 2032
- Figure 82: Middle East and Africa Power EPC Industry Volume Share (%), by Power Tr 2024 & 2032
- Figure 83: Middle East and Africa Power EPC Industry Revenue (Million), by Country 2024 & 2032
- Figure 84: Middle East and Africa Power EPC Industry Volume (Gigawatt), by Country 2024 & 2032
- Figure 85: Middle East and Africa Power EPC Industry Revenue Share (%), by Country 2024 & 2032
- Figure 86: Middle East and Africa Power EPC Industry Volume Share (%), by Country 2024 & 2032
List of Tables
- Table 1: Global Power EPC Industry Revenue Million Forecast, by Region 2019 & 2032
- Table 2: Global Power EPC Industry Volume Gigawatt Forecast, by Region 2019 & 2032
- Table 3: Global Power EPC Industry Revenue Million Forecast, by Power Generation 2019 & 2032
- Table 4: Global Power EPC Industry Volume Gigawatt Forecast, by Power Generation 2019 & 2032
- Table 5: Global Power EPC Industry Revenue Million Forecast, by Power Tr 2019 & 2032
- Table 6: Global Power EPC Industry Volume Gigawatt Forecast, by Power Tr 2019 & 2032
- Table 7: Global Power EPC Industry Revenue Million Forecast, by Region 2019 & 2032
- Table 8: Global Power EPC Industry Volume Gigawatt Forecast, by Region 2019 & 2032
- Table 9: Global Power EPC Industry Revenue Million Forecast, by Country 2019 & 2032
- Table 10: Global Power EPC Industry Volume Gigawatt Forecast, by Country 2019 & 2032
- Table 11: United States Power EPC Industry Revenue (Million) Forecast, by Application 2019 & 2032
- Table 12: United States Power EPC Industry Volume (Gigawatt) Forecast, by Application 2019 & 2032
- Table 13: Canada Power EPC Industry Revenue (Million) Forecast, by Application 2019 & 2032
- Table 14: Canada Power EPC Industry Volume (Gigawatt) Forecast, by Application 2019 & 2032
- Table 15: Mexico Power EPC Industry Revenue (Million) Forecast, by Application 2019 & 2032
- Table 16: Mexico Power EPC Industry Volume (Gigawatt) Forecast, by Application 2019 & 2032
- Table 17: Global Power EPC Industry Revenue Million Forecast, by Country 2019 & 2032
- Table 18: Global Power EPC Industry Volume Gigawatt Forecast, by Country 2019 & 2032
- Table 19: Germany Power EPC Industry Revenue (Million) Forecast, by Application 2019 & 2032
- Table 20: Germany Power EPC Industry Volume (Gigawatt) Forecast, by Application 2019 & 2032
- Table 21: United Kingdom Power EPC Industry Revenue (Million) Forecast, by Application 2019 & 2032
- Table 22: United Kingdom Power EPC Industry Volume (Gigawatt) Forecast, by Application 2019 & 2032
- Table 23: France Power EPC Industry Revenue (Million) Forecast, by Application 2019 & 2032
- Table 24: France Power EPC Industry Volume (Gigawatt) Forecast, by Application 2019 & 2032
- Table 25: Spain Power EPC Industry Revenue (Million) Forecast, by Application 2019 & 2032
- Table 26: Spain Power EPC Industry Volume (Gigawatt) Forecast, by Application 2019 & 2032
- Table 27: Italy Power EPC Industry Revenue (Million) Forecast, by Application 2019 & 2032
- Table 28: Italy Power EPC Industry Volume (Gigawatt) Forecast, by Application 2019 & 2032
- Table 29: Spain Power EPC Industry Revenue (Million) Forecast, by Application 2019 & 2032
- Table 30: Spain Power EPC Industry Volume (Gigawatt) Forecast, by Application 2019 & 2032
- Table 31: Belgium Power EPC Industry Revenue (Million) Forecast, by Application 2019 & 2032
- Table 32: Belgium Power EPC Industry Volume (Gigawatt) Forecast, by Application 2019 & 2032
- Table 33: Netherland Power EPC Industry Revenue (Million) Forecast, by Application 2019 & 2032
- Table 34: Netherland Power EPC Industry Volume (Gigawatt) Forecast, by Application 2019 & 2032
- Table 35: Nordics Power EPC Industry Revenue (Million) Forecast, by Application 2019 & 2032
- Table 36: Nordics Power EPC Industry Volume (Gigawatt) Forecast, by Application 2019 & 2032
- Table 37: Rest of Europe Power EPC Industry Revenue (Million) Forecast, by Application 2019 & 2032
- Table 38: Rest of Europe Power EPC Industry Volume (Gigawatt) Forecast, by Application 2019 & 2032
- Table 39: Global Power EPC Industry Revenue Million Forecast, by Country 2019 & 2032
- Table 40: Global Power EPC Industry Volume Gigawatt Forecast, by Country 2019 & 2032
- Table 41: China Power EPC Industry Revenue (Million) Forecast, by Application 2019 & 2032
- Table 42: China Power EPC Industry Volume (Gigawatt) Forecast, by Application 2019 & 2032
- Table 43: Japan Power EPC Industry Revenue (Million) Forecast, by Application 2019 & 2032
- Table 44: Japan Power EPC Industry Volume (Gigawatt) Forecast, by Application 2019 & 2032
- Table 45: India Power EPC Industry Revenue (Million) Forecast, by Application 2019 & 2032
- Table 46: India Power EPC Industry Volume (Gigawatt) Forecast, by Application 2019 & 2032
- Table 47: South Korea Power EPC Industry Revenue (Million) Forecast, by Application 2019 & 2032
- Table 48: South Korea Power EPC Industry Volume (Gigawatt) Forecast, by Application 2019 & 2032
- Table 49: Southeast Asia Power EPC Industry Revenue (Million) Forecast, by Application 2019 & 2032
- Table 50: Southeast Asia Power EPC Industry Volume (Gigawatt) Forecast, by Application 2019 & 2032
- Table 51: Australia Power EPC Industry Revenue (Million) Forecast, by Application 2019 & 2032
- Table 52: Australia Power EPC Industry Volume (Gigawatt) Forecast, by Application 2019 & 2032
- Table 53: Indonesia Power EPC Industry Revenue (Million) Forecast, by Application 2019 & 2032
- Table 54: Indonesia Power EPC Industry Volume (Gigawatt) Forecast, by Application 2019 & 2032
- Table 55: Phillipes Power EPC Industry Revenue (Million) Forecast, by Application 2019 & 2032
- Table 56: Phillipes Power EPC Industry Volume (Gigawatt) Forecast, by Application 2019 & 2032
- Table 57: Singapore Power EPC Industry Revenue (Million) Forecast, by Application 2019 & 2032
- Table 58: Singapore Power EPC Industry Volume (Gigawatt) Forecast, by Application 2019 & 2032
- Table 59: Thailandc Power EPC Industry Revenue (Million) Forecast, by Application 2019 & 2032
- Table 60: Thailandc Power EPC Industry Volume (Gigawatt) Forecast, by Application 2019 & 2032
- Table 61: Rest of Asia Pacific Power EPC Industry Revenue (Million) Forecast, by Application 2019 & 2032
- Table 62: Rest of Asia Pacific Power EPC Industry Volume (Gigawatt) Forecast, by Application 2019 & 2032
- Table 63: Global Power EPC Industry Revenue Million Forecast, by Country 2019 & 2032
- Table 64: Global Power EPC Industry Volume Gigawatt Forecast, by Country 2019 & 2032
- Table 65: Brazil Power EPC Industry Revenue (Million) Forecast, by Application 2019 & 2032
- Table 66: Brazil Power EPC Industry Volume (Gigawatt) Forecast, by Application 2019 & 2032
- Table 67: Argentina Power EPC Industry Revenue (Million) Forecast, by Application 2019 & 2032
- Table 68: Argentina Power EPC Industry Volume (Gigawatt) Forecast, by Application 2019 & 2032
- Table 69: Peru Power EPC Industry Revenue (Million) Forecast, by Application 2019 & 2032
- Table 70: Peru Power EPC Industry Volume (Gigawatt) Forecast, by Application 2019 & 2032
- Table 71: Chile Power EPC Industry Revenue (Million) Forecast, by Application 2019 & 2032
- Table 72: Chile Power EPC Industry Volume (Gigawatt) Forecast, by Application 2019 & 2032
- Table 73: Colombia Power EPC Industry Revenue (Million) Forecast, by Application 2019 & 2032
- Table 74: Colombia Power EPC Industry Volume (Gigawatt) Forecast, by Application 2019 & 2032
- Table 75: Ecuador Power EPC Industry Revenue (Million) Forecast, by Application 2019 & 2032
- Table 76: Ecuador Power EPC Industry Volume (Gigawatt) Forecast, by Application 2019 & 2032
- Table 77: Venezuela Power EPC Industry Revenue (Million) Forecast, by Application 2019 & 2032
- Table 78: Venezuela Power EPC Industry Volume (Gigawatt) Forecast, by Application 2019 & 2032
- Table 79: Rest of South America Power EPC Industry Revenue (Million) Forecast, by Application 2019 & 2032
- Table 80: Rest of South America Power EPC Industry Volume (Gigawatt) Forecast, by Application 2019 & 2032
- Table 81: Global Power EPC Industry Revenue Million Forecast, by Country 2019 & 2032
- Table 82: Global Power EPC Industry Volume Gigawatt Forecast, by Country 2019 & 2032
- Table 83: United States Power EPC Industry Revenue (Million) Forecast, by Application 2019 & 2032
- Table 84: United States Power EPC Industry Volume (Gigawatt) Forecast, by Application 2019 & 2032
- Table 85: Canada Power EPC Industry Revenue (Million) Forecast, by Application 2019 & 2032
- Table 86: Canada Power EPC Industry Volume (Gigawatt) Forecast, by Application 2019 & 2032
- Table 87: Mexico Power EPC Industry Revenue (Million) Forecast, by Application 2019 & 2032
- Table 88: Mexico Power EPC Industry Volume (Gigawatt) Forecast, by Application 2019 & 2032
- Table 89: Global Power EPC Industry Revenue Million Forecast, by Country 2019 & 2032
- Table 90: Global Power EPC Industry Volume Gigawatt Forecast, by Country 2019 & 2032
- Table 91: United Arab Emirates Power EPC Industry Revenue (Million) Forecast, by Application 2019 & 2032
- Table 92: United Arab Emirates Power EPC Industry Volume (Gigawatt) Forecast, by Application 2019 & 2032
- Table 93: Saudi Arabia Power EPC Industry Revenue (Million) Forecast, by Application 2019 & 2032
- Table 94: Saudi Arabia Power EPC Industry Volume (Gigawatt) Forecast, by Application 2019 & 2032
- Table 95: South Africa Power EPC Industry Revenue (Million) Forecast, by Application 2019 & 2032
- Table 96: South Africa Power EPC Industry Volume (Gigawatt) Forecast, by Application 2019 & 2032
- Table 97: Rest of Middle East and Africa Power EPC Industry Revenue (Million) Forecast, by Application 2019 & 2032
- Table 98: Rest of Middle East and Africa Power EPC Industry Volume (Gigawatt) Forecast, by Application 2019 & 2032
- Table 99: Global Power EPC Industry Revenue Million Forecast, by Power Generation 2019 & 2032
- Table 100: Global Power EPC Industry Volume Gigawatt Forecast, by Power Generation 2019 & 2032
- Table 101: Global Power EPC Industry Revenue Million Forecast, by Power Tr 2019 & 2032
- Table 102: Global Power EPC Industry Volume Gigawatt Forecast, by Power Tr 2019 & 2032
- Table 103: Global Power EPC Industry Revenue Million Forecast, by Country 2019 & 2032
- Table 104: Global Power EPC Industry Volume Gigawatt Forecast, by Country 2019 & 2032
- Table 105: United States Power EPC Industry Revenue (Million) Forecast, by Application 2019 & 2032
- Table 106: United States Power EPC Industry Volume (Gigawatt) Forecast, by Application 2019 & 2032
- Table 107: Canada Power EPC Industry Revenue (Million) Forecast, by Application 2019 & 2032
- Table 108: Canada Power EPC Industry Volume (Gigawatt) Forecast, by Application 2019 & 2032
- Table 109: Rest of North America Power EPC Industry Revenue (Million) Forecast, by Application 2019 & 2032
- Table 110: Rest of North America Power EPC Industry Volume (Gigawatt) Forecast, by Application 2019 & 2032
- Table 111: Global Power EPC Industry Revenue Million Forecast, by Power Generation 2019 & 2032
- Table 112: Global Power EPC Industry Volume Gigawatt Forecast, by Power Generation 2019 & 2032
- Table 113: Global Power EPC Industry Revenue Million Forecast, by Power Tr 2019 & 2032
- Table 114: Global Power EPC Industry Volume Gigawatt Forecast, by Power Tr 2019 & 2032
- Table 115: Global Power EPC Industry Revenue Million Forecast, by Country 2019 & 2032
- Table 116: Global Power EPC Industry Volume Gigawatt Forecast, by Country 2019 & 2032
- Table 117: Germany Power EPC Industry Revenue (Million) Forecast, by Application 2019 & 2032
- Table 118: Germany Power EPC Industry Volume (Gigawatt) Forecast, by Application 2019 & 2032
- Table 119: United Kingdom Power EPC Industry Revenue (Million) Forecast, by Application 2019 & 2032
- Table 120: United Kingdom Power EPC Industry Volume (Gigawatt) Forecast, by Application 2019 & 2032
- Table 121: Italy Power EPC Industry Revenue (Million) Forecast, by Application 2019 & 2032
- Table 122: Italy Power EPC Industry Volume (Gigawatt) Forecast, by Application 2019 & 2032
- Table 123: Spain Power EPC Industry Revenue (Million) Forecast, by Application 2019 & 2032
- Table 124: Spain Power EPC Industry Volume (Gigawatt) Forecast, by Application 2019 & 2032
- Table 125: France Power EPC Industry Revenue (Million) Forecast, by Application 2019 & 2032
- Table 126: France Power EPC Industry Volume (Gigawatt) Forecast, by Application 2019 & 2032
- Table 127: Rest of Europe Power EPC Industry Revenue (Million) Forecast, by Application 2019 & 2032
- Table 128: Rest of Europe Power EPC Industry Volume (Gigawatt) Forecast, by Application 2019 & 2032
- Table 129: Global Power EPC Industry Revenue Million Forecast, by Power Generation 2019 & 2032
- Table 130: Global Power EPC Industry Volume Gigawatt Forecast, by Power Generation 2019 & 2032
- Table 131: Global Power EPC Industry Revenue Million Forecast, by Power Tr 2019 & 2032
- Table 132: Global Power EPC Industry Volume Gigawatt Forecast, by Power Tr 2019 & 2032
- Table 133: Global Power EPC Industry Revenue Million Forecast, by Country 2019 & 2032
- Table 134: Global Power EPC Industry Volume Gigawatt Forecast, by Country 2019 & 2032
- Table 135: China Power EPC Industry Revenue (Million) Forecast, by Application 2019 & 2032
- Table 136: China Power EPC Industry Volume (Gigawatt) Forecast, by Application 2019 & 2032
- Table 137: India Power EPC Industry Revenue (Million) Forecast, by Application 2019 & 2032
- Table 138: India Power EPC Industry Volume (Gigawatt) Forecast, by Application 2019 & 2032
- Table 139: Japan Power EPC Industry Revenue (Million) Forecast, by Application 2019 & 2032
- Table 140: Japan Power EPC Industry Volume (Gigawatt) Forecast, by Application 2019 & 2032
- Table 141: Australia Power EPC Industry Revenue (Million) Forecast, by Application 2019 & 2032
- Table 142: Australia Power EPC Industry Volume (Gigawatt) Forecast, by Application 2019 & 2032
- Table 143: South Korea Power EPC Industry Revenue (Million) Forecast, by Application 2019 & 2032
- Table 144: South Korea Power EPC Industry Volume (Gigawatt) Forecast, by Application 2019 & 2032
- Table 145: Rest of Asia Pacific Power EPC Industry Revenue (Million) Forecast, by Application 2019 & 2032
- Table 146: Rest of Asia Pacific Power EPC Industry Volume (Gigawatt) Forecast, by Application 2019 & 2032
- Table 147: Global Power EPC Industry Revenue Million Forecast, by Power Generation 2019 & 2032
- Table 148: Global Power EPC Industry Volume Gigawatt Forecast, by Power Generation 2019 & 2032
- Table 149: Global Power EPC Industry Revenue Million Forecast, by Power Tr 2019 & 2032
- Table 150: Global Power EPC Industry Volume Gigawatt Forecast, by Power Tr 2019 & 2032
- Table 151: Global Power EPC Industry Revenue Million Forecast, by Country 2019 & 2032
- Table 152: Global Power EPC Industry Volume Gigawatt Forecast, by Country 2019 & 2032
- Table 153: Brazil Power EPC Industry Revenue (Million) Forecast, by Application 2019 & 2032
- Table 154: Brazil Power EPC Industry Volume (Gigawatt) Forecast, by Application 2019 & 2032
- Table 155: Argentina Power EPC Industry Revenue (Million) Forecast, by Application 2019 & 2032
- Table 156: Argentina Power EPC Industry Volume (Gigawatt) Forecast, by Application 2019 & 2032
- Table 157: Chile Power EPC Industry Revenue (Million) Forecast, by Application 2019 & 2032
- Table 158: Chile Power EPC Industry Volume (Gigawatt) Forecast, by Application 2019 & 2032
- Table 159: Rest of South America Power EPC Industry Revenue (Million) Forecast, by Application 2019 & 2032
- Table 160: Rest of South America Power EPC Industry Volume (Gigawatt) Forecast, by Application 2019 & 2032
- Table 161: Global Power EPC Industry Revenue Million Forecast, by Power Generation 2019 & 2032
- Table 162: Global Power EPC Industry Volume Gigawatt Forecast, by Power Generation 2019 & 2032
- Table 163: Global Power EPC Industry Revenue Million Forecast, by Power Tr 2019 & 2032
- Table 164: Global Power EPC Industry Volume Gigawatt Forecast, by Power Tr 2019 & 2032
- Table 165: Global Power EPC Industry Revenue Million Forecast, by Country 2019 & 2032
- Table 166: Global Power EPC Industry Volume Gigawatt Forecast, by Country 2019 & 2032
- Table 167: Saudi Arabia Power EPC Industry Revenue (Million) Forecast, by Application 2019 & 2032
- Table 168: Saudi Arabia Power EPC Industry Volume (Gigawatt) Forecast, by Application 2019 & 2032
- Table 169: United Arab Emirates Power EPC Industry Revenue (Million) Forecast, by Application 2019 & 2032
- Table 170: United Arab Emirates Power EPC Industry Volume (Gigawatt) Forecast, by Application 2019 & 2032
- Table 171: South Africa Power EPC Industry Revenue (Million) Forecast, by Application 2019 & 2032
- Table 172: South Africa Power EPC Industry Volume (Gigawatt) Forecast, by Application 2019 & 2032
- Table 173: Nigeria Power EPC Industry Revenue (Million) Forecast, by Application 2019 & 2032
- Table 174: Nigeria Power EPC Industry Volume (Gigawatt) Forecast, by Application 2019 & 2032
- Table 175: Egypt Power EPC Industry Revenue (Million) Forecast, by Application 2019 & 2032
- Table 176: Egypt Power EPC Industry Volume (Gigawatt) Forecast, by Application 2019 & 2032
- Table 177: Rest of Middle East and Africa Power EPC Industry Revenue (Million) Forecast, by Application 2019 & 2032
- Table 178: Rest of Middle East and Africa Power EPC Industry Volume (Gigawatt) Forecast, by Application 2019 & 2032
Frequently Asked Questions
1. What is the projected Compound Annual Growth Rate (CAGR) of the Power EPC Industry?
The projected CAGR is approximately 4.89%.
2. Which companies are prominent players in the Power EPC Industry?
Key companies in the market include 6 Saipem SpA, 7 Larsen & Toubro Limited, 1 Fluor Ltd, Original Equipment Manufacturers (OEMs), 5 Eaton Corporation PLC *List Not Exhaustive, 4 McDermott International Inc, 2 Siemens Energy AG, 2 John Wood PLC, EPC Developers, 3 ABB Ltd, 1 General Electric Company, 5 Bechtel Corporation, 8 KBR Inc, 4 Schneider Electric SE, 3 Kiewit Corporation.
3. What are the main segments of the Power EPC Industry?
The market segments include Power Generation, Power Tr.
4. Can you provide details about the market size?
The market size is estimated to be USD 730.03 Million as of 2022.
5. What are some drivers contributing to market growth?
4.; Growing Energy Demand4.; Renewable Energy Transition.
6. What are the notable trends driving market growth?
Renewable Expected to be the Fastest-growing Market Segment.
7. Are there any restraints impacting market growth?
4.; Phasing out of Conventional Sources of Electricity.
8. Can you provide examples of recent developments in the market?
October 2023: NTPC Green Energy Ltd (NGEL), on behalf of North Eastern Electric Power Corp. Ltd (NEEPCO), has tendered the EPC package with land for the development of 300 MW of solar projects. The scope of work includes arrangement of land for the solar project and connectivity to the substation, design, engineering, manufacturing, supply, installation, commissioning, and operation and maintenance of the grid-connected solar PV projects.
9. What pricing options are available for accessing the report?
Pricing options include single-user, multi-user, and enterprise licenses priced at USD 4750, USD 5250, and USD 8750 respectively.
10. Is the market size provided in terms of value or volume?
The market size is provided in terms of value, measured in Million and volume, measured in Gigawatt.
11. Are there any specific market keywords associated with the report?
Yes, the market keyword associated with the report is "Power EPC Industry," which aids in identifying and referencing the specific market segment covered.
12. How do I determine which pricing option suits my needs best?
The pricing options vary based on user requirements and access needs. Individual users may opt for single-user licenses, while businesses requiring broader access may choose multi-user or enterprise licenses for cost-effective access to the report.
13. Are there any additional resources or data provided in the Power EPC Industry report?
While the report offers comprehensive insights, it's advisable to review the specific contents or supplementary materials provided to ascertain if additional resources or data are available.
14. How can I stay updated on further developments or reports in the Power EPC Industry?
To stay informed about further developments, trends, and reports in the Power EPC Industry, consider subscribing to industry newsletters, following relevant companies and organizations, or regularly checking reputable industry news sources and publications.
Methodology
Step 1 - Identification of Relevant Samples Size from Population Database


Step 2 - Approaches for Defining Global Market Size (Value, Volume* & Price*)

Note*: In applicable scenarios
Step 3 - Data Sources
Primary Research
- Web Analytics
- Survey Reports
- Research Institute
- Latest Research Reports
- Opinion Leaders
Secondary Research
- Annual Reports
- White Paper
- Latest Press Release
- Industry Association
- Paid Database
- Investor Presentations

Step 4 - Data Triangulation
Involves using different sources of information in order to increase the validity of a study
These sources are likely to be stakeholders in a program - participants, other researchers, program staff, other community members, and so on.
Then we put all data in single framework & apply various statistical tools to find out the dynamic on the market.
During the analysis stage, feedback from the stakeholder groups would be compared to determine areas of agreement as well as areas of divergence


