
Key Insights
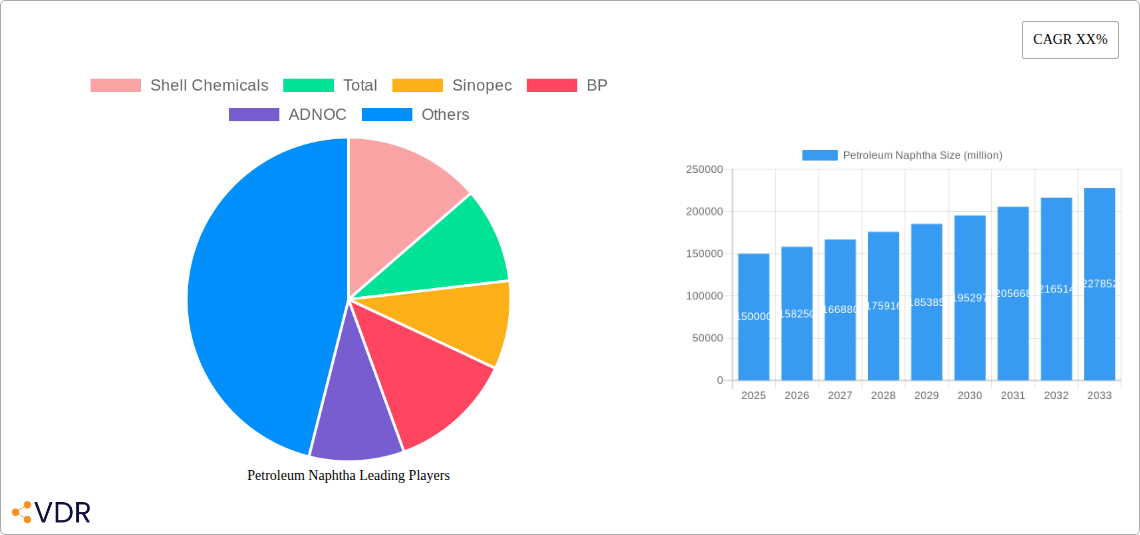
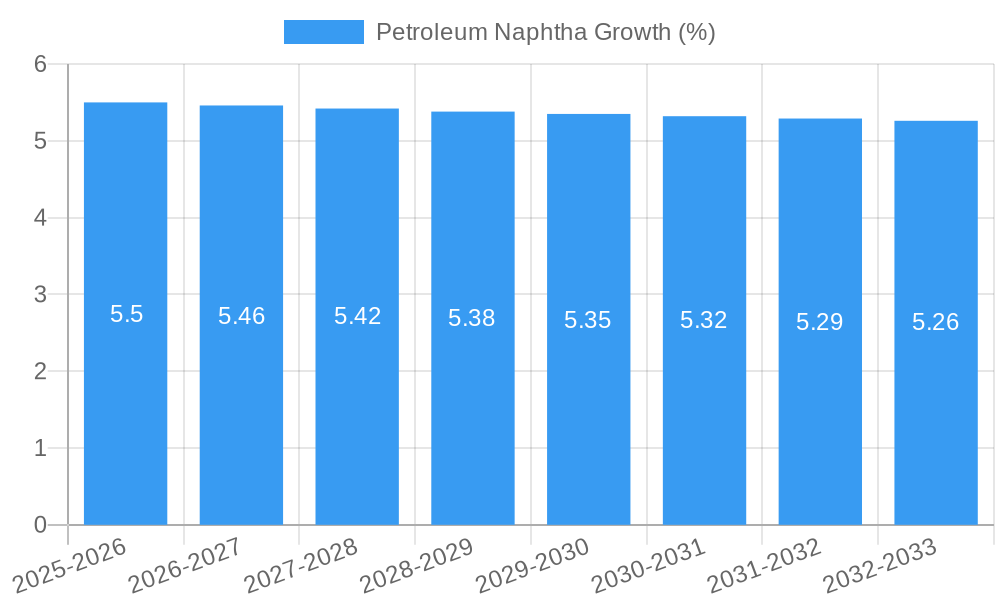
The global Petroleum Naphtha market is poised for substantial growth, projected to reach an estimated market size of $150 billion in 2025 and expand to approximately $220 billion by 2033. This robust expansion is underpinned by a compound annual growth rate (CAGR) of roughly 5.5% over the forecast period. The primary driver for this impressive trajectory is the escalating demand from the chemicals sector, which utilizes naphtha as a crucial feedstock for the production of olefins and other petrochemicals essential for a wide array of consumer and industrial goods. Furthermore, the energy and additives segment also contributes significantly to naphtha consumption, particularly in the formulation of gasoline and as a solvent. The increasing global population and rising disposable incomes in emerging economies are fueling the demand for downstream products, thereby creating a sustained pull for naphtha.
Despite the strong growth prospects, the Petroleum Naphtha market faces certain restraints, including fluctuating crude oil prices, which directly impact naphtha production costs and availability. Volatility in feedstock prices can lead to price instability for naphtha, potentially affecting its competitiveness against alternative feedstocks in certain applications. Additionally, stringent environmental regulations regarding emissions and the push towards renewable energy sources could pose long-term challenges. However, ongoing technological advancements in naphtha processing and the development of more efficient production methods are expected to mitigate some of these concerns. The market is characterized by a diverse range of players, from major integrated oil and gas companies like Shell Chemicals, Total, and Sinopec to specialized refining and petrochemical firms, all competing to secure market share through strategic investments and product innovation.
Petroleum Naphtha Market Dynamics & Structure
The global petroleum naphtha market exhibits a moderately concentrated structure, with major integrated oil and gas companies and petrochemical giants like Shell Chemicals, Total, Sinopec, BP, ADNOC, ARAMCO, PEMEX, Mangalore Refinery and Petrochemicals, Kuwait Petroleum Corporation, Hindustan Petroleum Corporation, and ONGC holding significant market shares. Technological innovation, particularly in refining processes and the development of high-value downstream products, serves as a key driver, while evolving regulatory frameworks concerning environmental impact and emissions dictate operational parameters. Competitive product substitutes, such as natural gas liquids and bio-based alternatives, exert pressure, necessitating continuous optimization of naphtha's cost-effectiveness and performance. End-user demographics are increasingly influenced by the petrochemical industry's demand for feedstocks and the energy sector's need for additives and solvents. Merger and acquisition (M&A) trends are observed as companies seek to consolidate their market positions, secure feedstock access, and expand their downstream integration. For instance, a hypothetical M&A deal in the historical period (2019-2024) might involve a refinery acquiring a specialty chemical producer to enhance its naphtha derivatives portfolio, potentially valued in the range of $50 million to $500 million, indicating strategic consolidation. Innovation barriers include the high capital expenditure required for advanced refining technologies and stringent safety and environmental compliance protocols.
- Market Concentration: Dominated by a few large, integrated players.
- Technological Innovation: Drives efficiency improvements and new product development.
- Regulatory Frameworks: Influence environmental standards and operational compliance.
- Competitive Substitutes: NGLs and bio-based alternatives offer alternatives.
- End-User Demographics: Primarily petrochemical and energy sectors.
- M&A Trends: Focus on consolidation and vertical integration.
Petroleum Naphtha Growth Trends & Insights
The global petroleum naphtha market is poised for steady growth, driven by escalating demand from the burgeoning petrochemical industry, a primary consumer of naphtha as a feedstock for olefins production. The market size is projected to evolve from approximately $60 billion in the historical period (2019-2024) to an estimated $75 billion by 2025, with a Compound Annual Growth Rate (CAGR) of around 3.5% anticipated for the forecast period (2025-2033). Adoption rates for naphtha in traditional applications like gasoline blending and as an industrial solvent are mature, but its utilization in the production of ethylene and propylene for plastics, synthetic fibers, and other chemicals is witnessing significant expansion. Technological disruptions, such as advancements in steam cracking technologies that enhance naphtha conversion efficiency and the development of selective catalytic reforming processes for higher yields of aromatics, are crucial. Furthermore, the growing emphasis on circular economy principles and advanced recycling technologies for plastics could indirectly influence naphtha demand by affecting the supply of virgin polymers.
Consumer behavior shifts, particularly in developed economies, towards more sustainable products are prompting chemical manufacturers to explore bio-based naphtha alternatives or to optimize their existing naphtha-based production processes for reduced environmental footprints. In emerging economies, rapid industrialization and increasing disposable incomes are fueling demand for consumer goods derived from petrochemicals, thereby underpinning naphtha consumption. The market penetration of naphtha in key applications remains high, particularly in regions with established refining infrastructure and strong downstream petrochemical industries. For example, light naphtha's high paraffin content makes it a preferred feedstock for steam crackers producing ethylene, while heavy naphtha, rich in naphthenes and aromatics, is crucial for catalytic reforming to produce gasoline blending components and aromatic feedstocks like benzene, toluene, and xylene. The dynamic interplay of these factors suggests a resilient growth trajectory for the petroleum naphtha market.
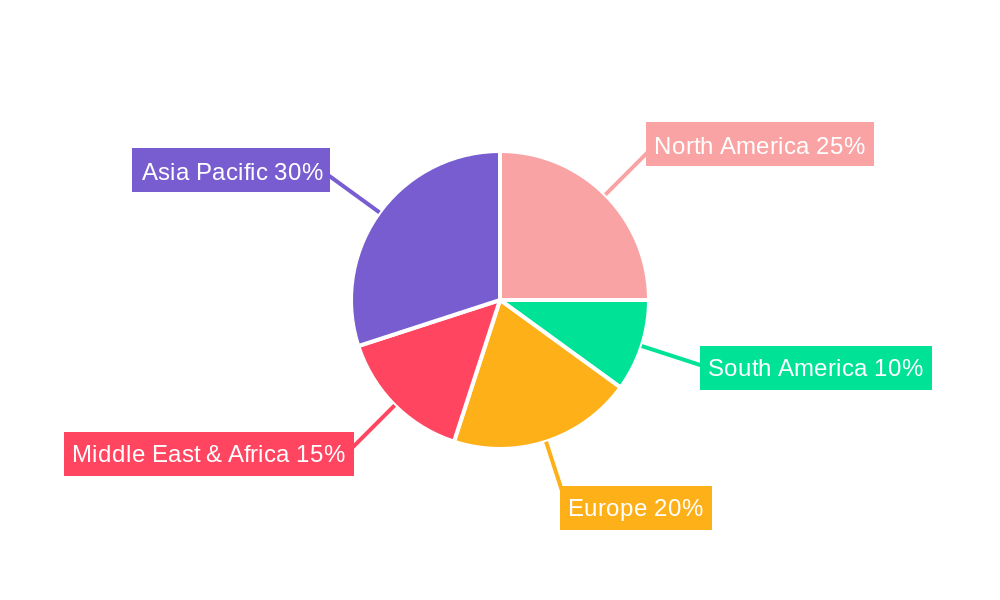
Dominant Regions, Countries, or Segments in Petroleum Naphtha
The Asia Pacific region stands out as the dominant force in the global petroleum naphtha market, driven by its robust industrialization, burgeoning middle class, and significant investments in refining and petrochemical infrastructure. Countries like China and India are leading this surge, fueled by rapid economic growth and a burgeoning demand for plastics, synthetic fibers, and other downstream petrochemical products. The application segment of Chemicals is unequivocally the primary driver of naphtha consumption, accounting for an estimated 70% of the global market share by volume. This dominance is attributed to naphtha's crucial role as a primary feedstock for steam crackers in the production of olefins (ethylene and propylene), which are the building blocks for a vast array of plastics, polymers, and other essential chemicals.
- Asia Pacific Dominance: Characterized by strong industrial growth and petrochemical expansion.
- Key Countries: China and India lead demand due to rapid economic development.
- Application Dominance: Chemicals: Naphtha's role as a feedstock for olefins is paramount.
- Market Share (Chemicals Application): Estimated at 70% of the global naphtha market.
- Growth Potential (Chemicals): Driven by increasing demand for plastics and polymers.
- Types Dominance: Light Naphtha: Preferred feedstock for ethylene production due to its high paraffin content.
- Heavy Naphtha Significance: Crucial for catalytic reforming to produce aromatics and gasoline components.
- Economic Policies: Government incentives and industrial policies in APAC favor petrochemical expansion.
- Infrastructure Development: Extensive refinery and petrochemical complex investments in the region support naphtha consumption.
- End-User Demand: Rising consumerism and industrial output in APAC create sustained demand for naphtha-derived products.
The Light Naphtha type is particularly significant within the chemical application segment, being the preferred feedstock for steam crackers due to its higher yield of valuable olefins like ethylene. Conversely, Heavy Naphtha plays a critical role in the energy and additives segment, primarily through catalytic reforming processes that produce high-octane gasoline blending components and aromatic feedstocks such as benzene, toluene, and xylene (BTX), which are vital for a range of chemical manufacturing. The dominance of the Chemicals segment and the prominence of Light Naphtha are intrinsically linked to the expanding global demand for polymers and plastics used in packaging, automotive, construction, and textiles. Economic policies in Asia Pacific, often characterized by supportive industrial development initiatives and strategic investments in infrastructure, further cement the region's leadership.
Petroleum Naphtha Product Landscape
The petroleum naphtha product landscape is characterized by its essential role as a versatile feedstock and solvent. Light Naphtha, with its lower boiling range and higher paraffin content, is predominantly utilized as a feedstock for steam crackers in the petrochemical industry, producing ethylene and other olefins for plastics and synthetic materials. Heavy Naphtha, possessing a higher boiling range and richer in naphthenes and aromatics, is primarily used in catalytic reforming to produce high-octane gasoline blending components and aromatic compounds like benzene, toluene, and xylene (BTX), critical for numerous chemical syntheses. Innovations focus on enhancing the efficiency of naphtha cracking and reforming processes, optimizing product yields, and developing cleaner formulations for solvent applications.
Key Drivers, Barriers & Challenges in Petroleum Naphtha
Key Drivers:
- Robust Petrochemical Demand: Surging global demand for plastics, polymers, and synthetic fibers directly fuels naphtha consumption as a primary feedstock.
- Economic Growth in Emerging Markets: Rapid industrialization and rising consumerism in regions like Asia Pacific boost the demand for naphtha-derived products.
- Gasoline Blending Requirements: Naphtha remains a crucial component for enhancing the octane rating of gasoline.
- Technological Advancements in Refining: Improved cracking and reforming technologies increase naphtha conversion efficiency and product yields.
Barriers & Challenges:
- Environmental Regulations and Emissions Standards: Increasing scrutiny on emissions from refining processes and end-use applications necessitates investment in cleaner technologies.
- Volatility of Crude Oil Prices: Fluctuations in crude oil prices directly impact naphtha production costs and market competitiveness.
- Competition from Natural Gas Liquids (NGLs): NGLs, particularly ethane and propane, are becoming increasingly competitive feedstocks for ethylene production in certain regions.
- Supply Chain Disruptions: Geopolitical events, logistical bottlenecks, and refinery operational issues can impact naphtha availability and pricing.
- Shift towards Bio-based Alternatives: Growing interest and investment in renewable feedstocks for chemical production pose a long-term challenge.
- Market Saturation in Mature Economies: Demand growth in developed regions is often slower compared to emerging economies.
- Capital Intensity of Refining: Significant investment is required for maintaining and upgrading refining infrastructure to meet evolving standards.
Emerging Opportunities in Petroleum Naphtha
Emerging opportunities in the petroleum naphtha market lie in the development of specialized naphtha grades for niche chemical synthesis and the increasing demand for high-purity naphtha for advanced applications. The growing focus on sustainability is also creating opportunities for optimizing existing naphtha-based processes to reduce their environmental footprint and for exploring novel pathways for naphtha conversion into higher-value products. Untapped markets in regions with developing petrochemical industries present significant growth potential, especially as these economies industrialize further. Furthermore, the integration of naphtha production with emerging technologies like carbon capture and utilization (CCU) could offer innovative solutions for mitigating emissions.
Growth Accelerators in the Petroleum Naphtha Industry
Long-term growth in the petroleum naphtha industry will be accelerated by continued investment in advanced refining technologies that enhance efficiency and yield, particularly in steam cracking and catalytic reforming. Strategic partnerships between upstream oil producers and downstream petrochemical manufacturers will be crucial for securing feedstock supply and optimizing value chains. Market expansion strategies, focusing on catering to the burgeoning demand in developing economies, will also play a pivotal role. Furthermore, the ongoing research and development into novel applications for naphtha derivatives and the potential for its utilization in emerging energy technologies, such as hydrogen production via steam reforming, will act as significant growth catalysts.
Key Players Shaping the Petroleum Naphtha Market
- Shell Chemicals
- Total
- Sinopec
- BP
- ADNOC
- ARAMCO
- PEMEX
- Mangalore Refinery and Petrochemicals
- Kuwait Petroleum Corporation
- Hindustan Petroleum Corporation
- ONGC
Notable Milestones in Petroleum Naphtha Sector
- 2019: Increased investment in naphtha cracking capacity in Asia to meet growing demand for polyethylene and polypropylene.
- 2020: Introduction of advanced catalytic reforming catalysts improving aromatic yields and gasoline octane.
- 2021: Significant rise in NGLs utilization impacting naphtha demand in select ethylene production facilities.
- 2022: Enhanced focus on energy efficiency in refining operations leading to process optimization for naphtha production.
- 2023: Several major petrochemical companies announce expansion projects leveraging naphtha as a key feedstock.
- 2024: Growing discussions around the role of naphtha in a circular economy, exploring its potential in advanced recycling processes.
In-Depth Petroleum Naphtha Market Outlook
The petroleum naphtha market is set for sustained growth, underpinned by the persistent global demand from the petrochemical sector and its indispensable role in gasoline production. Future market potential will be significantly shaped by the ongoing expansion of petrochemical complexes, particularly in Asia, and the continuous drive for technological innovation in refining to enhance efficiency and product diversification. Strategic opportunities will emerge for companies that can navigate evolving environmental regulations, adapt to the competitive landscape with alternative feedstocks, and capitalize on the growing demand in emerging economies. The industry's ability to integrate sustainable practices and explore novel applications will be critical for long-term prosperity.
Petroleum Naphtha Segmentation
-
1. Application
- 1.1. Chemicals
- 1.2. Energy & Additives
-
2. Types
- 2.1. Heavy Naphtha
- 2.2. Light Naphtha
Petroleum Naphtha Segmentation By Geography
-
1. North America
- 1.1. United States
- 1.2. Canada
- 1.3. Mexico
-
2. South America
- 2.1. Brazil
- 2.2. Argentina
- 2.3. Rest of South America
-
3. Europe
- 3.1. United Kingdom
- 3.2. Germany
- 3.3. France
- 3.4. Italy
- 3.5. Spain
- 3.6. Russia
- 3.7. Benelux
- 3.8. Nordics
- 3.9. Rest of Europe
-
4. Middle East & Africa
- 4.1. Turkey
- 4.2. Israel
- 4.3. GCC
- 4.4. North Africa
- 4.5. South Africa
- 4.6. Rest of Middle East & Africa
-
5. Asia Pacific
- 5.1. China
- 5.2. India
- 5.3. Japan
- 5.4. South Korea
- 5.5. ASEAN
- 5.6. Oceania
- 5.7. Rest of Asia Pacific
Petroleum Naphtha REPORT HIGHLIGHTS
| Aspects | Details |
|---|---|
| Study Period | 2019-2033 |
| Base Year | 2024 |
| Estimated Year | 2025 |
| Forecast Period | 2025-2033 |
| Historical Period | 2019-2024 |
| Growth Rate | CAGR of XX% from 2019-2033 |
| Segmentation |
|
Table of Contents
- 1. Introduction
- 1.1. Research Scope
- 1.2. Market Segmentation
- 1.3. Research Methodology
- 1.4. Definitions and Assumptions
- 2. Executive Summary
- 2.1. Introduction
- 3. Market Dynamics
- 3.1. Introduction
- 3.2. Market Drivers
- 3.3. Market Restrains
- 3.4. Market Trends
- 4. Market Factor Analysis
- 4.1. Porters Five Forces
- 4.2. Supply/Value Chain
- 4.3. PESTEL analysis
- 4.4. Market Entropy
- 4.5. Patent/Trademark Analysis
- 5. Global Petroleum Naphtha Analysis, Insights and Forecast, 2019-2031
- 5.1. Market Analysis, Insights and Forecast - by Application
- 5.1.1. Chemicals
- 5.1.2. Energy & Additives
- 5.2. Market Analysis, Insights and Forecast - by Types
- 5.2.1. Heavy Naphtha
- 5.2.2. Light Naphtha
- 5.3. Market Analysis, Insights and Forecast - by Region
- 5.3.1. North America
- 5.3.2. South America
- 5.3.3. Europe
- 5.3.4. Middle East & Africa
- 5.3.5. Asia Pacific
- 5.1. Market Analysis, Insights and Forecast - by Application
- 6. North America Petroleum Naphtha Analysis, Insights and Forecast, 2019-2031
- 6.1. Market Analysis, Insights and Forecast - by Application
- 6.1.1. Chemicals
- 6.1.2. Energy & Additives
- 6.2. Market Analysis, Insights and Forecast - by Types
- 6.2.1. Heavy Naphtha
- 6.2.2. Light Naphtha
- 6.1. Market Analysis, Insights and Forecast - by Application
- 7. South America Petroleum Naphtha Analysis, Insights and Forecast, 2019-2031
- 7.1. Market Analysis, Insights and Forecast - by Application
- 7.1.1. Chemicals
- 7.1.2. Energy & Additives
- 7.2. Market Analysis, Insights and Forecast - by Types
- 7.2.1. Heavy Naphtha
- 7.2.2. Light Naphtha
- 7.1. Market Analysis, Insights and Forecast - by Application
- 8. Europe Petroleum Naphtha Analysis, Insights and Forecast, 2019-2031
- 8.1. Market Analysis, Insights and Forecast - by Application
- 8.1.1. Chemicals
- 8.1.2. Energy & Additives
- 8.2. Market Analysis, Insights and Forecast - by Types
- 8.2.1. Heavy Naphtha
- 8.2.2. Light Naphtha
- 8.1. Market Analysis, Insights and Forecast - by Application
- 9. Middle East & Africa Petroleum Naphtha Analysis, Insights and Forecast, 2019-2031
- 9.1. Market Analysis, Insights and Forecast - by Application
- 9.1.1. Chemicals
- 9.1.2. Energy & Additives
- 9.2. Market Analysis, Insights and Forecast - by Types
- 9.2.1. Heavy Naphtha
- 9.2.2. Light Naphtha
- 9.1. Market Analysis, Insights and Forecast - by Application
- 10. Asia Pacific Petroleum Naphtha Analysis, Insights and Forecast, 2019-2031
- 10.1. Market Analysis, Insights and Forecast - by Application
- 10.1.1. Chemicals
- 10.1.2. Energy & Additives
- 10.2. Market Analysis, Insights and Forecast - by Types
- 10.2.1. Heavy Naphtha
- 10.2.2. Light Naphtha
- 10.1. Market Analysis, Insights and Forecast - by Application
- 11. Competitive Analysis
- 11.1. Global Market Share Analysis 2024
- 11.2. Company Profiles
- 11.2.1 Shell Chemicals
- 11.2.1.1. Overview
- 11.2.1.2. Products
- 11.2.1.3. SWOT Analysis
- 11.2.1.4. Recent Developments
- 11.2.1.5. Financials (Based on Availability)
- 11.2.2 Total
- 11.2.2.1. Overview
- 11.2.2.2. Products
- 11.2.2.3. SWOT Analysis
- 11.2.2.4. Recent Developments
- 11.2.2.5. Financials (Based on Availability)
- 11.2.3 Sinopec
- 11.2.3.1. Overview
- 11.2.3.2. Products
- 11.2.3.3. SWOT Analysis
- 11.2.3.4. Recent Developments
- 11.2.3.5. Financials (Based on Availability)
- 11.2.4 BP
- 11.2.4.1. Overview
- 11.2.4.2. Products
- 11.2.4.3. SWOT Analysis
- 11.2.4.4. Recent Developments
- 11.2.4.5. Financials (Based on Availability)
- 11.2.5 ADNOC
- 11.2.5.1. Overview
- 11.2.5.2. Products
- 11.2.5.3. SWOT Analysis
- 11.2.5.4. Recent Developments
- 11.2.5.5. Financials (Based on Availability)
- 11.2.6 ARAMCO
- 11.2.6.1. Overview
- 11.2.6.2. Products
- 11.2.6.3. SWOT Analysis
- 11.2.6.4. Recent Developments
- 11.2.6.5. Financials (Based on Availability)
- 11.2.7 PEMEX
- 11.2.7.1. Overview
- 11.2.7.2. Products
- 11.2.7.3. SWOT Analysis
- 11.2.7.4. Recent Developments
- 11.2.7.5. Financials (Based on Availability)
- 11.2.8 Mangalore Refinery and Petrochemicals
- 11.2.8.1. Overview
- 11.2.8.2. Products
- 11.2.8.3. SWOT Analysis
- 11.2.8.4. Recent Developments
- 11.2.8.5. Financials (Based on Availability)
- 11.2.9 Kuwait Petroleum Corporation
- 11.2.9.1. Overview
- 11.2.9.2. Products
- 11.2.9.3. SWOT Analysis
- 11.2.9.4. Recent Developments
- 11.2.9.5. Financials (Based on Availability)
- 11.2.10 Hindustan Petroleum Corporation
- 11.2.10.1. Overview
- 11.2.10.2. Products
- 11.2.10.3. SWOT Analysis
- 11.2.10.4. Recent Developments
- 11.2.10.5. Financials (Based on Availability)
- 11.2.11 ONGC
- 11.2.11.1. Overview
- 11.2.11.2. Products
- 11.2.11.3. SWOT Analysis
- 11.2.11.4. Recent Developments
- 11.2.11.5. Financials (Based on Availability)
- 11.2.1 Shell Chemicals
List of Figures
- Figure 1: Global Petroleum Naphtha Revenue Breakdown (million, %) by Region 2024 & 2032
- Figure 2: North America Petroleum Naphtha Revenue (million), by Application 2024 & 2032
- Figure 3: North America Petroleum Naphtha Revenue Share (%), by Application 2024 & 2032
- Figure 4: North America Petroleum Naphtha Revenue (million), by Types 2024 & 2032
- Figure 5: North America Petroleum Naphtha Revenue Share (%), by Types 2024 & 2032
- Figure 6: North America Petroleum Naphtha Revenue (million), by Country 2024 & 2032
- Figure 7: North America Petroleum Naphtha Revenue Share (%), by Country 2024 & 2032
- Figure 8: South America Petroleum Naphtha Revenue (million), by Application 2024 & 2032
- Figure 9: South America Petroleum Naphtha Revenue Share (%), by Application 2024 & 2032
- Figure 10: South America Petroleum Naphtha Revenue (million), by Types 2024 & 2032
- Figure 11: South America Petroleum Naphtha Revenue Share (%), by Types 2024 & 2032
- Figure 12: South America Petroleum Naphtha Revenue (million), by Country 2024 & 2032
- Figure 13: South America Petroleum Naphtha Revenue Share (%), by Country 2024 & 2032
- Figure 14: Europe Petroleum Naphtha Revenue (million), by Application 2024 & 2032
- Figure 15: Europe Petroleum Naphtha Revenue Share (%), by Application 2024 & 2032
- Figure 16: Europe Petroleum Naphtha Revenue (million), by Types 2024 & 2032
- Figure 17: Europe Petroleum Naphtha Revenue Share (%), by Types 2024 & 2032
- Figure 18: Europe Petroleum Naphtha Revenue (million), by Country 2024 & 2032
- Figure 19: Europe Petroleum Naphtha Revenue Share (%), by Country 2024 & 2032
- Figure 20: Middle East & Africa Petroleum Naphtha Revenue (million), by Application 2024 & 2032
- Figure 21: Middle East & Africa Petroleum Naphtha Revenue Share (%), by Application 2024 & 2032
- Figure 22: Middle East & Africa Petroleum Naphtha Revenue (million), by Types 2024 & 2032
- Figure 23: Middle East & Africa Petroleum Naphtha Revenue Share (%), by Types 2024 & 2032
- Figure 24: Middle East & Africa Petroleum Naphtha Revenue (million), by Country 2024 & 2032
- Figure 25: Middle East & Africa Petroleum Naphtha Revenue Share (%), by Country 2024 & 2032
- Figure 26: Asia Pacific Petroleum Naphtha Revenue (million), by Application 2024 & 2032
- Figure 27: Asia Pacific Petroleum Naphtha Revenue Share (%), by Application 2024 & 2032
- Figure 28: Asia Pacific Petroleum Naphtha Revenue (million), by Types 2024 & 2032
- Figure 29: Asia Pacific Petroleum Naphtha Revenue Share (%), by Types 2024 & 2032
- Figure 30: Asia Pacific Petroleum Naphtha Revenue (million), by Country 2024 & 2032
- Figure 31: Asia Pacific Petroleum Naphtha Revenue Share (%), by Country 2024 & 2032
List of Tables
- Table 1: Global Petroleum Naphtha Revenue million Forecast, by Region 2019 & 2032
- Table 2: Global Petroleum Naphtha Revenue million Forecast, by Application 2019 & 2032
- Table 3: Global Petroleum Naphtha Revenue million Forecast, by Types 2019 & 2032
- Table 4: Global Petroleum Naphtha Revenue million Forecast, by Region 2019 & 2032
- Table 5: Global Petroleum Naphtha Revenue million Forecast, by Application 2019 & 2032
- Table 6: Global Petroleum Naphtha Revenue million Forecast, by Types 2019 & 2032
- Table 7: Global Petroleum Naphtha Revenue million Forecast, by Country 2019 & 2032
- Table 8: United States Petroleum Naphtha Revenue (million) Forecast, by Application 2019 & 2032
- Table 9: Canada Petroleum Naphtha Revenue (million) Forecast, by Application 2019 & 2032
- Table 10: Mexico Petroleum Naphtha Revenue (million) Forecast, by Application 2019 & 2032
- Table 11: Global Petroleum Naphtha Revenue million Forecast, by Application 2019 & 2032
- Table 12: Global Petroleum Naphtha Revenue million Forecast, by Types 2019 & 2032
- Table 13: Global Petroleum Naphtha Revenue million Forecast, by Country 2019 & 2032
- Table 14: Brazil Petroleum Naphtha Revenue (million) Forecast, by Application 2019 & 2032
- Table 15: Argentina Petroleum Naphtha Revenue (million) Forecast, by Application 2019 & 2032
- Table 16: Rest of South America Petroleum Naphtha Revenue (million) Forecast, by Application 2019 & 2032
- Table 17: Global Petroleum Naphtha Revenue million Forecast, by Application 2019 & 2032
- Table 18: Global Petroleum Naphtha Revenue million Forecast, by Types 2019 & 2032
- Table 19: Global Petroleum Naphtha Revenue million Forecast, by Country 2019 & 2032
- Table 20: United Kingdom Petroleum Naphtha Revenue (million) Forecast, by Application 2019 & 2032
- Table 21: Germany Petroleum Naphtha Revenue (million) Forecast, by Application 2019 & 2032
- Table 22: France Petroleum Naphtha Revenue (million) Forecast, by Application 2019 & 2032
- Table 23: Italy Petroleum Naphtha Revenue (million) Forecast, by Application 2019 & 2032
- Table 24: Spain Petroleum Naphtha Revenue (million) Forecast, by Application 2019 & 2032
- Table 25: Russia Petroleum Naphtha Revenue (million) Forecast, by Application 2019 & 2032
- Table 26: Benelux Petroleum Naphtha Revenue (million) Forecast, by Application 2019 & 2032
- Table 27: Nordics Petroleum Naphtha Revenue (million) Forecast, by Application 2019 & 2032
- Table 28: Rest of Europe Petroleum Naphtha Revenue (million) Forecast, by Application 2019 & 2032
- Table 29: Global Petroleum Naphtha Revenue million Forecast, by Application 2019 & 2032
- Table 30: Global Petroleum Naphtha Revenue million Forecast, by Types 2019 & 2032
- Table 31: Global Petroleum Naphtha Revenue million Forecast, by Country 2019 & 2032
- Table 32: Turkey Petroleum Naphtha Revenue (million) Forecast, by Application 2019 & 2032
- Table 33: Israel Petroleum Naphtha Revenue (million) Forecast, by Application 2019 & 2032
- Table 34: GCC Petroleum Naphtha Revenue (million) Forecast, by Application 2019 & 2032
- Table 35: North Africa Petroleum Naphtha Revenue (million) Forecast, by Application 2019 & 2032
- Table 36: South Africa Petroleum Naphtha Revenue (million) Forecast, by Application 2019 & 2032
- Table 37: Rest of Middle East & Africa Petroleum Naphtha Revenue (million) Forecast, by Application 2019 & 2032
- Table 38: Global Petroleum Naphtha Revenue million Forecast, by Application 2019 & 2032
- Table 39: Global Petroleum Naphtha Revenue million Forecast, by Types 2019 & 2032
- Table 40: Global Petroleum Naphtha Revenue million Forecast, by Country 2019 & 2032
- Table 41: China Petroleum Naphtha Revenue (million) Forecast, by Application 2019 & 2032
- Table 42: India Petroleum Naphtha Revenue (million) Forecast, by Application 2019 & 2032
- Table 43: Japan Petroleum Naphtha Revenue (million) Forecast, by Application 2019 & 2032
- Table 44: South Korea Petroleum Naphtha Revenue (million) Forecast, by Application 2019 & 2032
- Table 45: ASEAN Petroleum Naphtha Revenue (million) Forecast, by Application 2019 & 2032
- Table 46: Oceania Petroleum Naphtha Revenue (million) Forecast, by Application 2019 & 2032
- Table 47: Rest of Asia Pacific Petroleum Naphtha Revenue (million) Forecast, by Application 2019 & 2032
Frequently Asked Questions
1. What is the projected Compound Annual Growth Rate (CAGR) of the Petroleum Naphtha?
The projected CAGR is approximately XX%.
2. Which companies are prominent players in the Petroleum Naphtha?
Key companies in the market include Shell Chemicals, Total, Sinopec, BP, ADNOC, ARAMCO, PEMEX, Mangalore Refinery and Petrochemicals, Kuwait Petroleum Corporation, Hindustan Petroleum Corporation, ONGC.
3. What are the main segments of the Petroleum Naphtha?
The market segments include Application, Types.
4. Can you provide details about the market size?
The market size is estimated to be USD XXX million as of 2022.
5. What are some drivers contributing to market growth?
N/A
6. What are the notable trends driving market growth?
N/A
7. Are there any restraints impacting market growth?
N/A
8. Can you provide examples of recent developments in the market?
N/A
9. What pricing options are available for accessing the report?
Pricing options include single-user, multi-user, and enterprise licenses priced at USD 4900.00, USD 7350.00, and USD 9800.00 respectively.
10. Is the market size provided in terms of value or volume?
The market size is provided in terms of value, measured in million.
11. Are there any specific market keywords associated with the report?
Yes, the market keyword associated with the report is "Petroleum Naphtha," which aids in identifying and referencing the specific market segment covered.
12. How do I determine which pricing option suits my needs best?
The pricing options vary based on user requirements and access needs. Individual users may opt for single-user licenses, while businesses requiring broader access may choose multi-user or enterprise licenses for cost-effective access to the report.
13. Are there any additional resources or data provided in the Petroleum Naphtha report?
While the report offers comprehensive insights, it's advisable to review the specific contents or supplementary materials provided to ascertain if additional resources or data are available.
14. How can I stay updated on further developments or reports in the Petroleum Naphtha?
To stay informed about further developments, trends, and reports in the Petroleum Naphtha, consider subscribing to industry newsletters, following relevant companies and organizations, or regularly checking reputable industry news sources and publications.
Methodology
Step 1 - Identification of Relevant Samples Size from Population Database


Step 2 - Approaches for Defining Global Market Size (Value, Volume* & Price*)

Note*: In applicable scenarios
Step 3 - Data Sources
Primary Research
- Web Analytics
- Survey Reports
- Research Institute
- Latest Research Reports
- Opinion Leaders
Secondary Research
- Annual Reports
- White Paper
- Latest Press Release
- Industry Association
- Paid Database
- Investor Presentations

Step 4 - Data Triangulation
Involves using different sources of information in order to increase the validity of a study
These sources are likely to be stakeholders in a program - participants, other researchers, program staff, other community members, and so on.
Then we put all data in single framework & apply various statistical tools to find out the dynamic on the market.
During the analysis stage, feedback from the stakeholder groups would be compared to determine areas of agreement as well as areas of divergence


