
Key Insights
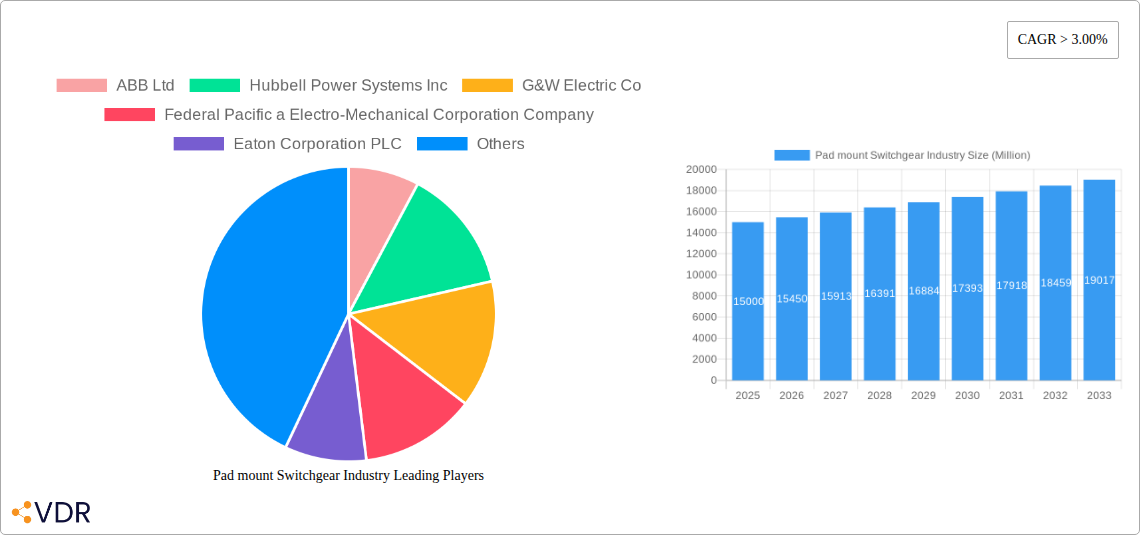
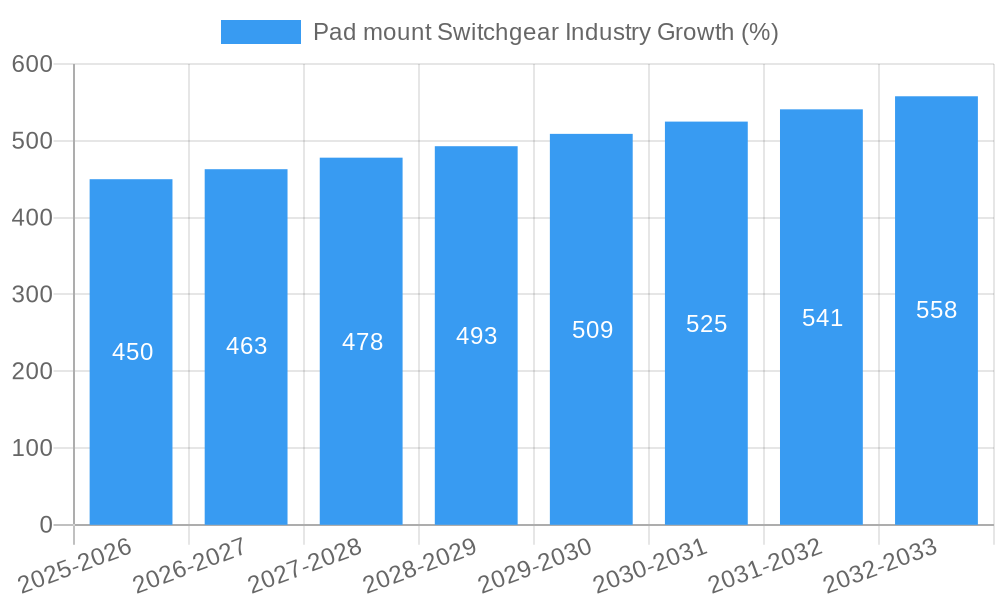
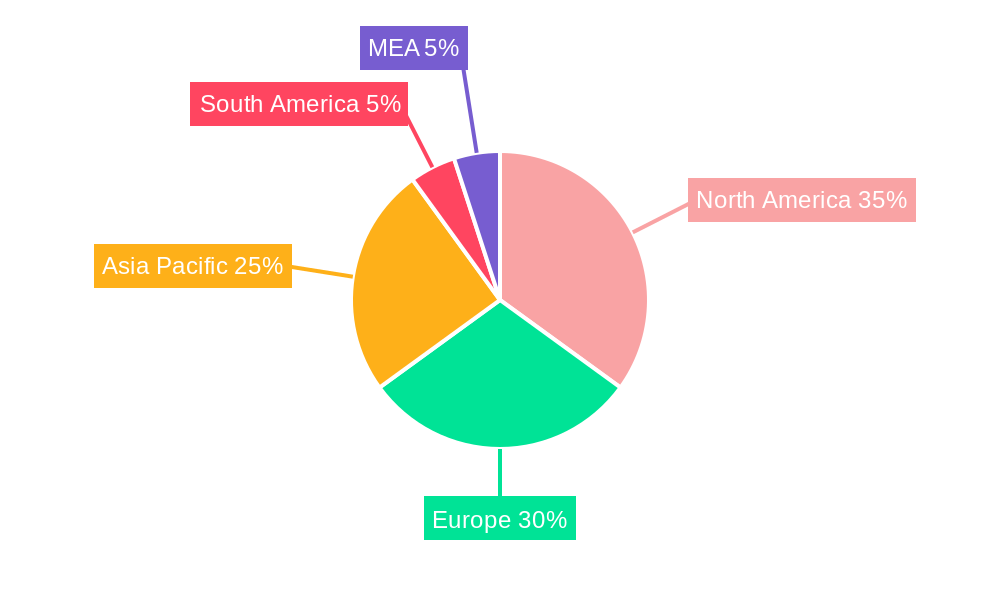
The pad mount switchgear market is experiencing robust growth, driven by the increasing demand for reliable and efficient power distribution in industrial, commercial, and residential sectors globally. A Compound Annual Growth Rate (CAGR) exceeding 3.00% indicates a steadily expanding market, projected to reach a significant size over the forecast period (2025-2033). Key drivers include the expansion of smart grids, the growing adoption of renewable energy sources requiring efficient integration into the grid, and the rising urbanization leading to increased electricity consumption. Technological advancements, such as the integration of digital monitoring and control systems, further enhance the appeal and functionality of pad mount switchgear, fostering market expansion. While challenges exist, such as the high initial investment costs and potential supply chain disruptions, these are being offset by the long-term benefits of improved power reliability and reduced operational costs. The market segmentation, encompassing various insulating mediums (air, gas, fluids, solid materials) and application areas, provides opportunities for specialized product development and targeted market strategies. Geographically, North America and Europe currently hold substantial market shares, yet significant growth potential exists in rapidly developing economies within the Asia-Pacific region, driven by infrastructure development and industrialization.
The competitive landscape is characterized by a mix of established multinational corporations and regional players. Companies like ABB Ltd, Eaton Corporation PLC, and others are leveraging their technological expertise and extensive distribution networks to maintain market leadership. However, the increasing presence of regional players presents both opportunities and challenges for established firms. The market's success hinges on continued innovation in switchgear technology, addressing sustainability concerns, and adapting to evolving regulatory landscapes. The focus on advanced materials, improved safety features, and digitalization will be crucial factors in shaping the future trajectory of the pad mount switchgear industry. The forecast period of 2025-2033 presents a promising outlook for continued growth and market expansion driven by the factors outlined above. Successful market players will prioritize adaptability, innovation, and sustainable practices to capitalize on the emerging opportunities within this dynamic sector.
Pad Mount Switchgear Industry Market Report: 2019-2033
This comprehensive report provides a detailed analysis of the global pad mount switchgear industry, offering invaluable insights for industry professionals, investors, and strategic decision-makers. Covering the period 2019-2033, with a focus on 2025, this report examines market dynamics, growth trends, regional performance, competitive landscape, and future opportunities. The report segments the market by insulating medium (Air, Gas, Fluids, Solid Materials) and application (Industrial, Commercial, Residential), providing a granular understanding of this crucial electrical infrastructure sector. The market size is expressed in Million units.
Pad mount Switchgear Industry Market Dynamics & Structure
The pad mount switchgear market is characterized by moderate concentration, with key players holding significant market share. Technological innovation, driven by the need for enhanced safety, reliability, and efficiency, is a major growth driver. Stringent regulatory frameworks, particularly concerning safety and environmental compliance, shape market practices. Competitive pressure exists from alternative switching technologies, but pad mount switchgear retains dominance due to its established infrastructure and cost-effectiveness. End-user demographics, particularly within the industrial and utility sectors, significantly influence market demand. Mergers and acquisitions (M&A) activity remains moderate, with strategic partnerships playing a larger role in shaping the competitive landscape.
- Market Concentration: Moderately concentrated, with top 5 players holding approximately xx% market share in 2024.
- Technological Innovation: Focus on smart grid integration, digitalization, and improved safety features.
- Regulatory Landscape: Stringent safety and environmental regulations influence product design and manufacturing.
- Competitive Substitutes: Limited, with existing infrastructure favoring pad mount switchgear.
- End-User Demographics: Significant demand from industrial and utility sectors, driven by infrastructure development and grid modernization.
- M&A Activity: Moderate level of M&A activity, primarily focused on strategic acquisitions and technology integrations; xx M&A deals observed between 2019-2024.
Pad mount Switchgear Industry Growth Trends & Insights
The global pad mount switchgear market exhibited a CAGR of xx% during the historical period (2019-2024), reaching a market size of xx Million units in 2024. Driven by increasing urbanization, industrialization, and the growing adoption of renewable energy sources (particularly solar power, as evidenced by the James City County solar farm project), the market is projected to maintain a robust CAGR of xx% during the forecast period (2025-2033), reaching xx Million units by 2033. Technological advancements, such as smart grid integration and the development of more efficient and reliable switchgear, are further fueling market growth. Consumer behavior shifts towards environmentally friendly solutions also influence product demand. Market penetration in developing economies is expected to increase significantly, providing substantial growth opportunities.
Dominant Regions, Countries, or Segments in Pad mount Switchgear Industry
The North American market currently dominates the pad mount switchgear industry, driven by significant investments in infrastructure modernization and robust industrial activity. Within North America, the United States holds the largest market share, followed by Canada. Europe follows as a significant market, driven by stringent environmental regulations and grid modernization efforts. The Asia-Pacific region presents substantial growth potential, driven by rapid urbanization, industrial expansion, and increasing investment in renewable energy infrastructure. Within the segment breakdown:
Insulating Medium: Air-insulated switchgear holds the largest market share due to its cost-effectiveness and established infrastructure, followed by gas-insulated switchgear, which is witnessing increasing adoption due to its enhanced safety and reliability.
Application: The industrial sector is the dominant end-user segment, driven by the increasing demand for reliable power supply in manufacturing facilities and industrial parks. Commercial and residential sectors are also experiencing growth but at a slower pace.
Key Drivers:
- Robust infrastructure development in North America and Europe.
- Growing investment in renewable energy projects globally.
- Stringent environmental regulations driving the adoption of more efficient and environmentally friendly switchgear.
- Increasing demand for reliable power supply in industrial and commercial sectors.
Pad mount Switchgear Industry Product Landscape
The pad mount switchgear market features a diverse range of products, including single-phase and three-phase units, with varying voltage and current ratings. Recent innovations focus on enhanced safety features, improved reliability, and smart grid integration capabilities. Manufacturers are increasingly incorporating digital technologies to enable remote monitoring, predictive maintenance, and improved operational efficiency. Unique selling propositions include advanced protection features, compact designs, and modularity for easy installation and maintenance. The integration of sensors and communication protocols is also a key technological advancement.
Key Drivers, Barriers & Challenges in Pad mount Switchgear Industry
Key Drivers:
- Increasing demand for reliable and efficient power distribution.
- Growing investments in renewable energy infrastructure (solar farms, wind farms).
- Stringent regulatory compliance requirements, pushing for safer and more efficient switchgear.
- Advancements in smart grid technologies.
Key Challenges:
- Supply chain disruptions impacting raw material availability and production costs. These disruptions resulted in a xx% increase in production costs in 2022.
- Stringent regulatory approvals and compliance requirements increase development time and costs.
- Intense competition from established players and emerging market entrants.
Emerging Opportunities in Pad mount Switchgear Industry
- Expansion into developing economies with rapidly growing infrastructure needs.
- Development of advanced smart grid-integrated switchgear with improved monitoring and control capabilities.
- Growing demand for sustainable and eco-friendly switchgear solutions.
- Integration of renewable energy sources with existing grid infrastructure.
Growth Accelerators in the Pad mount Switchgear Industry
Technological advancements, particularly in smart grid technologies, are major catalysts for market growth. Strategic partnerships between manufacturers and utility companies are driving innovation and market expansion. Government initiatives promoting renewable energy and infrastructure development are creating favorable market conditions. Expansion into emerging markets with growing power demands provides significant growth opportunities.
Key Players Shaping the Pad mount Switchgear Industry Market
- ABB Ltd
- Hubbell Power Systems Inc
- G&W Electric Co
- Federal Pacific a Electro-Mechanical Corporation Company
- Eaton Corporation PLC
- Powell Industries Inc
- The International Electrical Products Co (TIEPCO)
- Electric and Electronic Co Ltd
- S&C Electric Company
Notable Milestones in Pad mount Switchgear Industry Sector
- April 2022: ABB launched the Elastimold™ Tru-Break™ single-phase switchgear module and the Elastimold™ Veri-Spike™ grounding-aid device, enhancing safety for utility personnel.
- March 2022: The James City County, Virginia approved a new solar farm utilizing on-site pad-mounted switchgear, highlighting the growing integration of renewable energy sources.
In-Depth Pad mount Switchgear Industry Market Outlook
The pad mount switchgear market is poised for sustained growth, driven by continued investments in infrastructure modernization, the expansion of renewable energy sources, and the increasing adoption of smart grid technologies. Strategic partnerships, technological advancements, and expansion into emerging markets will further propel market growth. The focus on enhanced safety and reliability, coupled with the demand for sustainable solutions, presents significant opportunities for market players to innovate and capture market share.
Pad mount Switchgear Industry Segmentation
-
1. Insulating Medium
- 1.1. Air
- 1.2. Gas
- 1.3. Fluids
- 1.4. Solid Materials
-
2. Application
- 2.1. Industrial
- 2.2. Commercial
- 2.3. Residential
Pad mount Switchgear Industry Segmentation By Geography
- 1. North America
- 2. Europe
- 3. Asia Pacific
- 4. South America
- 5. Middle East and Africa
Pad mount Switchgear Industry REPORT HIGHLIGHTS
| Aspects | Details |
|---|---|
| Study Period | 2019-2033 |
| Base Year | 2024 |
| Estimated Year | 2025 |
| Forecast Period | 2025-2033 |
| Historical Period | 2019-2024 |
| Growth Rate | CAGR of > 3.00% from 2019-2033 |
| Segmentation |
|
Table of Contents
- 1. Introduction
- 1.1. Research Scope
- 1.2. Market Segmentation
- 1.3. Research Methodology
- 1.4. Definitions and Assumptions
- 2. Executive Summary
- 2.1. Introduction
- 3. Market Dynamics
- 3.1. Introduction
- 3.2. Market Drivers
- 3.2.1. 4.; Increasing Power Generation Capacity Worldwide4.; Rise In Electricity Demand Due Increase Industrial And Infrastructural Development Activities
- 3.3. Market Restrains
- 3.3.1. 4.; Growth In Distributed Energy Generation
- 3.4. Market Trends
- 3.4.1. Gas Insulated Switchgear is Expected to Grow at the Fastest Rate
- 4. Market Factor Analysis
- 4.1. Porters Five Forces
- 4.2. Supply/Value Chain
- 4.3. PESTEL analysis
- 4.4. Market Entropy
- 4.5. Patent/Trademark Analysis
- 5. Global Pad mount Switchgear Industry Analysis, Insights and Forecast, 2019-2031
- 5.1. Market Analysis, Insights and Forecast - by Insulating Medium
- 5.1.1. Air
- 5.1.2. Gas
- 5.1.3. Fluids
- 5.1.4. Solid Materials
- 5.2. Market Analysis, Insights and Forecast - by Application
- 5.2.1. Industrial
- 5.2.2. Commercial
- 5.2.3. Residential
- 5.3. Market Analysis, Insights and Forecast - by Region
- 5.3.1. North America
- 5.3.2. Europe
- 5.3.3. Asia Pacific
- 5.3.4. South America
- 5.3.5. Middle East and Africa
- 5.1. Market Analysis, Insights and Forecast - by Insulating Medium
- 6. North America Pad mount Switchgear Industry Analysis, Insights and Forecast, 2019-2031
- 6.1. Market Analysis, Insights and Forecast - by Insulating Medium
- 6.1.1. Air
- 6.1.2. Gas
- 6.1.3. Fluids
- 6.1.4. Solid Materials
- 6.2. Market Analysis, Insights and Forecast - by Application
- 6.2.1. Industrial
- 6.2.2. Commercial
- 6.2.3. Residential
- 6.1. Market Analysis, Insights and Forecast - by Insulating Medium
- 7. Europe Pad mount Switchgear Industry Analysis, Insights and Forecast, 2019-2031
- 7.1. Market Analysis, Insights and Forecast - by Insulating Medium
- 7.1.1. Air
- 7.1.2. Gas
- 7.1.3. Fluids
- 7.1.4. Solid Materials
- 7.2. Market Analysis, Insights and Forecast - by Application
- 7.2.1. Industrial
- 7.2.2. Commercial
- 7.2.3. Residential
- 7.1. Market Analysis, Insights and Forecast - by Insulating Medium
- 8. Asia Pacific Pad mount Switchgear Industry Analysis, Insights and Forecast, 2019-2031
- 8.1. Market Analysis, Insights and Forecast - by Insulating Medium
- 8.1.1. Air
- 8.1.2. Gas
- 8.1.3. Fluids
- 8.1.4. Solid Materials
- 8.2. Market Analysis, Insights and Forecast - by Application
- 8.2.1. Industrial
- 8.2.2. Commercial
- 8.2.3. Residential
- 8.1. Market Analysis, Insights and Forecast - by Insulating Medium
- 9. South America Pad mount Switchgear Industry Analysis, Insights and Forecast, 2019-2031
- 9.1. Market Analysis, Insights and Forecast - by Insulating Medium
- 9.1.1. Air
- 9.1.2. Gas
- 9.1.3. Fluids
- 9.1.4. Solid Materials
- 9.2. Market Analysis, Insights and Forecast - by Application
- 9.2.1. Industrial
- 9.2.2. Commercial
- 9.2.3. Residential
- 9.1. Market Analysis, Insights and Forecast - by Insulating Medium
- 10. Middle East and Africa Pad mount Switchgear Industry Analysis, Insights and Forecast, 2019-2031
- 10.1. Market Analysis, Insights and Forecast - by Insulating Medium
- 10.1.1. Air
- 10.1.2. Gas
- 10.1.3. Fluids
- 10.1.4. Solid Materials
- 10.2. Market Analysis, Insights and Forecast - by Application
- 10.2.1. Industrial
- 10.2.2. Commercial
- 10.2.3. Residential
- 10.1. Market Analysis, Insights and Forecast - by Insulating Medium
- 11. North America Pad mount Switchgear Industry Analysis, Insights and Forecast, 2019-2031
- 11.1. Market Analysis, Insights and Forecast - By Country/Sub-region
- 11.1.1 United States
- 11.1.2 Canada
- 11.1.3 Mexico
- 12. Europe Pad mount Switchgear Industry Analysis, Insights and Forecast, 2019-2031
- 12.1. Market Analysis, Insights and Forecast - By Country/Sub-region
- 12.1.1 Germany
- 12.1.2 United Kingdom
- 12.1.3 France
- 12.1.4 Spain
- 12.1.5 Italy
- 12.1.6 Spain
- 12.1.7 Belgium
- 12.1.8 Netherland
- 12.1.9 Nordics
- 12.1.10 Rest of Europe
- 13. Asia Pacific Pad mount Switchgear Industry Analysis, Insights and Forecast, 2019-2031
- 13.1. Market Analysis, Insights and Forecast - By Country/Sub-region
- 13.1.1 China
- 13.1.2 Japan
- 13.1.3 India
- 13.1.4 South Korea
- 13.1.5 Southeast Asia
- 13.1.6 Australia
- 13.1.7 Indonesia
- 13.1.8 Phillipes
- 13.1.9 Singapore
- 13.1.10 Thailandc
- 13.1.11 Rest of Asia Pacific
- 14. South America Pad mount Switchgear Industry Analysis, Insights and Forecast, 2019-2031
- 14.1. Market Analysis, Insights and Forecast - By Country/Sub-region
- 14.1.1 Brazil
- 14.1.2 Argentina
- 14.1.3 Peru
- 14.1.4 Chile
- 14.1.5 Colombia
- 14.1.6 Ecuador
- 14.1.7 Venezuela
- 14.1.8 Rest of South America
- 15. North America Pad mount Switchgear Industry Analysis, Insights and Forecast, 2019-2031
- 15.1. Market Analysis, Insights and Forecast - By Country/Sub-region
- 15.1.1 United States
- 15.1.2 Canada
- 15.1.3 Mexico
- 16. MEA Pad mount Switchgear Industry Analysis, Insights and Forecast, 2019-2031
- 16.1. Market Analysis, Insights and Forecast - By Country/Sub-region
- 16.1.1 United Arab Emirates
- 16.1.2 Saudi Arabia
- 16.1.3 South Africa
- 16.1.4 Rest of Middle East and Africa
- 17. Competitive Analysis
- 17.1. Global Market Share Analysis 2024
- 17.2. Company Profiles
- 17.2.1 ABB Ltd
- 17.2.1.1. Overview
- 17.2.1.2. Products
- 17.2.1.3. SWOT Analysis
- 17.2.1.4. Recent Developments
- 17.2.1.5. Financials (Based on Availability)
- 17.2.2 Hubbell Power Systems Inc
- 17.2.2.1. Overview
- 17.2.2.2. Products
- 17.2.2.3. SWOT Analysis
- 17.2.2.4. Recent Developments
- 17.2.2.5. Financials (Based on Availability)
- 17.2.3 G&W Electric Co
- 17.2.3.1. Overview
- 17.2.3.2. Products
- 17.2.3.3. SWOT Analysis
- 17.2.3.4. Recent Developments
- 17.2.3.5. Financials (Based on Availability)
- 17.2.4 Federal Pacific a Electro-Mechanical Corporation Company
- 17.2.4.1. Overview
- 17.2.4.2. Products
- 17.2.4.3. SWOT Analysis
- 17.2.4.4. Recent Developments
- 17.2.4.5. Financials (Based on Availability)
- 17.2.5 Eaton Corporation PLC
- 17.2.5.1. Overview
- 17.2.5.2. Products
- 17.2.5.3. SWOT Analysis
- 17.2.5.4. Recent Developments
- 17.2.5.5. Financials (Based on Availability)
- 17.2.6 Powell Industries Inc
- 17.2.6.1. Overview
- 17.2.6.2. Products
- 17.2.6.3. SWOT Analysis
- 17.2.6.4. Recent Developments
- 17.2.6.5. Financials (Based on Availability)
- 17.2.7 The International Electrical Products Co (TIEPCO)
- 17.2.7.1. Overview
- 17.2.7.2. Products
- 17.2.7.3. SWOT Analysis
- 17.2.7.4. Recent Developments
- 17.2.7.5. Financials (Based on Availability)
- 17.2.8 Electric and Electronic Co Ltd *List Not Exhaustive
- 17.2.8.1. Overview
- 17.2.8.2. Products
- 17.2.8.3. SWOT Analysis
- 17.2.8.4. Recent Developments
- 17.2.8.5. Financials (Based on Availability)
- 17.2.9 S&C Electric Company
- 17.2.9.1. Overview
- 17.2.9.2. Products
- 17.2.9.3. SWOT Analysis
- 17.2.9.4. Recent Developments
- 17.2.9.5. Financials (Based on Availability)
- 17.2.1 ABB Ltd
List of Figures
- Figure 1: Global Pad mount Switchgear Industry Revenue Breakdown (Million, %) by Region 2024 & 2032
- Figure 2: North America Pad mount Switchgear Industry Revenue (Million), by Country 2024 & 2032
- Figure 3: North America Pad mount Switchgear Industry Revenue Share (%), by Country 2024 & 2032
- Figure 4: Europe Pad mount Switchgear Industry Revenue (Million), by Country 2024 & 2032
- Figure 5: Europe Pad mount Switchgear Industry Revenue Share (%), by Country 2024 & 2032
- Figure 6: Asia Pacific Pad mount Switchgear Industry Revenue (Million), by Country 2024 & 2032
- Figure 7: Asia Pacific Pad mount Switchgear Industry Revenue Share (%), by Country 2024 & 2032
- Figure 8: South America Pad mount Switchgear Industry Revenue (Million), by Country 2024 & 2032
- Figure 9: South America Pad mount Switchgear Industry Revenue Share (%), by Country 2024 & 2032
- Figure 10: North America Pad mount Switchgear Industry Revenue (Million), by Country 2024 & 2032
- Figure 11: North America Pad mount Switchgear Industry Revenue Share (%), by Country 2024 & 2032
- Figure 12: MEA Pad mount Switchgear Industry Revenue (Million), by Country 2024 & 2032
- Figure 13: MEA Pad mount Switchgear Industry Revenue Share (%), by Country 2024 & 2032
- Figure 14: North America Pad mount Switchgear Industry Revenue (Million), by Insulating Medium 2024 & 2032
- Figure 15: North America Pad mount Switchgear Industry Revenue Share (%), by Insulating Medium 2024 & 2032
- Figure 16: North America Pad mount Switchgear Industry Revenue (Million), by Application 2024 & 2032
- Figure 17: North America Pad mount Switchgear Industry Revenue Share (%), by Application 2024 & 2032
- Figure 18: North America Pad mount Switchgear Industry Revenue (Million), by Country 2024 & 2032
- Figure 19: North America Pad mount Switchgear Industry Revenue Share (%), by Country 2024 & 2032
- Figure 20: Europe Pad mount Switchgear Industry Revenue (Million), by Insulating Medium 2024 & 2032
- Figure 21: Europe Pad mount Switchgear Industry Revenue Share (%), by Insulating Medium 2024 & 2032
- Figure 22: Europe Pad mount Switchgear Industry Revenue (Million), by Application 2024 & 2032
- Figure 23: Europe Pad mount Switchgear Industry Revenue Share (%), by Application 2024 & 2032
- Figure 24: Europe Pad mount Switchgear Industry Revenue (Million), by Country 2024 & 2032
- Figure 25: Europe Pad mount Switchgear Industry Revenue Share (%), by Country 2024 & 2032
- Figure 26: Asia Pacific Pad mount Switchgear Industry Revenue (Million), by Insulating Medium 2024 & 2032
- Figure 27: Asia Pacific Pad mount Switchgear Industry Revenue Share (%), by Insulating Medium 2024 & 2032
- Figure 28: Asia Pacific Pad mount Switchgear Industry Revenue (Million), by Application 2024 & 2032
- Figure 29: Asia Pacific Pad mount Switchgear Industry Revenue Share (%), by Application 2024 & 2032
- Figure 30: Asia Pacific Pad mount Switchgear Industry Revenue (Million), by Country 2024 & 2032
- Figure 31: Asia Pacific Pad mount Switchgear Industry Revenue Share (%), by Country 2024 & 2032
- Figure 32: South America Pad mount Switchgear Industry Revenue (Million), by Insulating Medium 2024 & 2032
- Figure 33: South America Pad mount Switchgear Industry Revenue Share (%), by Insulating Medium 2024 & 2032
- Figure 34: South America Pad mount Switchgear Industry Revenue (Million), by Application 2024 & 2032
- Figure 35: South America Pad mount Switchgear Industry Revenue Share (%), by Application 2024 & 2032
- Figure 36: South America Pad mount Switchgear Industry Revenue (Million), by Country 2024 & 2032
- Figure 37: South America Pad mount Switchgear Industry Revenue Share (%), by Country 2024 & 2032
- Figure 38: Middle East and Africa Pad mount Switchgear Industry Revenue (Million), by Insulating Medium 2024 & 2032
- Figure 39: Middle East and Africa Pad mount Switchgear Industry Revenue Share (%), by Insulating Medium 2024 & 2032
- Figure 40: Middle East and Africa Pad mount Switchgear Industry Revenue (Million), by Application 2024 & 2032
- Figure 41: Middle East and Africa Pad mount Switchgear Industry Revenue Share (%), by Application 2024 & 2032
- Figure 42: Middle East and Africa Pad mount Switchgear Industry Revenue (Million), by Country 2024 & 2032
- Figure 43: Middle East and Africa Pad mount Switchgear Industry Revenue Share (%), by Country 2024 & 2032
List of Tables
- Table 1: Global Pad mount Switchgear Industry Revenue Million Forecast, by Region 2019 & 2032
- Table 2: Global Pad mount Switchgear Industry Revenue Million Forecast, by Insulating Medium 2019 & 2032
- Table 3: Global Pad mount Switchgear Industry Revenue Million Forecast, by Application 2019 & 2032
- Table 4: Global Pad mount Switchgear Industry Revenue Million Forecast, by Region 2019 & 2032
- Table 5: Global Pad mount Switchgear Industry Revenue Million Forecast, by Country 2019 & 2032
- Table 6: United States Pad mount Switchgear Industry Revenue (Million) Forecast, by Application 2019 & 2032
- Table 7: Canada Pad mount Switchgear Industry Revenue (Million) Forecast, by Application 2019 & 2032
- Table 8: Mexico Pad mount Switchgear Industry Revenue (Million) Forecast, by Application 2019 & 2032
- Table 9: Global Pad mount Switchgear Industry Revenue Million Forecast, by Country 2019 & 2032
- Table 10: Germany Pad mount Switchgear Industry Revenue (Million) Forecast, by Application 2019 & 2032
- Table 11: United Kingdom Pad mount Switchgear Industry Revenue (Million) Forecast, by Application 2019 & 2032
- Table 12: France Pad mount Switchgear Industry Revenue (Million) Forecast, by Application 2019 & 2032
- Table 13: Spain Pad mount Switchgear Industry Revenue (Million) Forecast, by Application 2019 & 2032
- Table 14: Italy Pad mount Switchgear Industry Revenue (Million) Forecast, by Application 2019 & 2032
- Table 15: Spain Pad mount Switchgear Industry Revenue (Million) Forecast, by Application 2019 & 2032
- Table 16: Belgium Pad mount Switchgear Industry Revenue (Million) Forecast, by Application 2019 & 2032
- Table 17: Netherland Pad mount Switchgear Industry Revenue (Million) Forecast, by Application 2019 & 2032
- Table 18: Nordics Pad mount Switchgear Industry Revenue (Million) Forecast, by Application 2019 & 2032
- Table 19: Rest of Europe Pad mount Switchgear Industry Revenue (Million) Forecast, by Application 2019 & 2032
- Table 20: Global Pad mount Switchgear Industry Revenue Million Forecast, by Country 2019 & 2032
- Table 21: China Pad mount Switchgear Industry Revenue (Million) Forecast, by Application 2019 & 2032
- Table 22: Japan Pad mount Switchgear Industry Revenue (Million) Forecast, by Application 2019 & 2032
- Table 23: India Pad mount Switchgear Industry Revenue (Million) Forecast, by Application 2019 & 2032
- Table 24: South Korea Pad mount Switchgear Industry Revenue (Million) Forecast, by Application 2019 & 2032
- Table 25: Southeast Asia Pad mount Switchgear Industry Revenue (Million) Forecast, by Application 2019 & 2032
- Table 26: Australia Pad mount Switchgear Industry Revenue (Million) Forecast, by Application 2019 & 2032
- Table 27: Indonesia Pad mount Switchgear Industry Revenue (Million) Forecast, by Application 2019 & 2032
- Table 28: Phillipes Pad mount Switchgear Industry Revenue (Million) Forecast, by Application 2019 & 2032
- Table 29: Singapore Pad mount Switchgear Industry Revenue (Million) Forecast, by Application 2019 & 2032
- Table 30: Thailandc Pad mount Switchgear Industry Revenue (Million) Forecast, by Application 2019 & 2032
- Table 31: Rest of Asia Pacific Pad mount Switchgear Industry Revenue (Million) Forecast, by Application 2019 & 2032
- Table 32: Global Pad mount Switchgear Industry Revenue Million Forecast, by Country 2019 & 2032
- Table 33: Brazil Pad mount Switchgear Industry Revenue (Million) Forecast, by Application 2019 & 2032
- Table 34: Argentina Pad mount Switchgear Industry Revenue (Million) Forecast, by Application 2019 & 2032
- Table 35: Peru Pad mount Switchgear Industry Revenue (Million) Forecast, by Application 2019 & 2032
- Table 36: Chile Pad mount Switchgear Industry Revenue (Million) Forecast, by Application 2019 & 2032
- Table 37: Colombia Pad mount Switchgear Industry Revenue (Million) Forecast, by Application 2019 & 2032
- Table 38: Ecuador Pad mount Switchgear Industry Revenue (Million) Forecast, by Application 2019 & 2032
- Table 39: Venezuela Pad mount Switchgear Industry Revenue (Million) Forecast, by Application 2019 & 2032
- Table 40: Rest of South America Pad mount Switchgear Industry Revenue (Million) Forecast, by Application 2019 & 2032
- Table 41: Global Pad mount Switchgear Industry Revenue Million Forecast, by Country 2019 & 2032
- Table 42: United States Pad mount Switchgear Industry Revenue (Million) Forecast, by Application 2019 & 2032
- Table 43: Canada Pad mount Switchgear Industry Revenue (Million) Forecast, by Application 2019 & 2032
- Table 44: Mexico Pad mount Switchgear Industry Revenue (Million) Forecast, by Application 2019 & 2032
- Table 45: Global Pad mount Switchgear Industry Revenue Million Forecast, by Country 2019 & 2032
- Table 46: United Arab Emirates Pad mount Switchgear Industry Revenue (Million) Forecast, by Application 2019 & 2032
- Table 47: Saudi Arabia Pad mount Switchgear Industry Revenue (Million) Forecast, by Application 2019 & 2032
- Table 48: South Africa Pad mount Switchgear Industry Revenue (Million) Forecast, by Application 2019 & 2032
- Table 49: Rest of Middle East and Africa Pad mount Switchgear Industry Revenue (Million) Forecast, by Application 2019 & 2032
- Table 50: Global Pad mount Switchgear Industry Revenue Million Forecast, by Insulating Medium 2019 & 2032
- Table 51: Global Pad mount Switchgear Industry Revenue Million Forecast, by Application 2019 & 2032
- Table 52: Global Pad mount Switchgear Industry Revenue Million Forecast, by Country 2019 & 2032
- Table 53: Global Pad mount Switchgear Industry Revenue Million Forecast, by Insulating Medium 2019 & 2032
- Table 54: Global Pad mount Switchgear Industry Revenue Million Forecast, by Application 2019 & 2032
- Table 55: Global Pad mount Switchgear Industry Revenue Million Forecast, by Country 2019 & 2032
- Table 56: Global Pad mount Switchgear Industry Revenue Million Forecast, by Insulating Medium 2019 & 2032
- Table 57: Global Pad mount Switchgear Industry Revenue Million Forecast, by Application 2019 & 2032
- Table 58: Global Pad mount Switchgear Industry Revenue Million Forecast, by Country 2019 & 2032
- Table 59: Global Pad mount Switchgear Industry Revenue Million Forecast, by Insulating Medium 2019 & 2032
- Table 60: Global Pad mount Switchgear Industry Revenue Million Forecast, by Application 2019 & 2032
- Table 61: Global Pad mount Switchgear Industry Revenue Million Forecast, by Country 2019 & 2032
- Table 62: Global Pad mount Switchgear Industry Revenue Million Forecast, by Insulating Medium 2019 & 2032
- Table 63: Global Pad mount Switchgear Industry Revenue Million Forecast, by Application 2019 & 2032
- Table 64: Global Pad mount Switchgear Industry Revenue Million Forecast, by Country 2019 & 2032
Frequently Asked Questions
1. What is the projected Compound Annual Growth Rate (CAGR) of the Pad mount Switchgear Industry?
The projected CAGR is approximately > 3.00%.
2. Which companies are prominent players in the Pad mount Switchgear Industry?
Key companies in the market include ABB Ltd, Hubbell Power Systems Inc, G&W Electric Co, Federal Pacific a Electro-Mechanical Corporation Company, Eaton Corporation PLC, Powell Industries Inc, The International Electrical Products Co (TIEPCO), Electric and Electronic Co Ltd *List Not Exhaustive, S&C Electric Company.
3. What are the main segments of the Pad mount Switchgear Industry?
The market segments include Insulating Medium, Application.
4. Can you provide details about the market size?
The market size is estimated to be USD XX Million as of 2022.
5. What are some drivers contributing to market growth?
4.; Increasing Power Generation Capacity Worldwide4.; Rise In Electricity Demand Due Increase Industrial And Infrastructural Development Activities.
6. What are the notable trends driving market growth?
Gas Insulated Switchgear is Expected to Grow at the Fastest Rate.
7. Are there any restraints impacting market growth?
4.; Growth In Distributed Energy Generation.
8. Can you provide examples of recent developments in the market?
In April 2022, ABB collaborated with customers to develop the new ElastimoldTM Tru-BreakTM single-phase switchgear module and the new ElastimoldTM Veri-SpikeTM grounding-aid device, which help reduce danger to utility personnel who maintain electrical equipment. The most recent medium voltage systems are interchangeable with ABB gear and can be used in construction, communications, industrial, utility, and original equipment manufacturer (OEM) applications.
9. What pricing options are available for accessing the report?
Pricing options include single-user, multi-user, and enterprise licenses priced at USD 4750, USD 5250, and USD 8750 respectively.
10. Is the market size provided in terms of value or volume?
The market size is provided in terms of value, measured in Million.
11. Are there any specific market keywords associated with the report?
Yes, the market keyword associated with the report is "Pad mount Switchgear Industry," which aids in identifying and referencing the specific market segment covered.
12. How do I determine which pricing option suits my needs best?
The pricing options vary based on user requirements and access needs. Individual users may opt for single-user licenses, while businesses requiring broader access may choose multi-user or enterprise licenses for cost-effective access to the report.
13. Are there any additional resources or data provided in the Pad mount Switchgear Industry report?
While the report offers comprehensive insights, it's advisable to review the specific contents or supplementary materials provided to ascertain if additional resources or data are available.
14. How can I stay updated on further developments or reports in the Pad mount Switchgear Industry?
To stay informed about further developments, trends, and reports in the Pad mount Switchgear Industry, consider subscribing to industry newsletters, following relevant companies and organizations, or regularly checking reputable industry news sources and publications.
Methodology
Step 1 - Identification of Relevant Samples Size from Population Database


Step 2 - Approaches for Defining Global Market Size (Value, Volume* & Price*)

Note*: In applicable scenarios
Step 3 - Data Sources
Primary Research
- Web Analytics
- Survey Reports
- Research Institute
- Latest Research Reports
- Opinion Leaders
Secondary Research
- Annual Reports
- White Paper
- Latest Press Release
- Industry Association
- Paid Database
- Investor Presentations

Step 4 - Data Triangulation
Involves using different sources of information in order to increase the validity of a study
These sources are likely to be stakeholders in a program - participants, other researchers, program staff, other community members, and so on.
Then we put all data in single framework & apply various statistical tools to find out the dynamic on the market.
During the analysis stage, feedback from the stakeholder groups would be compared to determine areas of agreement as well as areas of divergence


