
Key Insights
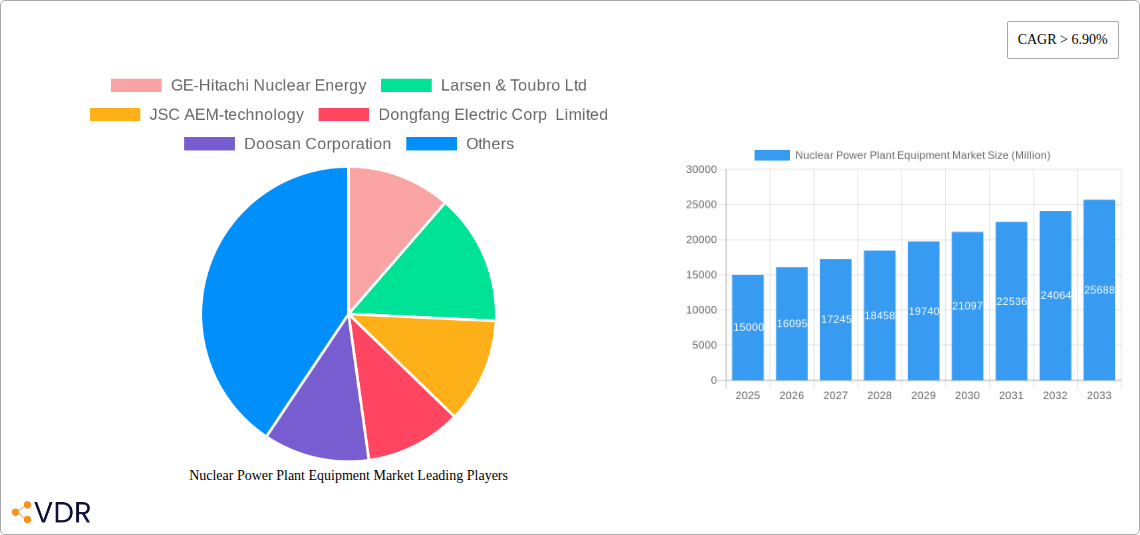
The global Nuclear Power Plant Equipment market is experiencing robust growth, projected to maintain a Compound Annual Growth Rate (CAGR) exceeding 6.90% from 2025 to 2033. This expansion is driven by several factors. Increasing global energy demand, coupled with concerns over climate change and the need for reliable baseload power, are fueling investments in nuclear energy infrastructure. Furthermore, advancements in reactor technology, such as the development of smaller, modular reactors (SMRs) and improved safety features, are enhancing the attractiveness of nuclear power. Governmental policies promoting nuclear energy as a low-carbon energy source are also contributing to market growth. The market is segmented by reactor type (Pressurized Water Reactor, Pressurized Heavy Water Reactor, Boiling Water Reactor, High-temperature Gas Cooled Reactor, Liquid Metal Fast Breeder Reactor, Other Reactors) and equipment type (Island Equipment, Auxiliary Equipment). Competition is fierce, with major players like GE-Hitachi Nuclear Energy, Larsen & Toubro, and Westinghouse Electric Company vying for market share. Geographical growth is expected to be diverse, with significant expansion in Asia-Pacific (driven by China and India's energy needs), North America (fueled by existing infrastructure and technological advancements), and potentially in regions like the Middle East and Africa as nuclear programs develop. However, the market faces constraints, including high initial capital costs associated with nuclear power plant construction, stringent safety regulations, and public perception concerns relating to nuclear waste disposal and potential accidents.
Despite these challenges, the long-term outlook for the Nuclear Power Plant Equipment market remains positive. The continuous development of innovative and safer reactor technologies, coupled with growing energy demands and environmental concerns, is likely to outweigh the restraining factors. The increasing focus on sustainable energy sources and the need for reliable electricity supply will bolster the demand for nuclear power plant equipment in the coming years. The market is likely to see a consolidation of players as companies seek to enhance their market position through strategic alliances and technological collaborations. The continued expansion of nuclear energy programs worldwide will present significant growth opportunities for key players in the market, leading to a sustained period of market expansion throughout the forecast period.
Nuclear Power Plant Equipment Market: A Comprehensive Report (2019-2033)
This in-depth report provides a comprehensive analysis of the Nuclear Power Plant Equipment market, encompassing market dynamics, growth trends, regional segmentation, product landscape, key players, and future outlook. The study period spans from 2019 to 2033, with 2025 serving as both the base and estimated year. The report utilizes data from the historical period (2019-2024) and forecasts the market from 2025 to 2033. This report is crucial for industry professionals, investors, and researchers seeking a granular understanding of this vital sector. The parent market is the Energy sector, while the child market is specifically Nuclear Power Generation Equipment.
Nuclear Power Plant Equipment Market Dynamics & Structure
The Nuclear Power Plant Equipment market is characterized by a moderately concentrated structure, with a few major players holding significant market share. The market is driven by technological innovations focused on enhancing safety, efficiency, and reducing the environmental impact of nuclear power generation. Stringent regulatory frameworks governing nuclear safety and waste management significantly influence market dynamics. The competitive landscape includes established players and emerging companies vying for market share, leading to mergers and acquisitions (M&A) activity. Substitute technologies like renewable energy sources exert competitive pressure, while the increasing demand for reliable and low-carbon energy sources fuels market growth.
- Market Concentration: High (xx%), with top 5 players holding approximately xx% of the market share in 2024.
- Technological Innovation: Focus on advanced reactor designs (e.g., Small Modular Reactors (SMRs)), improved safety systems, and waste management solutions.
- Regulatory Framework: Strict regulations drive high capital expenditure and extended project timelines. Varying regulations across regions impact market growth.
- M&A Activity: Moderate level of M&A activity observed in the recent past, driven by consolidation and expansion strategies (xx deals in 2024, valued at xx Million).
- Competitive Substitutes: Renewable energy sources (solar, wind) pose a competitive threat, particularly in regions with supportive renewable energy policies.
- End-User Demographics: Primarily state-owned utilities and private power producers (PPPs) are the primary consumers.
Nuclear Power Plant Equipment Market Growth Trends & Insights
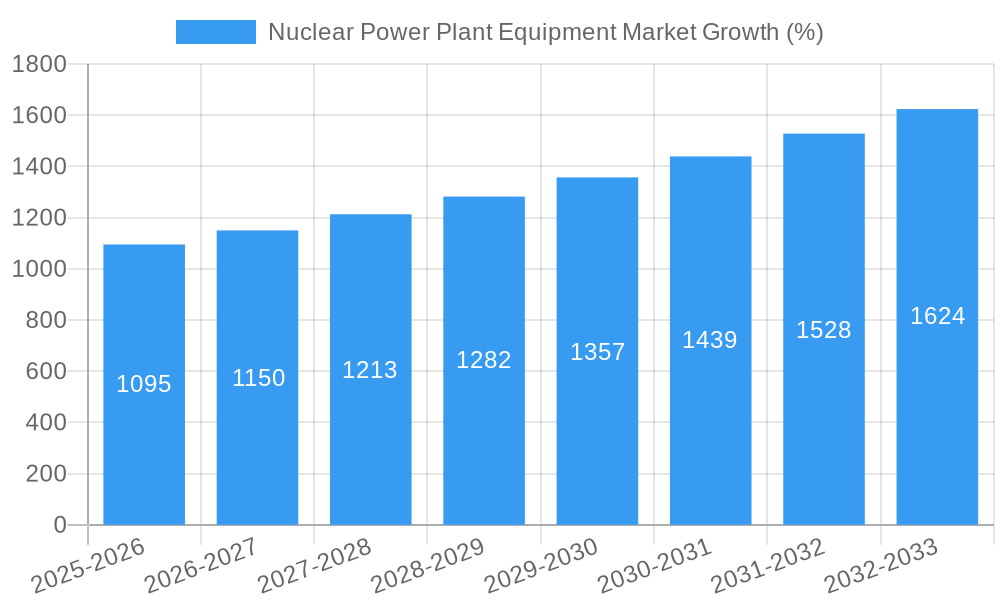
The Nuclear Power Plant Equipment market witnessed a [CAGR] growth rate during the historical period (2019-2024), reaching a market size of xx Million in 2024. This growth was fueled by increased investments in new nuclear power plants, particularly in Asia and the Middle East, alongside the replacement and upgrade of aging infrastructure in established nuclear power markets. The adoption rate of advanced reactor technologies is gradually increasing, while technological disruptions, such as the development of SMRs, are poised to reshape the market landscape. Shifts in consumer behavior – a growing emphasis on energy security and sustainability – are driving demand for nuclear power. The forecast period (2025-2033) projects a continued growth, driven by factors such as the increasing energy demand and climate change mitigation efforts. The market is expected to reach xx Million by 2033, with a projected CAGR of [CAGR] during the forecast period. Market penetration of advanced reactor technologies is expected to rise significantly.
Dominant Regions, Countries, or Segments in Nuclear Power Plant Equipment Market
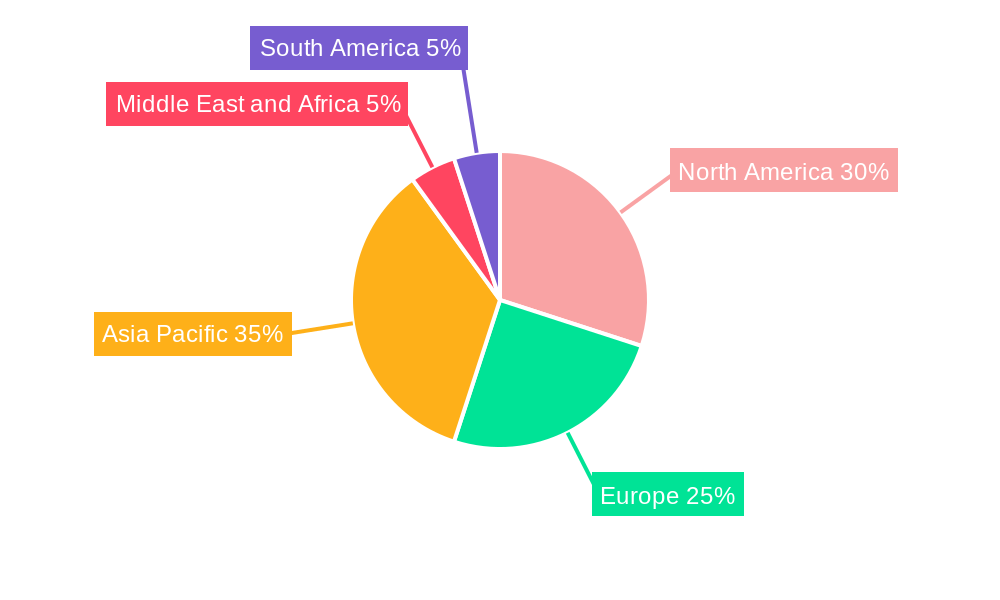
Asia (xx Million) is currently the dominant region in the Nuclear Power Plant Equipment market, followed by Europe (xx Million) and North America (xx Million) in 2024. This dominance stems from significant investments in new nuclear power plant construction projects in countries like China, India, and South Korea. Within product types, Pressurized Water Reactors (PWRs) hold the largest market share (xx%), due to their widespread adoption and technological maturity. Similarly, Island Equipment dominates the Carrier Type segment (xx%), reflecting the importance of core reactor components in overall plant construction.
- Key Drivers in Asia: Large-scale nuclear power plant construction programs, government support, and robust economic growth.
- Key Drivers in Europe: Nuclear power plant refurbishment and upgrades, along with exploration of advanced reactor designs.
- Key Drivers in North America: Gradual shift towards nuclear energy due to energy security and climate goals.
- PWR Dominance: Technological maturity, established supply chains, and extensive operational experience.
- Island Equipment Dominance: Essential components for reactor operation, representing substantial value in plant construction.
Nuclear Power Plant Equipment Market Product Landscape
The Nuclear Power Plant Equipment market showcases a diverse range of products, including pressurized water reactors, boiling water reactors, and advanced reactor designs. These products are characterized by high levels of safety and reliability, while continuous innovation focuses on improving efficiency and reducing operating costs. Recent advancements include the development of smaller, modular reactor designs that offer enhanced safety features and reduced construction times. These advancements drive competitiveness by addressing challenges such as cost reduction and deployment efficiency.
Key Drivers, Barriers & Challenges in Nuclear Power Plant Equipment Market
Key Drivers: Increasing global energy demand, climate change mitigation efforts, and government support for nuclear energy. The push for energy security, particularly in regions with limited fossil fuel reserves, further fuels market growth. The development of advanced reactor designs, such as Small Modular Reactors (SMRs), promising improved safety, efficiency, and reduced costs, act as additional growth catalysts.
Key Challenges: High capital costs associated with nuclear power plant construction, stringent safety regulations and licensing procedures, and the complexity of waste management represent significant market barriers. Supply chain disruptions and geopolitical instability can impact project timelines and costs. The competitive pressure from renewable energy sources and public perception concerns related to nuclear safety also pose challenges. Furthermore, skilled labor shortages add to project delays and cost overruns.
Emerging Opportunities in Nuclear Power Plant Equipment Market
Emerging opportunities lie in the development and deployment of advanced reactor designs, such as Small Modular Reactors (SMRs), and the expansion into new markets. Growing demand for baseload power and increasing awareness of climate change present significant opportunities for growth. Further opportunities arise from improvements in waste management technologies and the integration of nuclear energy within smart grids. These aspects present avenues to boost market growth in the upcoming years.
Growth Accelerators in the Nuclear Power Plant Equipment Market Industry
Technological advancements, particularly in reactor design and safety systems, are key growth accelerators. Strategic partnerships between manufacturers and utilities foster innovation and project development. Government policies promoting nuclear energy and investments in research and development (R&D) also contribute to market expansion. The successful implementation of advanced reactor designs is likely to significantly accelerate market growth.
Key Players Shaping the Nuclear Power Plant Equipment Market Market
- GE-Hitachi Nuclear Energy
- Larsen & Toubro Ltd
- JSC AEM-technology
- Dongfang Electric Corp Limited
- Doosan Corporation
- Babcock & Wilcox Company
- Areva SA
- Korea Electric Power Corporation (KEPCO)
- Westinghouse Electric Company LLC
- JSC ATOMSTROYEXPORT
- Mitsubishi Heavy Industries Ltd
Notable Milestones in Nuclear Power Plant Equipment Market Sector
- May 2020: Shipment of first components for Akkuyu NPP (Turkey) by Russia's Atommash, showcasing progress in international nuclear projects.
- June 29, 2020: Shutdown of Fessenheim NPP (France), highlighting the lifecycle of nuclear plants and potential for refurbishment/replacement markets.
- June 30, 2020: Paks II Ltd (Hungary) submits construction license application for new units, signifying ongoing investment in nuclear power expansion.
In-Depth Nuclear Power Plant Equipment Market Market Outlook
The Nuclear Power Plant Equipment market is poised for sustained growth driven by increasing energy demand, climate change concerns, and technological advancements. Strategic partnerships, R&D investments, and the adoption of advanced reactor designs will further shape market dynamics. Expansion into new markets and the development of innovative solutions for waste management offer significant opportunities for growth in the coming years. The forecast suggests robust growth, with substantial market potential across various regions and product segments.
Nuclear Power Plant Equipment Market Segmentation
-
1. Product Type
- 1.1. Pressurized Water Reactor
- 1.2. Pressurized Heavy Water Reactor
- 1.3. Boiling Water Reactor
- 1.4. High-temperature Gas Cooled Reactor
- 1.5. Liquid Metal Fast Breeder Reactor
- 1.6. Other Reactors
-
2. Carrier Type
- 2.1. Island Equipment
- 2.2. Auxiliary Equipment
Nuclear Power Plant Equipment Market Segmentation By Geography
-
1. North America
- 1.1. United States
- 1.2. Canada
- 1.3. Rest of North America
-
2. Asia Pacific
- 2.1. China
- 2.2. India
- 2.3. Japan
- 2.4. South Korea
- 2.5. Rest of Asia Pacific
-
3. Europe
- 3.1. Germany
- 3.2. United Kingdom
- 3.3. Russia
- 3.4. France
- 3.5. Rest of Europe
-
4. Middle East and Africa
- 4.1. United Arab Emirates
- 4.2. Saudi Arabia
- 4.3. South Africa
- 4.4. Iran
- 4.5. Rest of Middle East and Africa
-
5. South America
- 5.1. Brazil
- 5.2. Argentina
- 5.3. Rest of South America
Nuclear Power Plant Equipment Market REPORT HIGHLIGHTS
| Aspects | Details |
|---|---|
| Study Period | 2019-2033 |
| Base Year | 2024 |
| Estimated Year | 2025 |
| Forecast Period | 2025-2033 |
| Historical Period | 2019-2024 |
| Growth Rate | CAGR of > 6.90% from 2019-2033 |
| Segmentation |
|
Table of Contents
- 1. Introduction
- 1.1. Research Scope
- 1.2. Market Segmentation
- 1.3. Research Methodology
- 1.4. Definitions and Assumptions
- 2. Executive Summary
- 2.1. Introduction
- 3. Market Dynamics
- 3.1. Introduction
- 3.2. Market Drivers
- 3.2.1. 4.; Growing Vehicle Ownership4.; Government Initiatives
- 3.3. Market Restrains
- 3.3.1. 4.; Volatile Crude Oil Prices
- 3.4. Market Trends
- 3.4.1. Pressurized Water Reactor to Dominate the Market
- 4. Market Factor Analysis
- 4.1. Porters Five Forces
- 4.2. Supply/Value Chain
- 4.3. PESTEL analysis
- 4.4. Market Entropy
- 4.5. Patent/Trademark Analysis
- 5. Global Nuclear Power Plant Equipment Market Analysis, Insights and Forecast, 2019-2031
- 5.1. Market Analysis, Insights and Forecast - by Product Type
- 5.1.1. Pressurized Water Reactor
- 5.1.2. Pressurized Heavy Water Reactor
- 5.1.3. Boiling Water Reactor
- 5.1.4. High-temperature Gas Cooled Reactor
- 5.1.5. Liquid Metal Fast Breeder Reactor
- 5.1.6. Other Reactors
- 5.2. Market Analysis, Insights and Forecast - by Carrier Type
- 5.2.1. Island Equipment
- 5.2.2. Auxiliary Equipment
- 5.3. Market Analysis, Insights and Forecast - by Region
- 5.3.1. North America
- 5.3.2. Asia Pacific
- 5.3.3. Europe
- 5.3.4. Middle East and Africa
- 5.3.5. South America
- 5.1. Market Analysis, Insights and Forecast - by Product Type
- 6. North America Nuclear Power Plant Equipment Market Analysis, Insights and Forecast, 2019-2031
- 6.1. Market Analysis, Insights and Forecast - by Product Type
- 6.1.1. Pressurized Water Reactor
- 6.1.2. Pressurized Heavy Water Reactor
- 6.1.3. Boiling Water Reactor
- 6.1.4. High-temperature Gas Cooled Reactor
- 6.1.5. Liquid Metal Fast Breeder Reactor
- 6.1.6. Other Reactors
- 6.2. Market Analysis, Insights and Forecast - by Carrier Type
- 6.2.1. Island Equipment
- 6.2.2. Auxiliary Equipment
- 6.1. Market Analysis, Insights and Forecast - by Product Type
- 7. Asia Pacific Nuclear Power Plant Equipment Market Analysis, Insights and Forecast, 2019-2031
- 7.1. Market Analysis, Insights and Forecast - by Product Type
- 7.1.1. Pressurized Water Reactor
- 7.1.2. Pressurized Heavy Water Reactor
- 7.1.3. Boiling Water Reactor
- 7.1.4. High-temperature Gas Cooled Reactor
- 7.1.5. Liquid Metal Fast Breeder Reactor
- 7.1.6. Other Reactors
- 7.2. Market Analysis, Insights and Forecast - by Carrier Type
- 7.2.1. Island Equipment
- 7.2.2. Auxiliary Equipment
- 7.1. Market Analysis, Insights and Forecast - by Product Type
- 8. Europe Nuclear Power Plant Equipment Market Analysis, Insights and Forecast, 2019-2031
- 8.1. Market Analysis, Insights and Forecast - by Product Type
- 8.1.1. Pressurized Water Reactor
- 8.1.2. Pressurized Heavy Water Reactor
- 8.1.3. Boiling Water Reactor
- 8.1.4. High-temperature Gas Cooled Reactor
- 8.1.5. Liquid Metal Fast Breeder Reactor
- 8.1.6. Other Reactors
- 8.2. Market Analysis, Insights and Forecast - by Carrier Type
- 8.2.1. Island Equipment
- 8.2.2. Auxiliary Equipment
- 8.1. Market Analysis, Insights and Forecast - by Product Type
- 9. Middle East and Africa Nuclear Power Plant Equipment Market Analysis, Insights and Forecast, 2019-2031
- 9.1. Market Analysis, Insights and Forecast - by Product Type
- 9.1.1. Pressurized Water Reactor
- 9.1.2. Pressurized Heavy Water Reactor
- 9.1.3. Boiling Water Reactor
- 9.1.4. High-temperature Gas Cooled Reactor
- 9.1.5. Liquid Metal Fast Breeder Reactor
- 9.1.6. Other Reactors
- 9.2. Market Analysis, Insights and Forecast - by Carrier Type
- 9.2.1. Island Equipment
- 9.2.2. Auxiliary Equipment
- 9.1. Market Analysis, Insights and Forecast - by Product Type
- 10. South America Nuclear Power Plant Equipment Market Analysis, Insights and Forecast, 2019-2031
- 10.1. Market Analysis, Insights and Forecast - by Product Type
- 10.1.1. Pressurized Water Reactor
- 10.1.2. Pressurized Heavy Water Reactor
- 10.1.3. Boiling Water Reactor
- 10.1.4. High-temperature Gas Cooled Reactor
- 10.1.5. Liquid Metal Fast Breeder Reactor
- 10.1.6. Other Reactors
- 10.2. Market Analysis, Insights and Forecast - by Carrier Type
- 10.2.1. Island Equipment
- 10.2.2. Auxiliary Equipment
- 10.1. Market Analysis, Insights and Forecast - by Product Type
- 11. North America Nuclear Power Plant Equipment Market Analysis, Insights and Forecast, 2019-2031
- 11.1. Market Analysis, Insights and Forecast - By Country/Sub-region
- 11.1.1 United States
- 11.1.2 Canada
- 11.1.3 Rest of North America
- 12. Asia Pacific Nuclear Power Plant Equipment Market Analysis, Insights and Forecast, 2019-2031
- 12.1. Market Analysis, Insights and Forecast - By Country/Sub-region
- 12.1.1 China
- 12.1.2 India
- 12.1.3 Japan
- 12.1.4 South Korea
- 12.1.5 Rest of Asia Pacific
- 13. Europe Nuclear Power Plant Equipment Market Analysis, Insights and Forecast, 2019-2031
- 13.1. Market Analysis, Insights and Forecast - By Country/Sub-region
- 13.1.1 Germany
- 13.1.2 United Kingdom
- 13.1.3 Russia
- 13.1.4 France
- 13.1.5 Rest of Europe
- 14. Middle East and Africa Nuclear Power Plant Equipment Market Analysis, Insights and Forecast, 2019-2031
- 14.1. Market Analysis, Insights and Forecast - By Country/Sub-region
- 14.1.1 United Arab Emirates
- 14.1.2 Saudi Arabia
- 14.1.3 South Africa
- 14.1.4 Iran
- 14.1.5 Rest of Middle East and Africa
- 15. South America Nuclear Power Plant Equipment Market Analysis, Insights and Forecast, 2019-2031
- 15.1. Market Analysis, Insights and Forecast - By Country/Sub-region
- 15.1.1 Brazil
- 15.1.2 Argentina
- 15.1.3 Rest of South America
- 16. Competitive Analysis
- 16.1. Global Market Share Analysis 2024
- 16.2. Company Profiles
- 16.2.1 GE-Hitachi Nuclear Energy
- 16.2.1.1. Overview
- 16.2.1.2. Products
- 16.2.1.3. SWOT Analysis
- 16.2.1.4. Recent Developments
- 16.2.1.5. Financials (Based on Availability)
- 16.2.2 Larsen & Toubro Ltd
- 16.2.2.1. Overview
- 16.2.2.2. Products
- 16.2.2.3. SWOT Analysis
- 16.2.2.4. Recent Developments
- 16.2.2.5. Financials (Based on Availability)
- 16.2.3 JSC AEM-technology
- 16.2.3.1. Overview
- 16.2.3.2. Products
- 16.2.3.3. SWOT Analysis
- 16.2.3.4. Recent Developments
- 16.2.3.5. Financials (Based on Availability)
- 16.2.4 Dongfang Electric Corp Limited
- 16.2.4.1. Overview
- 16.2.4.2. Products
- 16.2.4.3. SWOT Analysis
- 16.2.4.4. Recent Developments
- 16.2.4.5. Financials (Based on Availability)
- 16.2.5 Doosan Corporation
- 16.2.5.1. Overview
- 16.2.5.2. Products
- 16.2.5.3. SWOT Analysis
- 16.2.5.4. Recent Developments
- 16.2.5.5. Financials (Based on Availability)
- 16.2.6 Babcock & Wilcox Company
- 16.2.6.1. Overview
- 16.2.6.2. Products
- 16.2.6.3. SWOT Analysis
- 16.2.6.4. Recent Developments
- 16.2.6.5. Financials (Based on Availability)
- 16.2.7 Areva SA
- 16.2.7.1. Overview
- 16.2.7.2. Products
- 16.2.7.3. SWOT Analysis
- 16.2.7.4. Recent Developments
- 16.2.7.5. Financials (Based on Availability)
- 16.2.8 Korea Electric Power Corporation (KEPCO)
- 16.2.8.1. Overview
- 16.2.8.2. Products
- 16.2.8.3. SWOT Analysis
- 16.2.8.4. Recent Developments
- 16.2.8.5. Financials (Based on Availability)
- 16.2.9 Westinghouse Electric Company LLC
- 16.2.9.1. Overview
- 16.2.9.2. Products
- 16.2.9.3. SWOT Analysis
- 16.2.9.4. Recent Developments
- 16.2.9.5. Financials (Based on Availability)
- 16.2.10 JSC ATOMSTROYEXPORT
- 16.2.10.1. Overview
- 16.2.10.2. Products
- 16.2.10.3. SWOT Analysis
- 16.2.10.4. Recent Developments
- 16.2.10.5. Financials (Based on Availability)
- 16.2.11 Mitsubishi Heavy Industries Ltd
- 16.2.11.1. Overview
- 16.2.11.2. Products
- 16.2.11.3. SWOT Analysis
- 16.2.11.4. Recent Developments
- 16.2.11.5. Financials (Based on Availability)
- 16.2.1 GE-Hitachi Nuclear Energy
List of Figures
- Figure 1: Global Nuclear Power Plant Equipment Market Revenue Breakdown (Million, %) by Region 2024 & 2032
- Figure 2: Global Nuclear Power Plant Equipment Market Volume Breakdown (K Units, %) by Region 2024 & 2032
- Figure 3: North America Nuclear Power Plant Equipment Market Revenue (Million), by Country 2024 & 2032
- Figure 4: North America Nuclear Power Plant Equipment Market Volume (K Units), by Country 2024 & 2032
- Figure 5: North America Nuclear Power Plant Equipment Market Revenue Share (%), by Country 2024 & 2032
- Figure 6: North America Nuclear Power Plant Equipment Market Volume Share (%), by Country 2024 & 2032
- Figure 7: Asia Pacific Nuclear Power Plant Equipment Market Revenue (Million), by Country 2024 & 2032
- Figure 8: Asia Pacific Nuclear Power Plant Equipment Market Volume (K Units), by Country 2024 & 2032
- Figure 9: Asia Pacific Nuclear Power Plant Equipment Market Revenue Share (%), by Country 2024 & 2032
- Figure 10: Asia Pacific Nuclear Power Plant Equipment Market Volume Share (%), by Country 2024 & 2032
- Figure 11: Europe Nuclear Power Plant Equipment Market Revenue (Million), by Country 2024 & 2032
- Figure 12: Europe Nuclear Power Plant Equipment Market Volume (K Units), by Country 2024 & 2032
- Figure 13: Europe Nuclear Power Plant Equipment Market Revenue Share (%), by Country 2024 & 2032
- Figure 14: Europe Nuclear Power Plant Equipment Market Volume Share (%), by Country 2024 & 2032
- Figure 15: Middle East and Africa Nuclear Power Plant Equipment Market Revenue (Million), by Country 2024 & 2032
- Figure 16: Middle East and Africa Nuclear Power Plant Equipment Market Volume (K Units), by Country 2024 & 2032
- Figure 17: Middle East and Africa Nuclear Power Plant Equipment Market Revenue Share (%), by Country 2024 & 2032
- Figure 18: Middle East and Africa Nuclear Power Plant Equipment Market Volume Share (%), by Country 2024 & 2032
- Figure 19: South America Nuclear Power Plant Equipment Market Revenue (Million), by Country 2024 & 2032
- Figure 20: South America Nuclear Power Plant Equipment Market Volume (K Units), by Country 2024 & 2032
- Figure 21: South America Nuclear Power Plant Equipment Market Revenue Share (%), by Country 2024 & 2032
- Figure 22: South America Nuclear Power Plant Equipment Market Volume Share (%), by Country 2024 & 2032
- Figure 23: North America Nuclear Power Plant Equipment Market Revenue (Million), by Product Type 2024 & 2032
- Figure 24: North America Nuclear Power Plant Equipment Market Volume (K Units), by Product Type 2024 & 2032
- Figure 25: North America Nuclear Power Plant Equipment Market Revenue Share (%), by Product Type 2024 & 2032
- Figure 26: North America Nuclear Power Plant Equipment Market Volume Share (%), by Product Type 2024 & 2032
- Figure 27: North America Nuclear Power Plant Equipment Market Revenue (Million), by Carrier Type 2024 & 2032
- Figure 28: North America Nuclear Power Plant Equipment Market Volume (K Units), by Carrier Type 2024 & 2032
- Figure 29: North America Nuclear Power Plant Equipment Market Revenue Share (%), by Carrier Type 2024 & 2032
- Figure 30: North America Nuclear Power Plant Equipment Market Volume Share (%), by Carrier Type 2024 & 2032
- Figure 31: North America Nuclear Power Plant Equipment Market Revenue (Million), by Country 2024 & 2032
- Figure 32: North America Nuclear Power Plant Equipment Market Volume (K Units), by Country 2024 & 2032
- Figure 33: North America Nuclear Power Plant Equipment Market Revenue Share (%), by Country 2024 & 2032
- Figure 34: North America Nuclear Power Plant Equipment Market Volume Share (%), by Country 2024 & 2032
- Figure 35: Asia Pacific Nuclear Power Plant Equipment Market Revenue (Million), by Product Type 2024 & 2032
- Figure 36: Asia Pacific Nuclear Power Plant Equipment Market Volume (K Units), by Product Type 2024 & 2032
- Figure 37: Asia Pacific Nuclear Power Plant Equipment Market Revenue Share (%), by Product Type 2024 & 2032
- Figure 38: Asia Pacific Nuclear Power Plant Equipment Market Volume Share (%), by Product Type 2024 & 2032
- Figure 39: Asia Pacific Nuclear Power Plant Equipment Market Revenue (Million), by Carrier Type 2024 & 2032
- Figure 40: Asia Pacific Nuclear Power Plant Equipment Market Volume (K Units), by Carrier Type 2024 & 2032
- Figure 41: Asia Pacific Nuclear Power Plant Equipment Market Revenue Share (%), by Carrier Type 2024 & 2032
- Figure 42: Asia Pacific Nuclear Power Plant Equipment Market Volume Share (%), by Carrier Type 2024 & 2032
- Figure 43: Asia Pacific Nuclear Power Plant Equipment Market Revenue (Million), by Country 2024 & 2032
- Figure 44: Asia Pacific Nuclear Power Plant Equipment Market Volume (K Units), by Country 2024 & 2032
- Figure 45: Asia Pacific Nuclear Power Plant Equipment Market Revenue Share (%), by Country 2024 & 2032
- Figure 46: Asia Pacific Nuclear Power Plant Equipment Market Volume Share (%), by Country 2024 & 2032
- Figure 47: Europe Nuclear Power Plant Equipment Market Revenue (Million), by Product Type 2024 & 2032
- Figure 48: Europe Nuclear Power Plant Equipment Market Volume (K Units), by Product Type 2024 & 2032
- Figure 49: Europe Nuclear Power Plant Equipment Market Revenue Share (%), by Product Type 2024 & 2032
- Figure 50: Europe Nuclear Power Plant Equipment Market Volume Share (%), by Product Type 2024 & 2032
- Figure 51: Europe Nuclear Power Plant Equipment Market Revenue (Million), by Carrier Type 2024 & 2032
- Figure 52: Europe Nuclear Power Plant Equipment Market Volume (K Units), by Carrier Type 2024 & 2032
- Figure 53: Europe Nuclear Power Plant Equipment Market Revenue Share (%), by Carrier Type 2024 & 2032
- Figure 54: Europe Nuclear Power Plant Equipment Market Volume Share (%), by Carrier Type 2024 & 2032
- Figure 55: Europe Nuclear Power Plant Equipment Market Revenue (Million), by Country 2024 & 2032
- Figure 56: Europe Nuclear Power Plant Equipment Market Volume (K Units), by Country 2024 & 2032
- Figure 57: Europe Nuclear Power Plant Equipment Market Revenue Share (%), by Country 2024 & 2032
- Figure 58: Europe Nuclear Power Plant Equipment Market Volume Share (%), by Country 2024 & 2032
- Figure 59: Middle East and Africa Nuclear Power Plant Equipment Market Revenue (Million), by Product Type 2024 & 2032
- Figure 60: Middle East and Africa Nuclear Power Plant Equipment Market Volume (K Units), by Product Type 2024 & 2032
- Figure 61: Middle East and Africa Nuclear Power Plant Equipment Market Revenue Share (%), by Product Type 2024 & 2032
- Figure 62: Middle East and Africa Nuclear Power Plant Equipment Market Volume Share (%), by Product Type 2024 & 2032
- Figure 63: Middle East and Africa Nuclear Power Plant Equipment Market Revenue (Million), by Carrier Type 2024 & 2032
- Figure 64: Middle East and Africa Nuclear Power Plant Equipment Market Volume (K Units), by Carrier Type 2024 & 2032
- Figure 65: Middle East and Africa Nuclear Power Plant Equipment Market Revenue Share (%), by Carrier Type 2024 & 2032
- Figure 66: Middle East and Africa Nuclear Power Plant Equipment Market Volume Share (%), by Carrier Type 2024 & 2032
- Figure 67: Middle East and Africa Nuclear Power Plant Equipment Market Revenue (Million), by Country 2024 & 2032
- Figure 68: Middle East and Africa Nuclear Power Plant Equipment Market Volume (K Units), by Country 2024 & 2032
- Figure 69: Middle East and Africa Nuclear Power Plant Equipment Market Revenue Share (%), by Country 2024 & 2032
- Figure 70: Middle East and Africa Nuclear Power Plant Equipment Market Volume Share (%), by Country 2024 & 2032
- Figure 71: South America Nuclear Power Plant Equipment Market Revenue (Million), by Product Type 2024 & 2032
- Figure 72: South America Nuclear Power Plant Equipment Market Volume (K Units), by Product Type 2024 & 2032
- Figure 73: South America Nuclear Power Plant Equipment Market Revenue Share (%), by Product Type 2024 & 2032
- Figure 74: South America Nuclear Power Plant Equipment Market Volume Share (%), by Product Type 2024 & 2032
- Figure 75: South America Nuclear Power Plant Equipment Market Revenue (Million), by Carrier Type 2024 & 2032
- Figure 76: South America Nuclear Power Plant Equipment Market Volume (K Units), by Carrier Type 2024 & 2032
- Figure 77: South America Nuclear Power Plant Equipment Market Revenue Share (%), by Carrier Type 2024 & 2032
- Figure 78: South America Nuclear Power Plant Equipment Market Volume Share (%), by Carrier Type 2024 & 2032
- Figure 79: South America Nuclear Power Plant Equipment Market Revenue (Million), by Country 2024 & 2032
- Figure 80: South America Nuclear Power Plant Equipment Market Volume (K Units), by Country 2024 & 2032
- Figure 81: South America Nuclear Power Plant Equipment Market Revenue Share (%), by Country 2024 & 2032
- Figure 82: South America Nuclear Power Plant Equipment Market Volume Share (%), by Country 2024 & 2032
List of Tables
- Table 1: Global Nuclear Power Plant Equipment Market Revenue Million Forecast, by Region 2019 & 2032
- Table 2: Global Nuclear Power Plant Equipment Market Volume K Units Forecast, by Region 2019 & 2032
- Table 3: Global Nuclear Power Plant Equipment Market Revenue Million Forecast, by Product Type 2019 & 2032
- Table 4: Global Nuclear Power Plant Equipment Market Volume K Units Forecast, by Product Type 2019 & 2032
- Table 5: Global Nuclear Power Plant Equipment Market Revenue Million Forecast, by Carrier Type 2019 & 2032
- Table 6: Global Nuclear Power Plant Equipment Market Volume K Units Forecast, by Carrier Type 2019 & 2032
- Table 7: Global Nuclear Power Plant Equipment Market Revenue Million Forecast, by Region 2019 & 2032
- Table 8: Global Nuclear Power Plant Equipment Market Volume K Units Forecast, by Region 2019 & 2032
- Table 9: Global Nuclear Power Plant Equipment Market Revenue Million Forecast, by Country 2019 & 2032
- Table 10: Global Nuclear Power Plant Equipment Market Volume K Units Forecast, by Country 2019 & 2032
- Table 11: United States Nuclear Power Plant Equipment Market Revenue (Million) Forecast, by Application 2019 & 2032
- Table 12: United States Nuclear Power Plant Equipment Market Volume (K Units) Forecast, by Application 2019 & 2032
- Table 13: Canada Nuclear Power Plant Equipment Market Revenue (Million) Forecast, by Application 2019 & 2032
- Table 14: Canada Nuclear Power Plant Equipment Market Volume (K Units) Forecast, by Application 2019 & 2032
- Table 15: Rest of North America Nuclear Power Plant Equipment Market Revenue (Million) Forecast, by Application 2019 & 2032
- Table 16: Rest of North America Nuclear Power Plant Equipment Market Volume (K Units) Forecast, by Application 2019 & 2032
- Table 17: Global Nuclear Power Plant Equipment Market Revenue Million Forecast, by Country 2019 & 2032
- Table 18: Global Nuclear Power Plant Equipment Market Volume K Units Forecast, by Country 2019 & 2032
- Table 19: China Nuclear Power Plant Equipment Market Revenue (Million) Forecast, by Application 2019 & 2032
- Table 20: China Nuclear Power Plant Equipment Market Volume (K Units) Forecast, by Application 2019 & 2032
- Table 21: India Nuclear Power Plant Equipment Market Revenue (Million) Forecast, by Application 2019 & 2032
- Table 22: India Nuclear Power Plant Equipment Market Volume (K Units) Forecast, by Application 2019 & 2032
- Table 23: Japan Nuclear Power Plant Equipment Market Revenue (Million) Forecast, by Application 2019 & 2032
- Table 24: Japan Nuclear Power Plant Equipment Market Volume (K Units) Forecast, by Application 2019 & 2032
- Table 25: South Korea Nuclear Power Plant Equipment Market Revenue (Million) Forecast, by Application 2019 & 2032
- Table 26: South Korea Nuclear Power Plant Equipment Market Volume (K Units) Forecast, by Application 2019 & 2032
- Table 27: Rest of Asia Pacific Nuclear Power Plant Equipment Market Revenue (Million) Forecast, by Application 2019 & 2032
- Table 28: Rest of Asia Pacific Nuclear Power Plant Equipment Market Volume (K Units) Forecast, by Application 2019 & 2032
- Table 29: Global Nuclear Power Plant Equipment Market Revenue Million Forecast, by Country 2019 & 2032
- Table 30: Global Nuclear Power Plant Equipment Market Volume K Units Forecast, by Country 2019 & 2032
- Table 31: Germany Nuclear Power Plant Equipment Market Revenue (Million) Forecast, by Application 2019 & 2032
- Table 32: Germany Nuclear Power Plant Equipment Market Volume (K Units) Forecast, by Application 2019 & 2032
- Table 33: United Kingdom Nuclear Power Plant Equipment Market Revenue (Million) Forecast, by Application 2019 & 2032
- Table 34: United Kingdom Nuclear Power Plant Equipment Market Volume (K Units) Forecast, by Application 2019 & 2032
- Table 35: Russia Nuclear Power Plant Equipment Market Revenue (Million) Forecast, by Application 2019 & 2032
- Table 36: Russia Nuclear Power Plant Equipment Market Volume (K Units) Forecast, by Application 2019 & 2032
- Table 37: France Nuclear Power Plant Equipment Market Revenue (Million) Forecast, by Application 2019 & 2032
- Table 38: France Nuclear Power Plant Equipment Market Volume (K Units) Forecast, by Application 2019 & 2032
- Table 39: Rest of Europe Nuclear Power Plant Equipment Market Revenue (Million) Forecast, by Application 2019 & 2032
- Table 40: Rest of Europe Nuclear Power Plant Equipment Market Volume (K Units) Forecast, by Application 2019 & 2032
- Table 41: Global Nuclear Power Plant Equipment Market Revenue Million Forecast, by Country 2019 & 2032
- Table 42: Global Nuclear Power Plant Equipment Market Volume K Units Forecast, by Country 2019 & 2032
- Table 43: United Arab Emirates Nuclear Power Plant Equipment Market Revenue (Million) Forecast, by Application 2019 & 2032
- Table 44: United Arab Emirates Nuclear Power Plant Equipment Market Volume (K Units) Forecast, by Application 2019 & 2032
- Table 45: Saudi Arabia Nuclear Power Plant Equipment Market Revenue (Million) Forecast, by Application 2019 & 2032
- Table 46: Saudi Arabia Nuclear Power Plant Equipment Market Volume (K Units) Forecast, by Application 2019 & 2032
- Table 47: South Africa Nuclear Power Plant Equipment Market Revenue (Million) Forecast, by Application 2019 & 2032
- Table 48: South Africa Nuclear Power Plant Equipment Market Volume (K Units) Forecast, by Application 2019 & 2032
- Table 49: Iran Nuclear Power Plant Equipment Market Revenue (Million) Forecast, by Application 2019 & 2032
- Table 50: Iran Nuclear Power Plant Equipment Market Volume (K Units) Forecast, by Application 2019 & 2032
- Table 51: Rest of Middle East and Africa Nuclear Power Plant Equipment Market Revenue (Million) Forecast, by Application 2019 & 2032
- Table 52: Rest of Middle East and Africa Nuclear Power Plant Equipment Market Volume (K Units) Forecast, by Application 2019 & 2032
- Table 53: Global Nuclear Power Plant Equipment Market Revenue Million Forecast, by Country 2019 & 2032
- Table 54: Global Nuclear Power Plant Equipment Market Volume K Units Forecast, by Country 2019 & 2032
- Table 55: Brazil Nuclear Power Plant Equipment Market Revenue (Million) Forecast, by Application 2019 & 2032
- Table 56: Brazil Nuclear Power Plant Equipment Market Volume (K Units) Forecast, by Application 2019 & 2032
- Table 57: Argentina Nuclear Power Plant Equipment Market Revenue (Million) Forecast, by Application 2019 & 2032
- Table 58: Argentina Nuclear Power Plant Equipment Market Volume (K Units) Forecast, by Application 2019 & 2032
- Table 59: Rest of South America Nuclear Power Plant Equipment Market Revenue (Million) Forecast, by Application 2019 & 2032
- Table 60: Rest of South America Nuclear Power Plant Equipment Market Volume (K Units) Forecast, by Application 2019 & 2032
- Table 61: Global Nuclear Power Plant Equipment Market Revenue Million Forecast, by Product Type 2019 & 2032
- Table 62: Global Nuclear Power Plant Equipment Market Volume K Units Forecast, by Product Type 2019 & 2032
- Table 63: Global Nuclear Power Plant Equipment Market Revenue Million Forecast, by Carrier Type 2019 & 2032
- Table 64: Global Nuclear Power Plant Equipment Market Volume K Units Forecast, by Carrier Type 2019 & 2032
- Table 65: Global Nuclear Power Plant Equipment Market Revenue Million Forecast, by Country 2019 & 2032
- Table 66: Global Nuclear Power Plant Equipment Market Volume K Units Forecast, by Country 2019 & 2032
- Table 67: United States Nuclear Power Plant Equipment Market Revenue (Million) Forecast, by Application 2019 & 2032
- Table 68: United States Nuclear Power Plant Equipment Market Volume (K Units) Forecast, by Application 2019 & 2032
- Table 69: Canada Nuclear Power Plant Equipment Market Revenue (Million) Forecast, by Application 2019 & 2032
- Table 70: Canada Nuclear Power Plant Equipment Market Volume (K Units) Forecast, by Application 2019 & 2032
- Table 71: Rest of North America Nuclear Power Plant Equipment Market Revenue (Million) Forecast, by Application 2019 & 2032
- Table 72: Rest of North America Nuclear Power Plant Equipment Market Volume (K Units) Forecast, by Application 2019 & 2032
- Table 73: Global Nuclear Power Plant Equipment Market Revenue Million Forecast, by Product Type 2019 & 2032
- Table 74: Global Nuclear Power Plant Equipment Market Volume K Units Forecast, by Product Type 2019 & 2032
- Table 75: Global Nuclear Power Plant Equipment Market Revenue Million Forecast, by Carrier Type 2019 & 2032
- Table 76: Global Nuclear Power Plant Equipment Market Volume K Units Forecast, by Carrier Type 2019 & 2032
- Table 77: Global Nuclear Power Plant Equipment Market Revenue Million Forecast, by Country 2019 & 2032
- Table 78: Global Nuclear Power Plant Equipment Market Volume K Units Forecast, by Country 2019 & 2032
- Table 79: China Nuclear Power Plant Equipment Market Revenue (Million) Forecast, by Application 2019 & 2032
- Table 80: China Nuclear Power Plant Equipment Market Volume (K Units) Forecast, by Application 2019 & 2032
- Table 81: India Nuclear Power Plant Equipment Market Revenue (Million) Forecast, by Application 2019 & 2032
- Table 82: India Nuclear Power Plant Equipment Market Volume (K Units) Forecast, by Application 2019 & 2032
- Table 83: Japan Nuclear Power Plant Equipment Market Revenue (Million) Forecast, by Application 2019 & 2032
- Table 84: Japan Nuclear Power Plant Equipment Market Volume (K Units) Forecast, by Application 2019 & 2032
- Table 85: South Korea Nuclear Power Plant Equipment Market Revenue (Million) Forecast, by Application 2019 & 2032
- Table 86: South Korea Nuclear Power Plant Equipment Market Volume (K Units) Forecast, by Application 2019 & 2032
- Table 87: Rest of Asia Pacific Nuclear Power Plant Equipment Market Revenue (Million) Forecast, by Application 2019 & 2032
- Table 88: Rest of Asia Pacific Nuclear Power Plant Equipment Market Volume (K Units) Forecast, by Application 2019 & 2032
- Table 89: Global Nuclear Power Plant Equipment Market Revenue Million Forecast, by Product Type 2019 & 2032
- Table 90: Global Nuclear Power Plant Equipment Market Volume K Units Forecast, by Product Type 2019 & 2032
- Table 91: Global Nuclear Power Plant Equipment Market Revenue Million Forecast, by Carrier Type 2019 & 2032
- Table 92: Global Nuclear Power Plant Equipment Market Volume K Units Forecast, by Carrier Type 2019 & 2032
- Table 93: Global Nuclear Power Plant Equipment Market Revenue Million Forecast, by Country 2019 & 2032
- Table 94: Global Nuclear Power Plant Equipment Market Volume K Units Forecast, by Country 2019 & 2032
- Table 95: Germany Nuclear Power Plant Equipment Market Revenue (Million) Forecast, by Application 2019 & 2032
- Table 96: Germany Nuclear Power Plant Equipment Market Volume (K Units) Forecast, by Application 2019 & 2032
- Table 97: United Kingdom Nuclear Power Plant Equipment Market Revenue (Million) Forecast, by Application 2019 & 2032
- Table 98: United Kingdom Nuclear Power Plant Equipment Market Volume (K Units) Forecast, by Application 2019 & 2032
- Table 99: Russia Nuclear Power Plant Equipment Market Revenue (Million) Forecast, by Application 2019 & 2032
- Table 100: Russia Nuclear Power Plant Equipment Market Volume (K Units) Forecast, by Application 2019 & 2032
- Table 101: France Nuclear Power Plant Equipment Market Revenue (Million) Forecast, by Application 2019 & 2032
- Table 102: France Nuclear Power Plant Equipment Market Volume (K Units) Forecast, by Application 2019 & 2032
- Table 103: Rest of Europe Nuclear Power Plant Equipment Market Revenue (Million) Forecast, by Application 2019 & 2032
- Table 104: Rest of Europe Nuclear Power Plant Equipment Market Volume (K Units) Forecast, by Application 2019 & 2032
- Table 105: Global Nuclear Power Plant Equipment Market Revenue Million Forecast, by Product Type 2019 & 2032
- Table 106: Global Nuclear Power Plant Equipment Market Volume K Units Forecast, by Product Type 2019 & 2032
- Table 107: Global Nuclear Power Plant Equipment Market Revenue Million Forecast, by Carrier Type 2019 & 2032
- Table 108: Global Nuclear Power Plant Equipment Market Volume K Units Forecast, by Carrier Type 2019 & 2032
- Table 109: Global Nuclear Power Plant Equipment Market Revenue Million Forecast, by Country 2019 & 2032
- Table 110: Global Nuclear Power Plant Equipment Market Volume K Units Forecast, by Country 2019 & 2032
- Table 111: United Arab Emirates Nuclear Power Plant Equipment Market Revenue (Million) Forecast, by Application 2019 & 2032
- Table 112: United Arab Emirates Nuclear Power Plant Equipment Market Volume (K Units) Forecast, by Application 2019 & 2032
- Table 113: Saudi Arabia Nuclear Power Plant Equipment Market Revenue (Million) Forecast, by Application 2019 & 2032
- Table 114: Saudi Arabia Nuclear Power Plant Equipment Market Volume (K Units) Forecast, by Application 2019 & 2032
- Table 115: South Africa Nuclear Power Plant Equipment Market Revenue (Million) Forecast, by Application 2019 & 2032
- Table 116: South Africa Nuclear Power Plant Equipment Market Volume (K Units) Forecast, by Application 2019 & 2032
- Table 117: Iran Nuclear Power Plant Equipment Market Revenue (Million) Forecast, by Application 2019 & 2032
- Table 118: Iran Nuclear Power Plant Equipment Market Volume (K Units) Forecast, by Application 2019 & 2032
- Table 119: Rest of Middle East and Africa Nuclear Power Plant Equipment Market Revenue (Million) Forecast, by Application 2019 & 2032
- Table 120: Rest of Middle East and Africa Nuclear Power Plant Equipment Market Volume (K Units) Forecast, by Application 2019 & 2032
- Table 121: Global Nuclear Power Plant Equipment Market Revenue Million Forecast, by Product Type 2019 & 2032
- Table 122: Global Nuclear Power Plant Equipment Market Volume K Units Forecast, by Product Type 2019 & 2032
- Table 123: Global Nuclear Power Plant Equipment Market Revenue Million Forecast, by Carrier Type 2019 & 2032
- Table 124: Global Nuclear Power Plant Equipment Market Volume K Units Forecast, by Carrier Type 2019 & 2032
- Table 125: Global Nuclear Power Plant Equipment Market Revenue Million Forecast, by Country 2019 & 2032
- Table 126: Global Nuclear Power Plant Equipment Market Volume K Units Forecast, by Country 2019 & 2032
- Table 127: Brazil Nuclear Power Plant Equipment Market Revenue (Million) Forecast, by Application 2019 & 2032
- Table 128: Brazil Nuclear Power Plant Equipment Market Volume (K Units) Forecast, by Application 2019 & 2032
- Table 129: Argentina Nuclear Power Plant Equipment Market Revenue (Million) Forecast, by Application 2019 & 2032
- Table 130: Argentina Nuclear Power Plant Equipment Market Volume (K Units) Forecast, by Application 2019 & 2032
- Table 131: Rest of South America Nuclear Power Plant Equipment Market Revenue (Million) Forecast, by Application 2019 & 2032
- Table 132: Rest of South America Nuclear Power Plant Equipment Market Volume (K Units) Forecast, by Application 2019 & 2032
Frequently Asked Questions
1. What is the projected Compound Annual Growth Rate (CAGR) of the Nuclear Power Plant Equipment Market?
The projected CAGR is approximately > 6.90%.
2. Which companies are prominent players in the Nuclear Power Plant Equipment Market?
Key companies in the market include GE-Hitachi Nuclear Energy, Larsen & Toubro Ltd, JSC AEM-technology, Dongfang Electric Corp Limited, Doosan Corporation, Babcock & Wilcox Company, Areva SA, Korea Electric Power Corporation (KEPCO), Westinghouse Electric Company LLC, JSC ATOMSTROYEXPORT, Mitsubishi Heavy Industries Ltd.
3. What are the main segments of the Nuclear Power Plant Equipment Market?
The market segments include Product Type, Carrier Type.
4. Can you provide details about the market size?
The market size is estimated to be USD XX Million as of 2022.
5. What are some drivers contributing to market growth?
4.; Growing Vehicle Ownership4.; Government Initiatives.
6. What are the notable trends driving market growth?
Pressurized Water Reactor to Dominate the Market.
7. Are there any restraints impacting market growth?
4.; Volatile Crude Oil Prices.
8. Can you provide examples of recent developments in the market?
In May 2020, Russia's Atommash shipped the first components for the Turkish Akkuyu nuclear power plant, which was being built by the state nuclear corporation Rosatom. Rosatom said it stepped up the training of staff for the Akkuyu project, and it is carrying out the exercise in conjunction with a nuclear utility, Rosenergoatom.
9. What pricing options are available for accessing the report?
Pricing options include single-user, multi-user, and enterprise licenses priced at USD 4750, USD 5250, and USD 8750 respectively.
10. Is the market size provided in terms of value or volume?
The market size is provided in terms of value, measured in Million and volume, measured in K Units.
11. Are there any specific market keywords associated with the report?
Yes, the market keyword associated with the report is "Nuclear Power Plant Equipment Market," which aids in identifying and referencing the specific market segment covered.
12. How do I determine which pricing option suits my needs best?
The pricing options vary based on user requirements and access needs. Individual users may opt for single-user licenses, while businesses requiring broader access may choose multi-user or enterprise licenses for cost-effective access to the report.
13. Are there any additional resources or data provided in the Nuclear Power Plant Equipment Market report?
While the report offers comprehensive insights, it's advisable to review the specific contents or supplementary materials provided to ascertain if additional resources or data are available.
14. How can I stay updated on further developments or reports in the Nuclear Power Plant Equipment Market?
To stay informed about further developments, trends, and reports in the Nuclear Power Plant Equipment Market, consider subscribing to industry newsletters, following relevant companies and organizations, or regularly checking reputable industry news sources and publications.
Methodology
Step 1 - Identification of Relevant Samples Size from Population Database


Step 2 - Approaches for Defining Global Market Size (Value, Volume* & Price*)

Note*: In applicable scenarios
Step 3 - Data Sources
Primary Research
- Web Analytics
- Survey Reports
- Research Institute
- Latest Research Reports
- Opinion Leaders
Secondary Research
- Annual Reports
- White Paper
- Latest Press Release
- Industry Association
- Paid Database
- Investor Presentations

Step 4 - Data Triangulation
Involves using different sources of information in order to increase the validity of a study
These sources are likely to be stakeholders in a program - participants, other researchers, program staff, other community members, and so on.
Then we put all data in single framework & apply various statistical tools to find out the dynamic on the market.
During the analysis stage, feedback from the stakeholder groups would be compared to determine areas of agreement as well as areas of divergence


