

Key Insights
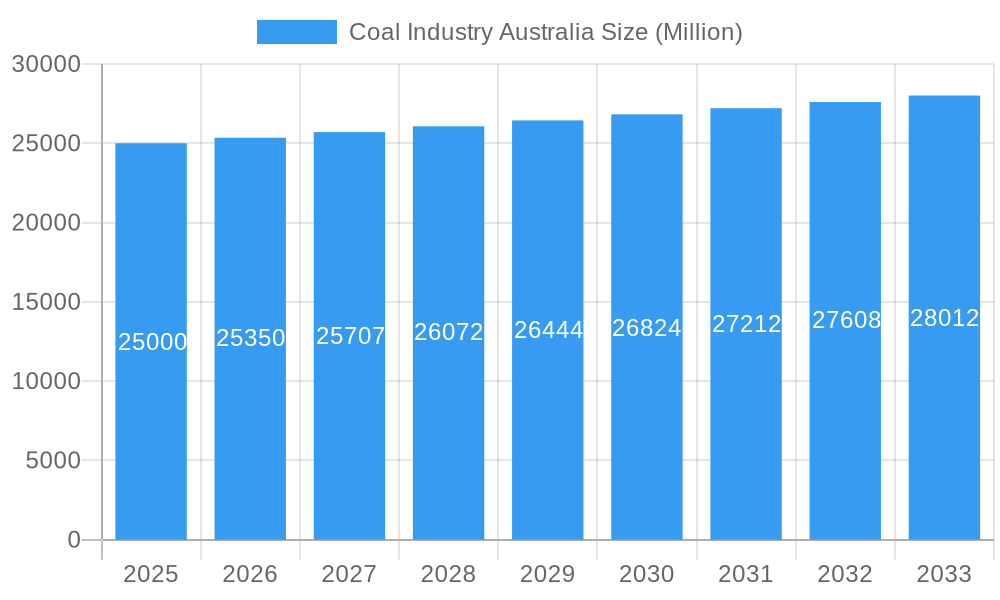
Australia's coal sector, a vital energy supplier in the Asia-Pacific, demonstrates resilience amidst global decarbonization trends. The market, projected at $57 billion in 2024, anticipates a Compound Annual Growth Rate (CAGR) of 2.2% through 2033. This expansion is fueled by robust demand for thermal and coking coal from key Asian markets, essential for power generation and steel production respectively. Growth in developing Asian economies continues to underpin demand, despite environmental considerations. Significant challenges include emission reduction mandates, stringent environmental policies, and fluctuating energy prices. Thermal coal dominates market segmentation for power, followed by coking coal for steel and industrial uses. Major contributors include Peabody Energy Corporation, Yancoal Australia Ltd, and Whitehaven Coal Limited, alongside numerous smaller enterprises. China, Japan, India, and South Korea represent the primary export destinations.
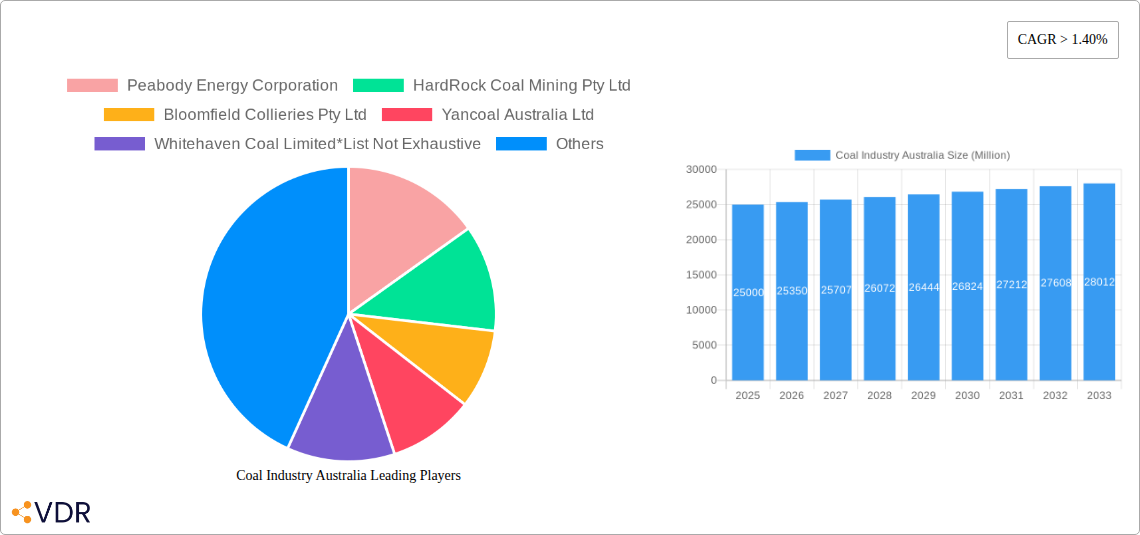
Coal Industry Australia Market Size (In Billion)
The Australian coal industry's future is nuanced. A sustained global shift towards renewables and carbon emission reduction commitments present long-term uncertainties. These pressures may moderate growth from 2030 to 2033, potentially leading to slower expansion or a decline, contingent on the speed of global energy transition. Industry success will depend on adapting to regulatory changes, adopting cleaner technologies, and pursuing diversification to counter climate policy and market volatility. Companies prioritizing operational efficiency, sustainable mining, and environmental stewardship are poised for sustained success. Geographic concentrations in Queensland and New South Wales offer both advantages and complexities in infrastructure, resource management, and community relations.
Coal Industry Australia Company Market Share
Coal Industry Australia: Market Dynamics, Growth, and Outlook 2019-2033
This comprehensive report provides an in-depth analysis of the Australian coal industry, encompassing market dynamics, growth trends, key players, and future outlook. Focusing on the parent market of energy resources and the child market of coal mining, this report delivers critical insights for industry professionals, investors, and policymakers. The study period covers 2019-2033, with a base year of 2025 and a forecast period of 2025-2033. Market values are presented in millions of Australian dollars (AUD).
Coal Industry Australia Market Dynamics & Structure
This section analyzes the competitive landscape, technological advancements, regulatory environment, and market trends within the Australian coal industry. Market concentration is high, with a few major players dominating production. Technological innovation focuses primarily on improving efficiency and reducing environmental impact. Stringent environmental regulations significantly influence operational costs and investment decisions. Substitute energy sources, such as renewables, pose a growing challenge. The end-user demographics are predominantly power generation and steelmaking sectors. M&A activity has been moderate, with consolidation primarily among smaller players.
- Market Concentration: High, with the top 5 companies holding xx% market share in 2025 (estimated).
- Technological Innovation: Primarily focused on improving extraction efficiency and reducing greenhouse gas emissions.
- Regulatory Framework: Stringent environmental regulations are driving operational changes and investment in cleaner technologies.
- Competitive Substitutes: Renewable energy sources present a significant competitive challenge.
- End-User Demographics: Dominated by power generation (xx%) and steelmaking (xx%), with industrial applications accounting for the remaining xx%.
- M&A Trends: Moderate activity, mainly driven by consolidation among smaller players. xx M&A deals recorded between 2019-2024.
Coal Industry Australia Growth Trends & Insights
The Australian coal market experienced xx% CAGR during the historical period (2019-2024). This growth was primarily driven by strong demand from export markets, particularly in Asia. However, the forecast period (2025-2033) anticipates a slower growth rate of xx% CAGR, reflecting the increasing adoption of renewable energy and tightening environmental regulations. Technological disruptions, such as the increasing efficiency of renewable energy generation, are influencing consumer behaviour and market trends. Market penetration of coal in the power generation sector is expected to decline gradually.
Dominant Regions, Countries, or Segments in Coal Industry Australia
The leading segments in the Australian coal market are thermal coal and coking coal, driven by strong demand from the power generation and steelmaking industries. Queensland and New South Wales are the primary coal-producing states, benefiting from established infrastructure and abundant resources.
- By Coal Type: Thermal coal dominates the market share in terms of production and revenue at xx% in 2025, followed by coking coal at xx%. Semi-soft coking coal constitutes a smaller share of xx%.
- By End-Use: Power generation represents the largest end-use segment, accounting for xx% of total coal consumption in 2025, with steelmaking following at xx%. Industrial applications contribute xx%.
- Key Drivers: Existing infrastructure, established export markets, and continued demand from key industrial sectors.
Coal Industry Australia Product Landscape
The Australian coal industry's product landscape is characterized by varying coal types with different qualities suited to specific applications. Recent advancements focus on optimizing coal quality for specific end-use needs and enhancing extraction techniques to increase efficiency and reduce environmental impact. The unique selling propositions revolve around coal quality and reliability of supply. Technological advancements centre on automation in mining operations and improved logistics.
Key Drivers, Barriers & Challenges in Coal Industry Australia
Key Drivers: Strong export demand (especially from Asia), established infrastructure, and relatively low production costs (compared to some other regions).
Key Challenges: Increasingly stringent environmental regulations are raising production costs. The transition to renewable energy sources poses a long-term threat to market demand. Supply chain disruptions caused by extreme weather events or geopolitical factors could impact production and delivery. Competition from lower-cost producers in other countries presents an ongoing challenge.
Emerging Opportunities in Coal Industry Australia
Emerging opportunities include the development of advanced technologies for carbon capture and storage (CCS) to mitigate the environmental impact. The use of coal in industrial applications beyond power generation and steelmaking, such as in chemical production, could also offer new market avenues.
Growth Accelerators in the Coal Industry Australia Industry
Long-term growth will depend on the successful adoption of CCS technologies and maintaining competitiveness in the global market. Strategic partnerships with other energy companies to diversify energy portfolios and explore innovative applications of coal byproducts may play a crucial role.
Key Players Shaping the Coal Industry Australia Market
- Peabody Energy Corporation
- HardRock Coal Mining Pty Ltd
- Bloomfield Collieries Pty Ltd
- Yancoal Australia Ltd
- Whitehaven Coal Limited
- Idemitsu Australia Resources Pty Ltd
- Jellinbah Group Pty Ltd
- BHP Group Ltd
- Centennial Coal Company Ltd
- Vale S A
Notable Milestones in Coal Industry Australia Sector
- September 2022: AGL Energy announced the closure of its Loy Yang A coal-fired power station by 2035, signaling a shift away from coal-based power generation.
- October 2022: NSW Electricity Infrastructure awarded contracts for the design and replacement of four coal power stations, indicating a planned transition to alternative energy sources.
In-Depth Coal Industry Australia Market Outlook
The future of the Australian coal industry hinges on navigating the transition to a lower-carbon energy system. Opportunities lie in developing and adopting technologies that reduce the industry's environmental impact, while maintaining competitiveness through efficient production and strategic partnerships. The long-term outlook is challenging but opportunities exist for companies that adapt to changing market demands and regulatory pressures.
Coal Industry Australia Segmentation
- 1. Electricity
- 2. Iron and Steel
- 3. Other Applications
Coal Industry Australia Segmentation By Geography
-
1. North America
- 1.1. United States
- 1.2. Canada
- 1.3. Mexico
-
2. South America
- 2.1. Brazil
- 2.2. Argentina
- 2.3. Rest of South America
-
3. Europe
- 3.1. United Kingdom
- 3.2. Germany
- 3.3. France
- 3.4. Italy
- 3.5. Spain
- 3.6. Russia
- 3.7. Benelux
- 3.8. Nordics
- 3.9. Rest of Europe
-
4. Middle East & Africa
- 4.1. Turkey
- 4.2. Israel
- 4.3. GCC
- 4.4. North Africa
- 4.5. South Africa
- 4.6. Rest of Middle East & Africa
-
5. Asia Pacific
- 5.1. China
- 5.2. India
- 5.3. Japan
- 5.4. South Korea
- 5.5. ASEAN
- 5.6. Oceania
- 5.7. Rest of Asia Pacific
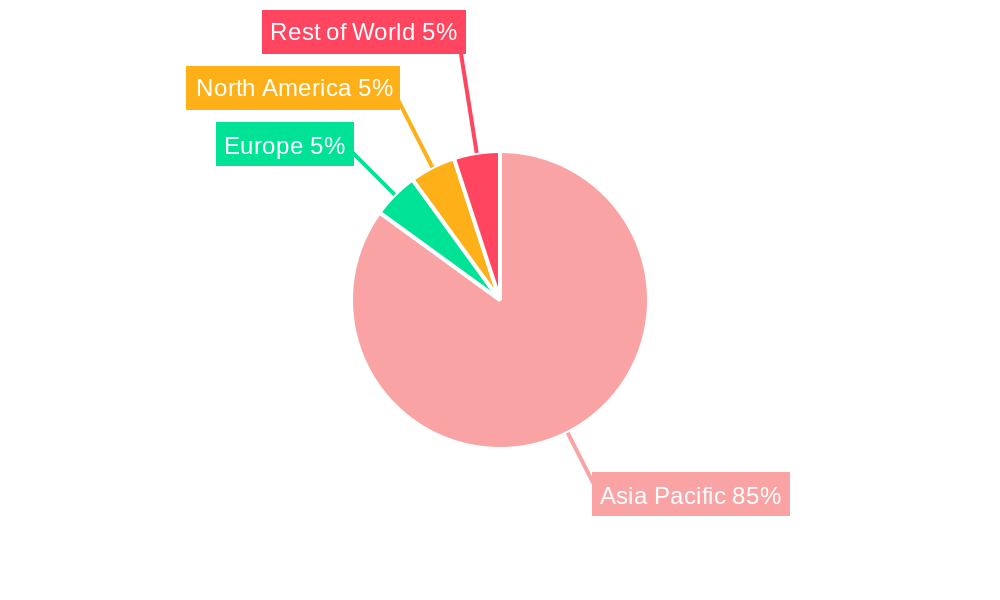
Coal Industry Australia Regional Market Share
Geographic Coverage of Coal Industry Australia
Coal Industry Australia REPORT HIGHLIGHTS
| Aspects | Details |
|---|---|
| Study Period | 2020-2034 |
| Base Year | 2025 |
| Estimated Year | 2026 |
| Forecast Period | 2026-2034 |
| Historical Period | 2020-2025 |
| Growth Rate | CAGR of 2.2% from 2020-2034 |
| Segmentation |
|
Table of Contents
- 1. Introduction
- 1.1. Research Scope
- 1.2. Market Segmentation
- 1.3. Research Objective
- 1.4. Definitions and Assumptions
- 2. Executive Summary
- 2.1. Market Snapshot
- 3. Market Dynamics
- 3.1. Market Drivers
- 3.2. Market Restrains
- 3.3. Market Trends
- 3.4. Market Opportunities
- 4. Market Factor Analysis
- 4.1. Porters Five Forces
- 4.1.1. Bargaining Power of Suppliers
- 4.1.2. Bargaining Power of Buyers
- 4.1.3. Threat of New Entrants
- 4.1.4. Threat of Substitutes
- 4.1.5. Competitive Rivalry
- 4.2. PESTEL analysis
- 4.3. BCG Analysis
- 4.3.1. Stars (High Growth, High Market Share)
- 4.3.2. Cash Cows (Low Growth, High Market Share)
- 4.3.3. Question Mark (High Growth, Low Market Share)
- 4.3.4. Dogs (Low Growth, Low Market Share)
- 4.4. Ansoff Matrix Analysis
- 4.5. Supply Chain Analysis
- 4.6. Regulatory Landscape
- 4.7. Current Market Potential and Opportunity Assessment (TAM–SAM–SOM Framework)
- 4.8. VDR Analyst Note
- 4.1. Porters Five Forces
- 5. Market Analysis, Insights and Forecast 2021-2033
- 5.1. Market Analysis, Insights and Forecast - by Electricity
- 5.2. Market Analysis, Insights and Forecast - by Iron and Steel
- 5.3. Market Analysis, Insights and Forecast - by Other Applications
- 5.4. Market Analysis, Insights and Forecast - by Region
- 5.4.1. North America
- 5.4.2. South America
- 5.4.3. Europe
- 5.4.4. Middle East & Africa
- 5.4.5. Asia Pacific
- 6. Global Coal Industry Australia Analysis, Insights and Forecast, 2021-2033
- 6.1. Market Analysis, Insights and Forecast - by Electricity
- 6.2. Market Analysis, Insights and Forecast - by Iron and Steel
- 6.3. Market Analysis, Insights and Forecast - by Other Applications
- 7. North America Coal Industry Australia Analysis, Insights and Forecast, 2021-2033
- 7.1. Market Analysis, Insights and Forecast - by Electricity
- 7.2. Market Analysis, Insights and Forecast - by Iron and Steel
- 7.3. Market Analysis, Insights and Forecast - by Other Applications
- 8. South America Coal Industry Australia Analysis, Insights and Forecast, 2021-2033
- 8.1. Market Analysis, Insights and Forecast - by Electricity
- 8.2. Market Analysis, Insights and Forecast - by Iron and Steel
- 8.3. Market Analysis, Insights and Forecast - by Other Applications
- 9. Europe Coal Industry Australia Analysis, Insights and Forecast, 2021-2033
- 9.1. Market Analysis, Insights and Forecast - by Electricity
- 9.2. Market Analysis, Insights and Forecast - by Iron and Steel
- 9.3. Market Analysis, Insights and Forecast - by Other Applications
- 10. Middle East & Africa Coal Industry Australia Analysis, Insights and Forecast, 2021-2033
- 10.1. Market Analysis, Insights and Forecast - by Electricity
- 10.2. Market Analysis, Insights and Forecast - by Iron and Steel
- 10.3. Market Analysis, Insights and Forecast - by Other Applications
- 11. Asia Pacific Coal Industry Australia Analysis, Insights and Forecast, 2021-2033
- 11.1. Market Analysis, Insights and Forecast - by Electricity
- 11.2. Market Analysis, Insights and Forecast - by Iron and Steel
- 11.3. Market Analysis, Insights and Forecast - by Other Applications
- 12. Competitive Analysis
- 12.1. Company Profiles
- 12.1.1 Peabody Energy Corporation
- 12.1.1.1. Company Overview
- 12.1.1.2. Products
- 12.1.1.3. Company Financials
- 12.1.1.4. SWOT Analysis
- 12.1.2 HardRock Coal Mining Pty Ltd
- 12.1.2.1. Company Overview
- 12.1.2.2. Products
- 12.1.2.3. Company Financials
- 12.1.2.4. SWOT Analysis
- 12.1.3 Bloomfield Collieries Pty Ltd
- 12.1.3.1. Company Overview
- 12.1.3.2. Products
- 12.1.3.3. Company Financials
- 12.1.3.4. SWOT Analysis
- 12.1.4 Yancoal Australia Ltd
- 12.1.4.1. Company Overview
- 12.1.4.2. Products
- 12.1.4.3. Company Financials
- 12.1.4.4. SWOT Analysis
- 12.1.5 Whitehaven Coal Limited*List Not Exhaustive
- 12.1.5.1. Company Overview
- 12.1.5.2. Products
- 12.1.5.3. Company Financials
- 12.1.5.4. SWOT Analysis
- 12.1.6 Idemitsu Australia Resources Pty Ltd
- 12.1.6.1. Company Overview
- 12.1.6.2. Products
- 12.1.6.3. Company Financials
- 12.1.6.4. SWOT Analysis
- 12.1.7 Jellinbah Group Pty Ltd
- 12.1.7.1. Company Overview
- 12.1.7.2. Products
- 12.1.7.3. Company Financials
- 12.1.7.4. SWOT Analysis
- 12.1.8 BHP Group Ltd
- 12.1.8.1. Company Overview
- 12.1.8.2. Products
- 12.1.8.3. Company Financials
- 12.1.8.4. SWOT Analysis
- 12.1.9 Centennial Coal Company Ltd
- 12.1.9.1. Company Overview
- 12.1.9.2. Products
- 12.1.9.3. Company Financials
- 12.1.9.4. SWOT Analysis
- 12.1.10 Vale S A
- 12.1.10.1. Company Overview
- 12.1.10.2. Products
- 12.1.10.3. Company Financials
- 12.1.10.4. SWOT Analysis
- 12.1.1 Peabody Energy Corporation
- 12.2. Market Entropy
- 12.2.1 Company's Key Areas Served
- 12.2.2 Recent Developments
- 12.3. Company Market Share Analysis 2025
- 12.3.1 Top 5 Companies Market Share Analysis
- 12.3.2 Top 3 Companies Market Share Analysis
- 12.4. List of Potential Customers
- 13. Research Methodology
List of Figures
- Figure 1: Global Coal Industry Australia Revenue Breakdown (billion, %) by Region 2025 & 2033
- Figure 2: Global Coal Industry Australia Volume Breakdown (Kiloton, %) by Region 2025 & 2033
- Figure 3: North America Coal Industry Australia Revenue (billion), by Electricity 2025 & 2033
- Figure 4: North America Coal Industry Australia Volume (Kiloton), by Electricity 2025 & 2033
- Figure 5: North America Coal Industry Australia Revenue Share (%), by Electricity 2025 & 2033
- Figure 6: North America Coal Industry Australia Volume Share (%), by Electricity 2025 & 2033
- Figure 7: North America Coal Industry Australia Revenue (billion), by Iron and Steel 2025 & 2033
- Figure 8: North America Coal Industry Australia Volume (Kiloton), by Iron and Steel 2025 & 2033
- Figure 9: North America Coal Industry Australia Revenue Share (%), by Iron and Steel 2025 & 2033
- Figure 10: North America Coal Industry Australia Volume Share (%), by Iron and Steel 2025 & 2033
- Figure 11: North America Coal Industry Australia Revenue (billion), by Other Applications 2025 & 2033
- Figure 12: North America Coal Industry Australia Volume (Kiloton), by Other Applications 2025 & 2033
- Figure 13: North America Coal Industry Australia Revenue Share (%), by Other Applications 2025 & 2033
- Figure 14: North America Coal Industry Australia Volume Share (%), by Other Applications 2025 & 2033
- Figure 15: North America Coal Industry Australia Revenue (billion), by Country 2025 & 2033
- Figure 16: North America Coal Industry Australia Volume (Kiloton), by Country 2025 & 2033
- Figure 17: North America Coal Industry Australia Revenue Share (%), by Country 2025 & 2033
- Figure 18: North America Coal Industry Australia Volume Share (%), by Country 2025 & 2033
- Figure 19: South America Coal Industry Australia Revenue (billion), by Electricity 2025 & 2033
- Figure 20: South America Coal Industry Australia Volume (Kiloton), by Electricity 2025 & 2033
- Figure 21: South America Coal Industry Australia Revenue Share (%), by Electricity 2025 & 2033
- Figure 22: South America Coal Industry Australia Volume Share (%), by Electricity 2025 & 2033
- Figure 23: South America Coal Industry Australia Revenue (billion), by Iron and Steel 2025 & 2033
- Figure 24: South America Coal Industry Australia Volume (Kiloton), by Iron and Steel 2025 & 2033
- Figure 25: South America Coal Industry Australia Revenue Share (%), by Iron and Steel 2025 & 2033
- Figure 26: South America Coal Industry Australia Volume Share (%), by Iron and Steel 2025 & 2033
- Figure 27: South America Coal Industry Australia Revenue (billion), by Other Applications 2025 & 2033
- Figure 28: South America Coal Industry Australia Volume (Kiloton), by Other Applications 2025 & 2033
- Figure 29: South America Coal Industry Australia Revenue Share (%), by Other Applications 2025 & 2033
- Figure 30: South America Coal Industry Australia Volume Share (%), by Other Applications 2025 & 2033
- Figure 31: South America Coal Industry Australia Revenue (billion), by Country 2025 & 2033
- Figure 32: South America Coal Industry Australia Volume (Kiloton), by Country 2025 & 2033
- Figure 33: South America Coal Industry Australia Revenue Share (%), by Country 2025 & 2033
- Figure 34: South America Coal Industry Australia Volume Share (%), by Country 2025 & 2033
- Figure 35: Europe Coal Industry Australia Revenue (billion), by Electricity 2025 & 2033
- Figure 36: Europe Coal Industry Australia Volume (Kiloton), by Electricity 2025 & 2033
- Figure 37: Europe Coal Industry Australia Revenue Share (%), by Electricity 2025 & 2033
- Figure 38: Europe Coal Industry Australia Volume Share (%), by Electricity 2025 & 2033
- Figure 39: Europe Coal Industry Australia Revenue (billion), by Iron and Steel 2025 & 2033
- Figure 40: Europe Coal Industry Australia Volume (Kiloton), by Iron and Steel 2025 & 2033
- Figure 41: Europe Coal Industry Australia Revenue Share (%), by Iron and Steel 2025 & 2033
- Figure 42: Europe Coal Industry Australia Volume Share (%), by Iron and Steel 2025 & 2033
- Figure 43: Europe Coal Industry Australia Revenue (billion), by Other Applications 2025 & 2033
- Figure 44: Europe Coal Industry Australia Volume (Kiloton), by Other Applications 2025 & 2033
- Figure 45: Europe Coal Industry Australia Revenue Share (%), by Other Applications 2025 & 2033
- Figure 46: Europe Coal Industry Australia Volume Share (%), by Other Applications 2025 & 2033
- Figure 47: Europe Coal Industry Australia Revenue (billion), by Country 2025 & 2033
- Figure 48: Europe Coal Industry Australia Volume (Kiloton), by Country 2025 & 2033
- Figure 49: Europe Coal Industry Australia Revenue Share (%), by Country 2025 & 2033
- Figure 50: Europe Coal Industry Australia Volume Share (%), by Country 2025 & 2033
- Figure 51: Middle East & Africa Coal Industry Australia Revenue (billion), by Electricity 2025 & 2033
- Figure 52: Middle East & Africa Coal Industry Australia Volume (Kiloton), by Electricity 2025 & 2033
- Figure 53: Middle East & Africa Coal Industry Australia Revenue Share (%), by Electricity 2025 & 2033
- Figure 54: Middle East & Africa Coal Industry Australia Volume Share (%), by Electricity 2025 & 2033
- Figure 55: Middle East & Africa Coal Industry Australia Revenue (billion), by Iron and Steel 2025 & 2033
- Figure 56: Middle East & Africa Coal Industry Australia Volume (Kiloton), by Iron and Steel 2025 & 2033
- Figure 57: Middle East & Africa Coal Industry Australia Revenue Share (%), by Iron and Steel 2025 & 2033
- Figure 58: Middle East & Africa Coal Industry Australia Volume Share (%), by Iron and Steel 2025 & 2033
- Figure 59: Middle East & Africa Coal Industry Australia Revenue (billion), by Other Applications 2025 & 2033
- Figure 60: Middle East & Africa Coal Industry Australia Volume (Kiloton), by Other Applications 2025 & 2033
- Figure 61: Middle East & Africa Coal Industry Australia Revenue Share (%), by Other Applications 2025 & 2033
- Figure 62: Middle East & Africa Coal Industry Australia Volume Share (%), by Other Applications 2025 & 2033
- Figure 63: Middle East & Africa Coal Industry Australia Revenue (billion), by Country 2025 & 2033
- Figure 64: Middle East & Africa Coal Industry Australia Volume (Kiloton), by Country 2025 & 2033
- Figure 65: Middle East & Africa Coal Industry Australia Revenue Share (%), by Country 2025 & 2033
- Figure 66: Middle East & Africa Coal Industry Australia Volume Share (%), by Country 2025 & 2033
- Figure 67: Asia Pacific Coal Industry Australia Revenue (billion), by Electricity 2025 & 2033
- Figure 68: Asia Pacific Coal Industry Australia Volume (Kiloton), by Electricity 2025 & 2033
- Figure 69: Asia Pacific Coal Industry Australia Revenue Share (%), by Electricity 2025 & 2033
- Figure 70: Asia Pacific Coal Industry Australia Volume Share (%), by Electricity 2025 & 2033
- Figure 71: Asia Pacific Coal Industry Australia Revenue (billion), by Iron and Steel 2025 & 2033
- Figure 72: Asia Pacific Coal Industry Australia Volume (Kiloton), by Iron and Steel 2025 & 2033
- Figure 73: Asia Pacific Coal Industry Australia Revenue Share (%), by Iron and Steel 2025 & 2033
- Figure 74: Asia Pacific Coal Industry Australia Volume Share (%), by Iron and Steel 2025 & 2033
- Figure 75: Asia Pacific Coal Industry Australia Revenue (billion), by Other Applications 2025 & 2033
- Figure 76: Asia Pacific Coal Industry Australia Volume (Kiloton), by Other Applications 2025 & 2033
- Figure 77: Asia Pacific Coal Industry Australia Revenue Share (%), by Other Applications 2025 & 2033
- Figure 78: Asia Pacific Coal Industry Australia Volume Share (%), by Other Applications 2025 & 2033
- Figure 79: Asia Pacific Coal Industry Australia Revenue (billion), by Country 2025 & 2033
- Figure 80: Asia Pacific Coal Industry Australia Volume (Kiloton), by Country 2025 & 2033
- Figure 81: Asia Pacific Coal Industry Australia Revenue Share (%), by Country 2025 & 2033
- Figure 82: Asia Pacific Coal Industry Australia Volume Share (%), by Country 2025 & 2033
List of Tables
- Table 1: Global Coal Industry Australia Revenue billion Forecast, by Electricity 2020 & 2033
- Table 2: Global Coal Industry Australia Volume Kiloton Forecast, by Electricity 2020 & 2033
- Table 3: Global Coal Industry Australia Revenue billion Forecast, by Iron and Steel 2020 & 2033
- Table 4: Global Coal Industry Australia Volume Kiloton Forecast, by Iron and Steel 2020 & 2033
- Table 5: Global Coal Industry Australia Revenue billion Forecast, by Other Applications 2020 & 2033
- Table 6: Global Coal Industry Australia Volume Kiloton Forecast, by Other Applications 2020 & 2033
- Table 7: Global Coal Industry Australia Revenue billion Forecast, by Region 2020 & 2033
- Table 8: Global Coal Industry Australia Volume Kiloton Forecast, by Region 2020 & 2033
- Table 9: Global Coal Industry Australia Revenue billion Forecast, by Electricity 2020 & 2033
- Table 10: Global Coal Industry Australia Volume Kiloton Forecast, by Electricity 2020 & 2033
- Table 11: Global Coal Industry Australia Revenue billion Forecast, by Iron and Steel 2020 & 2033
- Table 12: Global Coal Industry Australia Volume Kiloton Forecast, by Iron and Steel 2020 & 2033
- Table 13: Global Coal Industry Australia Revenue billion Forecast, by Other Applications 2020 & 2033
- Table 14: Global Coal Industry Australia Volume Kiloton Forecast, by Other Applications 2020 & 2033
- Table 15: Global Coal Industry Australia Revenue billion Forecast, by Country 2020 & 2033
- Table 16: Global Coal Industry Australia Volume Kiloton Forecast, by Country 2020 & 2033
- Table 17: United States Coal Industry Australia Revenue (billion) Forecast, by Application 2020 & 2033
- Table 18: United States Coal Industry Australia Volume (Kiloton) Forecast, by Application 2020 & 2033
- Table 19: Canada Coal Industry Australia Revenue (billion) Forecast, by Application 2020 & 2033
- Table 20: Canada Coal Industry Australia Volume (Kiloton) Forecast, by Application 2020 & 2033
- Table 21: Mexico Coal Industry Australia Revenue (billion) Forecast, by Application 2020 & 2033
- Table 22: Mexico Coal Industry Australia Volume (Kiloton) Forecast, by Application 2020 & 2033
- Table 23: Global Coal Industry Australia Revenue billion Forecast, by Electricity 2020 & 2033
- Table 24: Global Coal Industry Australia Volume Kiloton Forecast, by Electricity 2020 & 2033
- Table 25: Global Coal Industry Australia Revenue billion Forecast, by Iron and Steel 2020 & 2033
- Table 26: Global Coal Industry Australia Volume Kiloton Forecast, by Iron and Steel 2020 & 2033
- Table 27: Global Coal Industry Australia Revenue billion Forecast, by Other Applications 2020 & 2033
- Table 28: Global Coal Industry Australia Volume Kiloton Forecast, by Other Applications 2020 & 2033
- Table 29: Global Coal Industry Australia Revenue billion Forecast, by Country 2020 & 2033
- Table 30: Global Coal Industry Australia Volume Kiloton Forecast, by Country 2020 & 2033
- Table 31: Brazil Coal Industry Australia Revenue (billion) Forecast, by Application 2020 & 2033
- Table 32: Brazil Coal Industry Australia Volume (Kiloton) Forecast, by Application 2020 & 2033
- Table 33: Argentina Coal Industry Australia Revenue (billion) Forecast, by Application 2020 & 2033
- Table 34: Argentina Coal Industry Australia Volume (Kiloton) Forecast, by Application 2020 & 2033
- Table 35: Rest of South America Coal Industry Australia Revenue (billion) Forecast, by Application 2020 & 2033
- Table 36: Rest of South America Coal Industry Australia Volume (Kiloton) Forecast, by Application 2020 & 2033
- Table 37: Global Coal Industry Australia Revenue billion Forecast, by Electricity 2020 & 2033
- Table 38: Global Coal Industry Australia Volume Kiloton Forecast, by Electricity 2020 & 2033
- Table 39: Global Coal Industry Australia Revenue billion Forecast, by Iron and Steel 2020 & 2033
- Table 40: Global Coal Industry Australia Volume Kiloton Forecast, by Iron and Steel 2020 & 2033
- Table 41: Global Coal Industry Australia Revenue billion Forecast, by Other Applications 2020 & 2033
- Table 42: Global Coal Industry Australia Volume Kiloton Forecast, by Other Applications 2020 & 2033
- Table 43: Global Coal Industry Australia Revenue billion Forecast, by Country 2020 & 2033
- Table 44: Global Coal Industry Australia Volume Kiloton Forecast, by Country 2020 & 2033
- Table 45: United Kingdom Coal Industry Australia Revenue (billion) Forecast, by Application 2020 & 2033
- Table 46: United Kingdom Coal Industry Australia Volume (Kiloton) Forecast, by Application 2020 & 2033
- Table 47: Germany Coal Industry Australia Revenue (billion) Forecast, by Application 2020 & 2033
- Table 48: Germany Coal Industry Australia Volume (Kiloton) Forecast, by Application 2020 & 2033
- Table 49: France Coal Industry Australia Revenue (billion) Forecast, by Application 2020 & 2033
- Table 50: France Coal Industry Australia Volume (Kiloton) Forecast, by Application 2020 & 2033
- Table 51: Italy Coal Industry Australia Revenue (billion) Forecast, by Application 2020 & 2033
- Table 52: Italy Coal Industry Australia Volume (Kiloton) Forecast, by Application 2020 & 2033
- Table 53: Spain Coal Industry Australia Revenue (billion) Forecast, by Application 2020 & 2033
- Table 54: Spain Coal Industry Australia Volume (Kiloton) Forecast, by Application 2020 & 2033
- Table 55: Russia Coal Industry Australia Revenue (billion) Forecast, by Application 2020 & 2033
- Table 56: Russia Coal Industry Australia Volume (Kiloton) Forecast, by Application 2020 & 2033
- Table 57: Benelux Coal Industry Australia Revenue (billion) Forecast, by Application 2020 & 2033
- Table 58: Benelux Coal Industry Australia Volume (Kiloton) Forecast, by Application 2020 & 2033
- Table 59: Nordics Coal Industry Australia Revenue (billion) Forecast, by Application 2020 & 2033
- Table 60: Nordics Coal Industry Australia Volume (Kiloton) Forecast, by Application 2020 & 2033
- Table 61: Rest of Europe Coal Industry Australia Revenue (billion) Forecast, by Application 2020 & 2033
- Table 62: Rest of Europe Coal Industry Australia Volume (Kiloton) Forecast, by Application 2020 & 2033
- Table 63: Global Coal Industry Australia Revenue billion Forecast, by Electricity 2020 & 2033
- Table 64: Global Coal Industry Australia Volume Kiloton Forecast, by Electricity 2020 & 2033
- Table 65: Global Coal Industry Australia Revenue billion Forecast, by Iron and Steel 2020 & 2033
- Table 66: Global Coal Industry Australia Volume Kiloton Forecast, by Iron and Steel 2020 & 2033
- Table 67: Global Coal Industry Australia Revenue billion Forecast, by Other Applications 2020 & 2033
- Table 68: Global Coal Industry Australia Volume Kiloton Forecast, by Other Applications 2020 & 2033
- Table 69: Global Coal Industry Australia Revenue billion Forecast, by Country 2020 & 2033
- Table 70: Global Coal Industry Australia Volume Kiloton Forecast, by Country 2020 & 2033
- Table 71: Turkey Coal Industry Australia Revenue (billion) Forecast, by Application 2020 & 2033
- Table 72: Turkey Coal Industry Australia Volume (Kiloton) Forecast, by Application 2020 & 2033
- Table 73: Israel Coal Industry Australia Revenue (billion) Forecast, by Application 2020 & 2033
- Table 74: Israel Coal Industry Australia Volume (Kiloton) Forecast, by Application 2020 & 2033
- Table 75: GCC Coal Industry Australia Revenue (billion) Forecast, by Application 2020 & 2033
- Table 76: GCC Coal Industry Australia Volume (Kiloton) Forecast, by Application 2020 & 2033
- Table 77: North Africa Coal Industry Australia Revenue (billion) Forecast, by Application 2020 & 2033
- Table 78: North Africa Coal Industry Australia Volume (Kiloton) Forecast, by Application 2020 & 2033
- Table 79: South Africa Coal Industry Australia Revenue (billion) Forecast, by Application 2020 & 2033
- Table 80: South Africa Coal Industry Australia Volume (Kiloton) Forecast, by Application 2020 & 2033
- Table 81: Rest of Middle East & Africa Coal Industry Australia Revenue (billion) Forecast, by Application 2020 & 2033
- Table 82: Rest of Middle East & Africa Coal Industry Australia Volume (Kiloton) Forecast, by Application 2020 & 2033
- Table 83: Global Coal Industry Australia Revenue billion Forecast, by Electricity 2020 & 2033
- Table 84: Global Coal Industry Australia Volume Kiloton Forecast, by Electricity 2020 & 2033
- Table 85: Global Coal Industry Australia Revenue billion Forecast, by Iron and Steel 2020 & 2033
- Table 86: Global Coal Industry Australia Volume Kiloton Forecast, by Iron and Steel 2020 & 2033
- Table 87: Global Coal Industry Australia Revenue billion Forecast, by Other Applications 2020 & 2033
- Table 88: Global Coal Industry Australia Volume Kiloton Forecast, by Other Applications 2020 & 2033
- Table 89: Global Coal Industry Australia Revenue billion Forecast, by Country 2020 & 2033
- Table 90: Global Coal Industry Australia Volume Kiloton Forecast, by Country 2020 & 2033
- Table 91: China Coal Industry Australia Revenue (billion) Forecast, by Application 2020 & 2033
- Table 92: China Coal Industry Australia Volume (Kiloton) Forecast, by Application 2020 & 2033
- Table 93: India Coal Industry Australia Revenue (billion) Forecast, by Application 2020 & 2033
- Table 94: India Coal Industry Australia Volume (Kiloton) Forecast, by Application 2020 & 2033
- Table 95: Japan Coal Industry Australia Revenue (billion) Forecast, by Application 2020 & 2033
- Table 96: Japan Coal Industry Australia Volume (Kiloton) Forecast, by Application 2020 & 2033
- Table 97: South Korea Coal Industry Australia Revenue (billion) Forecast, by Application 2020 & 2033
- Table 98: South Korea Coal Industry Australia Volume (Kiloton) Forecast, by Application 2020 & 2033
- Table 99: ASEAN Coal Industry Australia Revenue (billion) Forecast, by Application 2020 & 2033
- Table 100: ASEAN Coal Industry Australia Volume (Kiloton) Forecast, by Application 2020 & 2033
- Table 101: Oceania Coal Industry Australia Revenue (billion) Forecast, by Application 2020 & 2033
- Table 102: Oceania Coal Industry Australia Volume (Kiloton) Forecast, by Application 2020 & 2033
- Table 103: Rest of Asia Pacific Coal Industry Australia Revenue (billion) Forecast, by Application 2020 & 2033
- Table 104: Rest of Asia Pacific Coal Industry Australia Volume (Kiloton) Forecast, by Application 2020 & 2033
Frequently Asked Questions
1. What is the projected Compound Annual Growth Rate (CAGR) of the Coal Industry Australia?
The projected CAGR is approximately 2.2%.
2. Which companies are prominent players in the Coal Industry Australia?
Key companies in the market include Peabody Energy Corporation, HardRock Coal Mining Pty Ltd, Bloomfield Collieries Pty Ltd, Yancoal Australia Ltd, Whitehaven Coal Limited*List Not Exhaustive, Idemitsu Australia Resources Pty Ltd, Jellinbah Group Pty Ltd, BHP Group Ltd, Centennial Coal Company Ltd, Vale S A.
3. What are the main segments of the Coal Industry Australia?
The market segments include Electricity, Iron and Steel, Other Applications.
4. Can you provide details about the market size?
The market size is estimated to be USD 57 billion as of 2022.
5. What are some drivers contributing to market growth?
4.; Increase in Prices of Electricity Procured from Conventional Mechanisms 4.; Decline in Cost of Solar Energy Infrastructure.
6. What are the notable trends driving market growth?
Demand for Bituminous Coal to Drive the Market.
7. Are there any restraints impacting market growth?
4.; Competition from Other Alternative Energy Sources.
8. Can you provide examples of recent developments in the market?
September 2022: AGL Energy announced the company's coal-fired Loy Yang A power station in Victoria will close in 2035.
9. What pricing options are available for accessing the report?
Pricing options include single-user, multi-user, and enterprise licenses priced at USD 3800, USD 4500, and USD 5800 respectively.
10. Is the market size provided in terms of value or volume?
The market size is provided in terms of value, measured in billion and volume, measured in Kiloton.
11. Are there any specific market keywords associated with the report?
Yes, the market keyword associated with the report is "Coal Industry Australia," which aids in identifying and referencing the specific market segment covered.
12. How do I determine which pricing option suits my needs best?
The pricing options vary based on user requirements and access needs. Individual users may opt for single-user licenses, while businesses requiring broader access may choose multi-user or enterprise licenses for cost-effective access to the report.
13. Are there any additional resources or data provided in the Coal Industry Australia report?
While the report offers comprehensive insights, it's advisable to review the specific contents or supplementary materials provided to ascertain if additional resources or data are available.
14. How can I stay updated on further developments or reports in the Coal Industry Australia?
To stay informed about further developments, trends, and reports in the Coal Industry Australia, consider subscribing to industry newsletters, following relevant companies and organizations, or regularly checking reputable industry news sources and publications.
Methodology
Step 1 - Identification of Relevant Samples Size from Population Database


Step 2 - Approaches for Defining Global Market Size (Value, Volume* & Price*)

Note*: In applicable scenarios
Step 3 - Data Sources
Primary Research
- Web Analytics
- Survey Reports
- Research Institute
- Latest Research Reports
- Opinion Leaders
Secondary Research
- Annual Reports
- White Paper
- Latest Press Release
- Industry Association
- Paid Database
- Investor Presentations

Step 4 - Data Triangulation
Involves using different sources of information in order to increase the validity of a study
These sources are likely to be stakeholders in a program - participants, other researchers, program staff, other community members, and so on.
Then we put all data in single framework & apply various statistical tools to find out the dynamic on the market.
During the analysis stage, feedback from the stakeholder groups would be compared to determine areas of agreement as well as areas of divergence