
Key Insights
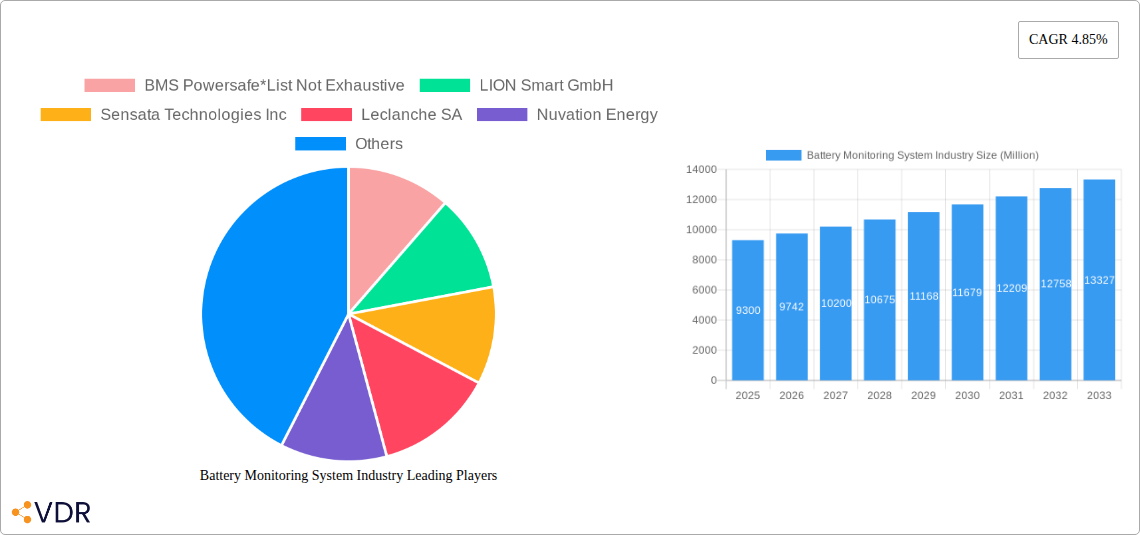
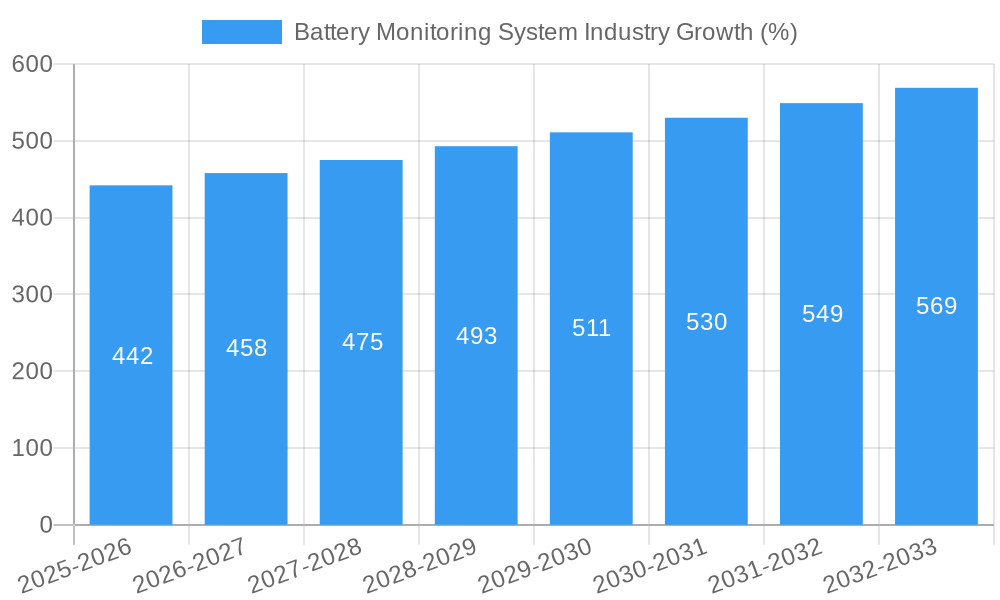
The Battery Monitoring System (BMS) market, valued at $9.30 billion in 2025, is projected to experience robust growth, driven by the burgeoning electric vehicle (EV) sector and the increasing demand for energy storage solutions in renewable energy applications. A compound annual growth rate (CAGR) of 4.85% from 2025 to 2033 indicates a significant expansion, reaching an estimated market size exceeding $13 billion by 2033. This growth is fueled by several key factors. Firstly, stringent government regulations promoting EV adoption and the reduction of carbon emissions globally are creating a substantial demand for BMS, which are crucial for ensuring the safety and performance of EV batteries. Secondly, the rising popularity of renewable energy sources, such as solar and wind power, is leading to a higher demand for energy storage systems, further boosting the BMS market. Advancements in BMS technology, such as improved battery life prediction algorithms and enhanced safety features, are also contributing to market expansion. The market segmentation reveals significant opportunities across various applications, with stationary energy storage showing strong growth potential due to the increasing adoption of grid-scale energy storage solutions. Portable applications, including power tools and consumer electronics, also contribute significantly, while the transportation segment, dominated by EVs, is the largest and fastest-growing segment. Competitive landscape analysis reveals a mix of established players and emerging innovators, highlighting ongoing innovation and competition within the market.
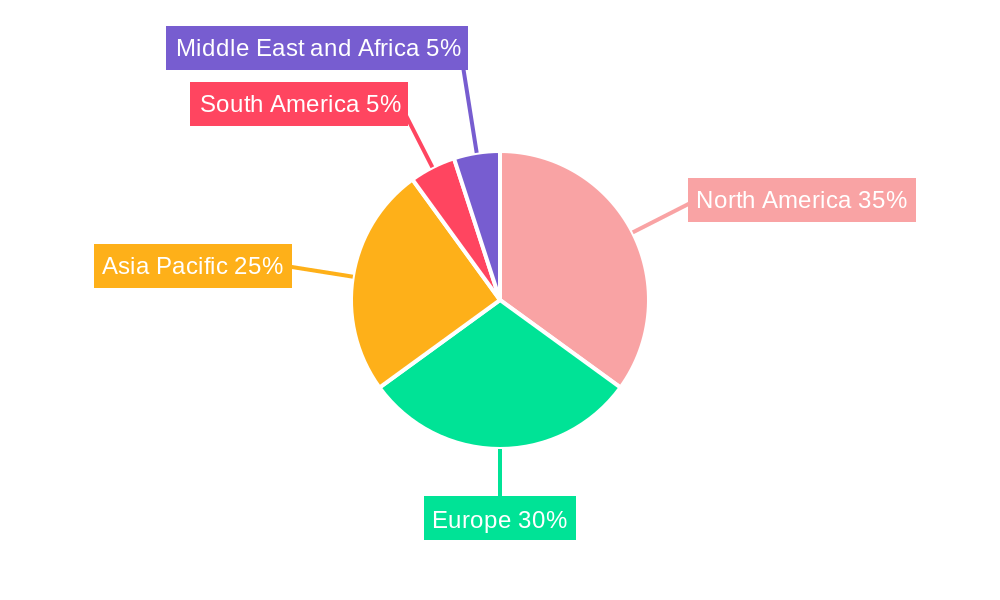
Geographic distribution shows strong growth across various regions. North America and Europe, with their established EV infrastructure and strong regulatory frameworks, are expected to maintain significant market shares. However, the Asia-Pacific region, particularly China and India, is poised for exponential growth, fueled by increasing EV production and the expanding renewable energy sector. South America and the Middle East and Africa are also anticipated to show promising growth, albeit at a slower pace, as EV adoption and renewable energy infrastructure development accelerates in these regions. The overall market outlook for BMS remains overwhelmingly positive, with sustained growth anticipated throughout the forecast period, driven by continued technological advancements, favorable government policies, and the global shift towards cleaner energy solutions.
Battery Monitoring System (BMS) Market Report: 2019-2033
This comprehensive report provides an in-depth analysis of the Battery Monitoring System (BMS) industry, encompassing market dynamics, growth trends, regional dominance, product landscape, key players, and future outlook. With a focus on the parent market of energy storage and the child market of electric vehicle (EV) technology, this report is essential for industry professionals, investors, and strategists seeking actionable insights into this rapidly evolving sector. The study period covers 2019-2033, with 2025 as the base and estimated year.
Battery Monitoring System Industry Market Dynamics & Structure
The Battery Monitoring System (BMS) market is experiencing significant growth driven by the increasing demand for energy storage solutions across various sectors. Market concentration is moderate, with a few dominant players and numerous smaller niche players. Technological innovation, particularly in areas such as AI-powered predictive analytics and improved sensor technology, is a key driver. Stringent regulatory frameworks concerning battery safety and performance are shaping market dynamics. Competitive product substitutes, such as alternative energy sources, pose some challenges, but the overall growth trajectory remains positive. The market is witnessing increased M&A activity, reflecting the strategic importance of BMS technology.
- Market Concentration: Moderately concentrated, with top 5 players holding approximately xx% market share in 2025.
- Technological Innovation: Significant advancements in AI, IoT, and sensor technologies are driving efficiency and safety improvements.
- Regulatory Landscape: Stringent safety and performance standards are creating opportunities for advanced BMS solutions.
- Competitive Substitutes: Alternative energy storage technologies present a moderate competitive threat.
- M&A Activity: xx deals recorded between 2019-2024, indicating increased consolidation and strategic partnerships.
- End-User Demographics: Primarily driven by the automotive, stationary energy storage, and portable electronics sectors.
Battery Monitoring System Industry Growth Trends & Insights
The global BMS market is projected to witness robust growth, with a Compound Annual Growth Rate (CAGR) of xx% during the forecast period (2025-2033). This growth is fueled by the expanding adoption of electric vehicles, renewable energy integration, and the increasing demand for portable electronic devices. Technological disruptions, such as the introduction of solid-state batteries, are creating new opportunities for BMS manufacturers. Shifting consumer preferences towards sustainable energy solutions are further accelerating market growth. Market penetration in key segments such as EVs is expected to increase from xx% in 2025 to xx% by 2033.
Dominant Regions, Countries, or Segments in Battery Monitoring System Industry
The Transportation segment, particularly within the electric vehicle (EV) sector, currently dominates the BMS market. This dominance is primarily attributed to the rapid growth of the global EV industry, driven by government incentives, environmental concerns, and technological advancements. Key regions driving growth include Asia-Pacific (particularly China and Japan), North America, and Europe.
- Key Drivers (Transportation Segment):
- Strong government policies supporting EV adoption.
- Growing consumer demand for electric vehicles.
- Advancements in battery technology and infrastructure.
- Dominance Factors:
- Highest market share (xx% in 2025) within the application segments.
- Significant growth potential due to the burgeoning EV market.
- Technological advancements tailored to EV requirements.
Battery Monitoring System Industry Product Landscape
BMS technology is continuously evolving, with innovations focusing on improved safety, higher efficiency, and extended battery lifespan. Key product developments include advanced algorithms for predictive maintenance, integrated safety features to prevent thermal runaway, and enhanced communication protocols for seamless data integration. The unique selling propositions (USPs) for leading BMS providers often involve proprietary algorithms, robust sensor technologies, and sophisticated data analytics capabilities.
Key Drivers, Barriers & Challenges in Battery Monitoring System Industry
Key Drivers: The increasing adoption of EVs, the expansion of renewable energy sources, and the growing demand for portable electronics are primary drivers. Government regulations promoting energy efficiency and reducing carbon emissions further propel market growth. Technological advancements, such as AI-driven predictive maintenance, are enhancing the value proposition of BMS solutions.
Key Challenges: The high cost of advanced BMS technology can be a barrier to entry for smaller players. Supply chain disruptions, especially concerning critical raw materials, pose a significant challenge. The need for stringent safety regulations and compliance requirements can also impact market growth. Intense competition among established and emerging players adds to the complexity of the market. Furthermore, the need for advanced functionalities while maintaining a compact size and weight introduces engineering challenges.
Emerging Opportunities in Battery Monitoring System Industry
Untapped markets in developing countries with growing energy demands present significant growth opportunities. The integration of BMS with smart grid technologies offers immense potential. Innovative applications in areas like energy storage for grid stability and off-grid power solutions are also emerging. Evolving consumer preferences towards sustainable and reliable energy solutions are creating new market niches for advanced BMS products.
Growth Accelerators in the Battery Monitoring System Industry
Technological breakthroughs in battery chemistry, such as the development of solid-state batteries, are accelerating BMS innovation. Strategic partnerships between BMS manufacturers and battery cell producers are enhancing supply chain integration and product development. Market expansion strategies focusing on emerging markets and new applications are driving long-term growth.
Key Players Shaping the Battery Monitoring System Industry Market
- BMS Powersafe
- LION Smart GmbH
- Sensata Technologies Inc
- Leclanche SA
- Nuvation Energy
- RCRS Innovations Pvt Ltd
- Renesas Electronics Corporation
- Eberspaecher Vecture Inc
- Texas Instruments Incorporated
- Elithion Inc
Notable Milestones in Battery Monitoring System Industry Sector
- May 2022: A leading global vehicle manufacturer selected BorgWarner's BMS for its B-segment, C-segment, and light commercial vehicle platforms, highlighting the growing importance of advanced BMS in the automotive industry.
- March 2022: Battrixx's acquisition of Varos Technology expanded its capabilities in AI-driven BMS solutions, demonstrating the increasing role of data analytics in enhancing battery performance and lifespan.
In-Depth Battery Monitoring System Industry Market Outlook
The future of the BMS market appears bright, driven by continuous technological advancements and the growing demand for energy storage solutions across various sectors. Strategic partnerships, focus on emerging markets, and the development of innovative applications will play a crucial role in shaping the industry's future. The market is poised for significant expansion, offering lucrative opportunities for both established and emerging players.
Battery Monitoring System Industry Segmentation
-
1. Application
- 1.1. Stationary
- 1.2. Portable
- 1.3. Transportation
Battery Monitoring System Industry Segmentation By Geography
-
1. North America
- 1.1. United States
- 1.2. Canada
- 1.3. Rest of North America
-
2. Europe
- 2.1. Germany
- 2.2. Francy
- 2.3. Italy
- 2.4. United Kingdom
- 2.5. Russian Federation
- 2.6. Rest of Europe
-
3. Asia Pacific
- 3.1. China
- 3.2. India
- 3.3. Japan
- 3.4. South Korea
- 3.5. Rest of Asia Pacific
-
4. South America
- 4.1. Brazil
- 4.2. Argentina
- 4.3. Rest of South America
-
5. Middle East and Africa
- 5.1. Saudi Arabia
- 5.2. United Arab Emirates
- 5.3. South Africa
- 5.4. Rest of Middle East and Africa
Battery Monitoring System Industry REPORT HIGHLIGHTS
| Aspects | Details |
|---|---|
| Study Period | 2019-2033 |
| Base Year | 2024 |
| Estimated Year | 2025 |
| Forecast Period | 2025-2033 |
| Historical Period | 2019-2024 |
| Growth Rate | CAGR of 4.85% from 2019-2033 |
| Segmentation |
|
Table of Contents
- 1. Introduction
- 1.1. Research Scope
- 1.2. Market Segmentation
- 1.3. Research Methodology
- 1.4. Definitions and Assumptions
- 2. Executive Summary
- 2.1. Introduction
- 3. Market Dynamics
- 3.1. Introduction
- 3.2. Market Drivers
- 3.2.1. 4.; Global Inclination towards Renewable-based Power Generation4.; Growing Power Demand in Line with the Increasing Population
- 3.3. Market Restrains
- 3.3.1. 4.; High Initial Cost
- 3.4. Market Trends
- 3.4.1. Transportation Segment Expected to Dominate the Market
- 4. Market Factor Analysis
- 4.1. Porters Five Forces
- 4.2. Supply/Value Chain
- 4.3. PESTEL analysis
- 4.4. Market Entropy
- 4.5. Patent/Trademark Analysis
- 5. Global Battery Monitoring System Industry Analysis, Insights and Forecast, 2019-2031
- 5.1. Market Analysis, Insights and Forecast - by Application
- 5.1.1. Stationary
- 5.1.2. Portable
- 5.1.3. Transportation
- 5.2. Market Analysis, Insights and Forecast - by Region
- 5.2.1. North America
- 5.2.2. Europe
- 5.2.3. Asia Pacific
- 5.2.4. South America
- 5.2.5. Middle East and Africa
- 5.1. Market Analysis, Insights and Forecast - by Application
- 6. North America Battery Monitoring System Industry Analysis, Insights and Forecast, 2019-2031
- 6.1. Market Analysis, Insights and Forecast - by Application
- 6.1.1. Stationary
- 6.1.2. Portable
- 6.1.3. Transportation
- 6.1. Market Analysis, Insights and Forecast - by Application
- 7. Europe Battery Monitoring System Industry Analysis, Insights and Forecast, 2019-2031
- 7.1. Market Analysis, Insights and Forecast - by Application
- 7.1.1. Stationary
- 7.1.2. Portable
- 7.1.3. Transportation
- 7.1. Market Analysis, Insights and Forecast - by Application
- 8. Asia Pacific Battery Monitoring System Industry Analysis, Insights and Forecast, 2019-2031
- 8.1. Market Analysis, Insights and Forecast - by Application
- 8.1.1. Stationary
- 8.1.2. Portable
- 8.1.3. Transportation
- 8.1. Market Analysis, Insights and Forecast - by Application
- 9. South America Battery Monitoring System Industry Analysis, Insights and Forecast, 2019-2031
- 9.1. Market Analysis, Insights and Forecast - by Application
- 9.1.1. Stationary
- 9.1.2. Portable
- 9.1.3. Transportation
- 9.1. Market Analysis, Insights and Forecast - by Application
- 10. Middle East and Africa Battery Monitoring System Industry Analysis, Insights and Forecast, 2019-2031
- 10.1. Market Analysis, Insights and Forecast - by Application
- 10.1.1. Stationary
- 10.1.2. Portable
- 10.1.3. Transportation
- 10.1. Market Analysis, Insights and Forecast - by Application
- 11. North America Battery Monitoring System Industry Analysis, Insights and Forecast, 2019-2031
- 11.1. Market Analysis, Insights and Forecast - By Country/Sub-region
- 11.1.1 United States
- 11.1.2 Canada
- 11.1.3 Rest of North America
- 12. Europe Battery Monitoring System Industry Analysis, Insights and Forecast, 2019-2031
- 12.1. Market Analysis, Insights and Forecast - By Country/Sub-region
- 12.1.1 Germany
- 12.1.2 Francy
- 12.1.3 Italy
- 12.1.4 United Kingdom
- 12.1.5 Russian Federation
- 12.1.6 Rest of Europe
- 13. Asia Pacific Battery Monitoring System Industry Analysis, Insights and Forecast, 2019-2031
- 13.1. Market Analysis, Insights and Forecast - By Country/Sub-region
- 13.1.1 China
- 13.1.2 India
- 13.1.3 Japan
- 13.1.4 South Korea
- 13.1.5 Rest of Asia Pacific
- 14. South America Battery Monitoring System Industry Analysis, Insights and Forecast, 2019-2031
- 14.1. Market Analysis, Insights and Forecast - By Country/Sub-region
- 14.1.1 Brazil
- 14.1.2 Argentina
- 14.1.3 Rest of South America
- 15. Middle East and Africa Battery Monitoring System Industry Analysis, Insights and Forecast, 2019-2031
- 15.1. Market Analysis, Insights and Forecast - By Country/Sub-region
- 15.1.1 Saudi Arabia
- 15.1.2 United Arab Emirates
- 15.1.3 South Africa
- 15.1.4 Rest of Middle East and Africa
- 16. Competitive Analysis
- 16.1. Global Market Share Analysis 2024
- 16.2. Company Profiles
- 16.2.1 BMS Powersafe*List Not Exhaustive
- 16.2.1.1. Overview
- 16.2.1.2. Products
- 16.2.1.3. SWOT Analysis
- 16.2.1.4. Recent Developments
- 16.2.1.5. Financials (Based on Availability)
- 16.2.2 LION Smart GmbH
- 16.2.2.1. Overview
- 16.2.2.2. Products
- 16.2.2.3. SWOT Analysis
- 16.2.2.4. Recent Developments
- 16.2.2.5. Financials (Based on Availability)
- 16.2.3 Sensata Technologies Inc
- 16.2.3.1. Overview
- 16.2.3.2. Products
- 16.2.3.3. SWOT Analysis
- 16.2.3.4. Recent Developments
- 16.2.3.5. Financials (Based on Availability)
- 16.2.4 Leclanche SA
- 16.2.4.1. Overview
- 16.2.4.2. Products
- 16.2.4.3. SWOT Analysis
- 16.2.4.4. Recent Developments
- 16.2.4.5. Financials (Based on Availability)
- 16.2.5 Nuvation Energy
- 16.2.5.1. Overview
- 16.2.5.2. Products
- 16.2.5.3. SWOT Analysis
- 16.2.5.4. Recent Developments
- 16.2.5.5. Financials (Based on Availability)
- 16.2.6 RCRS Innovations Pvt Ltd
- 16.2.6.1. Overview
- 16.2.6.2. Products
- 16.2.6.3. SWOT Analysis
- 16.2.6.4. Recent Developments
- 16.2.6.5. Financials (Based on Availability)
- 16.2.7 Renesas Electronics Corporation
- 16.2.7.1. Overview
- 16.2.7.2. Products
- 16.2.7.3. SWOT Analysis
- 16.2.7.4. Recent Developments
- 16.2.7.5. Financials (Based on Availability)
- 16.2.8 Eberspaecher Vecture Inc
- 16.2.8.1. Overview
- 16.2.8.2. Products
- 16.2.8.3. SWOT Analysis
- 16.2.8.4. Recent Developments
- 16.2.8.5. Financials (Based on Availability)
- 16.2.9 Texas Instruments Incorporated
- 16.2.9.1. Overview
- 16.2.9.2. Products
- 16.2.9.3. SWOT Analysis
- 16.2.9.4. Recent Developments
- 16.2.9.5. Financials (Based on Availability)
- 16.2.10 Elithion Inc
- 16.2.10.1. Overview
- 16.2.10.2. Products
- 16.2.10.3. SWOT Analysis
- 16.2.10.4. Recent Developments
- 16.2.10.5. Financials (Based on Availability)
- 16.2.1 BMS Powersafe*List Not Exhaustive
List of Figures
- Figure 1: Global Battery Monitoring System Industry Revenue Breakdown (Million, %) by Region 2024 & 2032
- Figure 2: Global Battery Monitoring System Industry Volume Breakdown (K Units, %) by Region 2024 & 2032
- Figure 3: North America Battery Monitoring System Industry Revenue (Million), by Country 2024 & 2032
- Figure 4: North America Battery Monitoring System Industry Volume (K Units), by Country 2024 & 2032
- Figure 5: North America Battery Monitoring System Industry Revenue Share (%), by Country 2024 & 2032
- Figure 6: North America Battery Monitoring System Industry Volume Share (%), by Country 2024 & 2032
- Figure 7: Europe Battery Monitoring System Industry Revenue (Million), by Country 2024 & 2032
- Figure 8: Europe Battery Monitoring System Industry Volume (K Units), by Country 2024 & 2032
- Figure 9: Europe Battery Monitoring System Industry Revenue Share (%), by Country 2024 & 2032
- Figure 10: Europe Battery Monitoring System Industry Volume Share (%), by Country 2024 & 2032
- Figure 11: Asia Pacific Battery Monitoring System Industry Revenue (Million), by Country 2024 & 2032
- Figure 12: Asia Pacific Battery Monitoring System Industry Volume (K Units), by Country 2024 & 2032
- Figure 13: Asia Pacific Battery Monitoring System Industry Revenue Share (%), by Country 2024 & 2032
- Figure 14: Asia Pacific Battery Monitoring System Industry Volume Share (%), by Country 2024 & 2032
- Figure 15: South America Battery Monitoring System Industry Revenue (Million), by Country 2024 & 2032
- Figure 16: South America Battery Monitoring System Industry Volume (K Units), by Country 2024 & 2032
- Figure 17: South America Battery Monitoring System Industry Revenue Share (%), by Country 2024 & 2032
- Figure 18: South America Battery Monitoring System Industry Volume Share (%), by Country 2024 & 2032
- Figure 19: Middle East and Africa Battery Monitoring System Industry Revenue (Million), by Country 2024 & 2032
- Figure 20: Middle East and Africa Battery Monitoring System Industry Volume (K Units), by Country 2024 & 2032
- Figure 21: Middle East and Africa Battery Monitoring System Industry Revenue Share (%), by Country 2024 & 2032
- Figure 22: Middle East and Africa Battery Monitoring System Industry Volume Share (%), by Country 2024 & 2032
- Figure 23: North America Battery Monitoring System Industry Revenue (Million), by Application 2024 & 2032
- Figure 24: North America Battery Monitoring System Industry Volume (K Units), by Application 2024 & 2032
- Figure 25: North America Battery Monitoring System Industry Revenue Share (%), by Application 2024 & 2032
- Figure 26: North America Battery Monitoring System Industry Volume Share (%), by Application 2024 & 2032
- Figure 27: North America Battery Monitoring System Industry Revenue (Million), by Country 2024 & 2032
- Figure 28: North America Battery Monitoring System Industry Volume (K Units), by Country 2024 & 2032
- Figure 29: North America Battery Monitoring System Industry Revenue Share (%), by Country 2024 & 2032
- Figure 30: North America Battery Monitoring System Industry Volume Share (%), by Country 2024 & 2032
- Figure 31: Europe Battery Monitoring System Industry Revenue (Million), by Application 2024 & 2032
- Figure 32: Europe Battery Monitoring System Industry Volume (K Units), by Application 2024 & 2032
- Figure 33: Europe Battery Monitoring System Industry Revenue Share (%), by Application 2024 & 2032
- Figure 34: Europe Battery Monitoring System Industry Volume Share (%), by Application 2024 & 2032
- Figure 35: Europe Battery Monitoring System Industry Revenue (Million), by Country 2024 & 2032
- Figure 36: Europe Battery Monitoring System Industry Volume (K Units), by Country 2024 & 2032
- Figure 37: Europe Battery Monitoring System Industry Revenue Share (%), by Country 2024 & 2032
- Figure 38: Europe Battery Monitoring System Industry Volume Share (%), by Country 2024 & 2032
- Figure 39: Asia Pacific Battery Monitoring System Industry Revenue (Million), by Application 2024 & 2032
- Figure 40: Asia Pacific Battery Monitoring System Industry Volume (K Units), by Application 2024 & 2032
- Figure 41: Asia Pacific Battery Monitoring System Industry Revenue Share (%), by Application 2024 & 2032
- Figure 42: Asia Pacific Battery Monitoring System Industry Volume Share (%), by Application 2024 & 2032
- Figure 43: Asia Pacific Battery Monitoring System Industry Revenue (Million), by Country 2024 & 2032
- Figure 44: Asia Pacific Battery Monitoring System Industry Volume (K Units), by Country 2024 & 2032
- Figure 45: Asia Pacific Battery Monitoring System Industry Revenue Share (%), by Country 2024 & 2032
- Figure 46: Asia Pacific Battery Monitoring System Industry Volume Share (%), by Country 2024 & 2032
- Figure 47: South America Battery Monitoring System Industry Revenue (Million), by Application 2024 & 2032
- Figure 48: South America Battery Monitoring System Industry Volume (K Units), by Application 2024 & 2032
- Figure 49: South America Battery Monitoring System Industry Revenue Share (%), by Application 2024 & 2032
- Figure 50: South America Battery Monitoring System Industry Volume Share (%), by Application 2024 & 2032
- Figure 51: South America Battery Monitoring System Industry Revenue (Million), by Country 2024 & 2032
- Figure 52: South America Battery Monitoring System Industry Volume (K Units), by Country 2024 & 2032
- Figure 53: South America Battery Monitoring System Industry Revenue Share (%), by Country 2024 & 2032
- Figure 54: South America Battery Monitoring System Industry Volume Share (%), by Country 2024 & 2032
- Figure 55: Middle East and Africa Battery Monitoring System Industry Revenue (Million), by Application 2024 & 2032
- Figure 56: Middle East and Africa Battery Monitoring System Industry Volume (K Units), by Application 2024 & 2032
- Figure 57: Middle East and Africa Battery Monitoring System Industry Revenue Share (%), by Application 2024 & 2032
- Figure 58: Middle East and Africa Battery Monitoring System Industry Volume Share (%), by Application 2024 & 2032
- Figure 59: Middle East and Africa Battery Monitoring System Industry Revenue (Million), by Country 2024 & 2032
- Figure 60: Middle East and Africa Battery Monitoring System Industry Volume (K Units), by Country 2024 & 2032
- Figure 61: Middle East and Africa Battery Monitoring System Industry Revenue Share (%), by Country 2024 & 2032
- Figure 62: Middle East and Africa Battery Monitoring System Industry Volume Share (%), by Country 2024 & 2032
List of Tables
- Table 1: Global Battery Monitoring System Industry Revenue Million Forecast, by Region 2019 & 2032
- Table 2: Global Battery Monitoring System Industry Volume K Units Forecast, by Region 2019 & 2032
- Table 3: Global Battery Monitoring System Industry Revenue Million Forecast, by Application 2019 & 2032
- Table 4: Global Battery Monitoring System Industry Volume K Units Forecast, by Application 2019 & 2032
- Table 5: Global Battery Monitoring System Industry Revenue Million Forecast, by Region 2019 & 2032
- Table 6: Global Battery Monitoring System Industry Volume K Units Forecast, by Region 2019 & 2032
- Table 7: Global Battery Monitoring System Industry Revenue Million Forecast, by Country 2019 & 2032
- Table 8: Global Battery Monitoring System Industry Volume K Units Forecast, by Country 2019 & 2032
- Table 9: United States Battery Monitoring System Industry Revenue (Million) Forecast, by Application 2019 & 2032
- Table 10: United States Battery Monitoring System Industry Volume (K Units) Forecast, by Application 2019 & 2032
- Table 11: Canada Battery Monitoring System Industry Revenue (Million) Forecast, by Application 2019 & 2032
- Table 12: Canada Battery Monitoring System Industry Volume (K Units) Forecast, by Application 2019 & 2032
- Table 13: Rest of North America Battery Monitoring System Industry Revenue (Million) Forecast, by Application 2019 & 2032
- Table 14: Rest of North America Battery Monitoring System Industry Volume (K Units) Forecast, by Application 2019 & 2032
- Table 15: Global Battery Monitoring System Industry Revenue Million Forecast, by Country 2019 & 2032
- Table 16: Global Battery Monitoring System Industry Volume K Units Forecast, by Country 2019 & 2032
- Table 17: Germany Battery Monitoring System Industry Revenue (Million) Forecast, by Application 2019 & 2032
- Table 18: Germany Battery Monitoring System Industry Volume (K Units) Forecast, by Application 2019 & 2032
- Table 19: Francy Battery Monitoring System Industry Revenue (Million) Forecast, by Application 2019 & 2032
- Table 20: Francy Battery Monitoring System Industry Volume (K Units) Forecast, by Application 2019 & 2032
- Table 21: Italy Battery Monitoring System Industry Revenue (Million) Forecast, by Application 2019 & 2032
- Table 22: Italy Battery Monitoring System Industry Volume (K Units) Forecast, by Application 2019 & 2032
- Table 23: United Kingdom Battery Monitoring System Industry Revenue (Million) Forecast, by Application 2019 & 2032
- Table 24: United Kingdom Battery Monitoring System Industry Volume (K Units) Forecast, by Application 2019 & 2032
- Table 25: Russian Federation Battery Monitoring System Industry Revenue (Million) Forecast, by Application 2019 & 2032
- Table 26: Russian Federation Battery Monitoring System Industry Volume (K Units) Forecast, by Application 2019 & 2032
- Table 27: Rest of Europe Battery Monitoring System Industry Revenue (Million) Forecast, by Application 2019 & 2032
- Table 28: Rest of Europe Battery Monitoring System Industry Volume (K Units) Forecast, by Application 2019 & 2032
- Table 29: Global Battery Monitoring System Industry Revenue Million Forecast, by Country 2019 & 2032
- Table 30: Global Battery Monitoring System Industry Volume K Units Forecast, by Country 2019 & 2032
- Table 31: China Battery Monitoring System Industry Revenue (Million) Forecast, by Application 2019 & 2032
- Table 32: China Battery Monitoring System Industry Volume (K Units) Forecast, by Application 2019 & 2032
- Table 33: India Battery Monitoring System Industry Revenue (Million) Forecast, by Application 2019 & 2032
- Table 34: India Battery Monitoring System Industry Volume (K Units) Forecast, by Application 2019 & 2032
- Table 35: Japan Battery Monitoring System Industry Revenue (Million) Forecast, by Application 2019 & 2032
- Table 36: Japan Battery Monitoring System Industry Volume (K Units) Forecast, by Application 2019 & 2032
- Table 37: South Korea Battery Monitoring System Industry Revenue (Million) Forecast, by Application 2019 & 2032
- Table 38: South Korea Battery Monitoring System Industry Volume (K Units) Forecast, by Application 2019 & 2032
- Table 39: Rest of Asia Pacific Battery Monitoring System Industry Revenue (Million) Forecast, by Application 2019 & 2032
- Table 40: Rest of Asia Pacific Battery Monitoring System Industry Volume (K Units) Forecast, by Application 2019 & 2032
- Table 41: Global Battery Monitoring System Industry Revenue Million Forecast, by Country 2019 & 2032
- Table 42: Global Battery Monitoring System Industry Volume K Units Forecast, by Country 2019 & 2032
- Table 43: Brazil Battery Monitoring System Industry Revenue (Million) Forecast, by Application 2019 & 2032
- Table 44: Brazil Battery Monitoring System Industry Volume (K Units) Forecast, by Application 2019 & 2032
- Table 45: Argentina Battery Monitoring System Industry Revenue (Million) Forecast, by Application 2019 & 2032
- Table 46: Argentina Battery Monitoring System Industry Volume (K Units) Forecast, by Application 2019 & 2032
- Table 47: Rest of South America Battery Monitoring System Industry Revenue (Million) Forecast, by Application 2019 & 2032
- Table 48: Rest of South America Battery Monitoring System Industry Volume (K Units) Forecast, by Application 2019 & 2032
- Table 49: Global Battery Monitoring System Industry Revenue Million Forecast, by Country 2019 & 2032
- Table 50: Global Battery Monitoring System Industry Volume K Units Forecast, by Country 2019 & 2032
- Table 51: Saudi Arabia Battery Monitoring System Industry Revenue (Million) Forecast, by Application 2019 & 2032
- Table 52: Saudi Arabia Battery Monitoring System Industry Volume (K Units) Forecast, by Application 2019 & 2032
- Table 53: United Arab Emirates Battery Monitoring System Industry Revenue (Million) Forecast, by Application 2019 & 2032
- Table 54: United Arab Emirates Battery Monitoring System Industry Volume (K Units) Forecast, by Application 2019 & 2032
- Table 55: South Africa Battery Monitoring System Industry Revenue (Million) Forecast, by Application 2019 & 2032
- Table 56: South Africa Battery Monitoring System Industry Volume (K Units) Forecast, by Application 2019 & 2032
- Table 57: Rest of Middle East and Africa Battery Monitoring System Industry Revenue (Million) Forecast, by Application 2019 & 2032
- Table 58: Rest of Middle East and Africa Battery Monitoring System Industry Volume (K Units) Forecast, by Application 2019 & 2032
- Table 59: Global Battery Monitoring System Industry Revenue Million Forecast, by Application 2019 & 2032
- Table 60: Global Battery Monitoring System Industry Volume K Units Forecast, by Application 2019 & 2032
- Table 61: Global Battery Monitoring System Industry Revenue Million Forecast, by Country 2019 & 2032
- Table 62: Global Battery Monitoring System Industry Volume K Units Forecast, by Country 2019 & 2032
- Table 63: United States Battery Monitoring System Industry Revenue (Million) Forecast, by Application 2019 & 2032
- Table 64: United States Battery Monitoring System Industry Volume (K Units) Forecast, by Application 2019 & 2032
- Table 65: Canada Battery Monitoring System Industry Revenue (Million) Forecast, by Application 2019 & 2032
- Table 66: Canada Battery Monitoring System Industry Volume (K Units) Forecast, by Application 2019 & 2032
- Table 67: Rest of North America Battery Monitoring System Industry Revenue (Million) Forecast, by Application 2019 & 2032
- Table 68: Rest of North America Battery Monitoring System Industry Volume (K Units) Forecast, by Application 2019 & 2032
- Table 69: Global Battery Monitoring System Industry Revenue Million Forecast, by Application 2019 & 2032
- Table 70: Global Battery Monitoring System Industry Volume K Units Forecast, by Application 2019 & 2032
- Table 71: Global Battery Monitoring System Industry Revenue Million Forecast, by Country 2019 & 2032
- Table 72: Global Battery Monitoring System Industry Volume K Units Forecast, by Country 2019 & 2032
- Table 73: Germany Battery Monitoring System Industry Revenue (Million) Forecast, by Application 2019 & 2032
- Table 74: Germany Battery Monitoring System Industry Volume (K Units) Forecast, by Application 2019 & 2032
- Table 75: Francy Battery Monitoring System Industry Revenue (Million) Forecast, by Application 2019 & 2032
- Table 76: Francy Battery Monitoring System Industry Volume (K Units) Forecast, by Application 2019 & 2032
- Table 77: Italy Battery Monitoring System Industry Revenue (Million) Forecast, by Application 2019 & 2032
- Table 78: Italy Battery Monitoring System Industry Volume (K Units) Forecast, by Application 2019 & 2032
- Table 79: United Kingdom Battery Monitoring System Industry Revenue (Million) Forecast, by Application 2019 & 2032
- Table 80: United Kingdom Battery Monitoring System Industry Volume (K Units) Forecast, by Application 2019 & 2032
- Table 81: Russian Federation Battery Monitoring System Industry Revenue (Million) Forecast, by Application 2019 & 2032
- Table 82: Russian Federation Battery Monitoring System Industry Volume (K Units) Forecast, by Application 2019 & 2032
- Table 83: Rest of Europe Battery Monitoring System Industry Revenue (Million) Forecast, by Application 2019 & 2032
- Table 84: Rest of Europe Battery Monitoring System Industry Volume (K Units) Forecast, by Application 2019 & 2032
- Table 85: Global Battery Monitoring System Industry Revenue Million Forecast, by Application 2019 & 2032
- Table 86: Global Battery Monitoring System Industry Volume K Units Forecast, by Application 2019 & 2032
- Table 87: Global Battery Monitoring System Industry Revenue Million Forecast, by Country 2019 & 2032
- Table 88: Global Battery Monitoring System Industry Volume K Units Forecast, by Country 2019 & 2032
- Table 89: China Battery Monitoring System Industry Revenue (Million) Forecast, by Application 2019 & 2032
- Table 90: China Battery Monitoring System Industry Volume (K Units) Forecast, by Application 2019 & 2032
- Table 91: India Battery Monitoring System Industry Revenue (Million) Forecast, by Application 2019 & 2032
- Table 92: India Battery Monitoring System Industry Volume (K Units) Forecast, by Application 2019 & 2032
- Table 93: Japan Battery Monitoring System Industry Revenue (Million) Forecast, by Application 2019 & 2032
- Table 94: Japan Battery Monitoring System Industry Volume (K Units) Forecast, by Application 2019 & 2032
- Table 95: South Korea Battery Monitoring System Industry Revenue (Million) Forecast, by Application 2019 & 2032
- Table 96: South Korea Battery Monitoring System Industry Volume (K Units) Forecast, by Application 2019 & 2032
- Table 97: Rest of Asia Pacific Battery Monitoring System Industry Revenue (Million) Forecast, by Application 2019 & 2032
- Table 98: Rest of Asia Pacific Battery Monitoring System Industry Volume (K Units) Forecast, by Application 2019 & 2032
- Table 99: Global Battery Monitoring System Industry Revenue Million Forecast, by Application 2019 & 2032
- Table 100: Global Battery Monitoring System Industry Volume K Units Forecast, by Application 2019 & 2032
- Table 101: Global Battery Monitoring System Industry Revenue Million Forecast, by Country 2019 & 2032
- Table 102: Global Battery Monitoring System Industry Volume K Units Forecast, by Country 2019 & 2032
- Table 103: Brazil Battery Monitoring System Industry Revenue (Million) Forecast, by Application 2019 & 2032
- Table 104: Brazil Battery Monitoring System Industry Volume (K Units) Forecast, by Application 2019 & 2032
- Table 105: Argentina Battery Monitoring System Industry Revenue (Million) Forecast, by Application 2019 & 2032
- Table 106: Argentina Battery Monitoring System Industry Volume (K Units) Forecast, by Application 2019 & 2032
- Table 107: Rest of South America Battery Monitoring System Industry Revenue (Million) Forecast, by Application 2019 & 2032
- Table 108: Rest of South America Battery Monitoring System Industry Volume (K Units) Forecast, by Application 2019 & 2032
- Table 109: Global Battery Monitoring System Industry Revenue Million Forecast, by Application 2019 & 2032
- Table 110: Global Battery Monitoring System Industry Volume K Units Forecast, by Application 2019 & 2032
- Table 111: Global Battery Monitoring System Industry Revenue Million Forecast, by Country 2019 & 2032
- Table 112: Global Battery Monitoring System Industry Volume K Units Forecast, by Country 2019 & 2032
- Table 113: Saudi Arabia Battery Monitoring System Industry Revenue (Million) Forecast, by Application 2019 & 2032
- Table 114: Saudi Arabia Battery Monitoring System Industry Volume (K Units) Forecast, by Application 2019 & 2032
- Table 115: United Arab Emirates Battery Monitoring System Industry Revenue (Million) Forecast, by Application 2019 & 2032
- Table 116: United Arab Emirates Battery Monitoring System Industry Volume (K Units) Forecast, by Application 2019 & 2032
- Table 117: South Africa Battery Monitoring System Industry Revenue (Million) Forecast, by Application 2019 & 2032
- Table 118: South Africa Battery Monitoring System Industry Volume (K Units) Forecast, by Application 2019 & 2032
- Table 119: Rest of Middle East and Africa Battery Monitoring System Industry Revenue (Million) Forecast, by Application 2019 & 2032
- Table 120: Rest of Middle East and Africa Battery Monitoring System Industry Volume (K Units) Forecast, by Application 2019 & 2032
Frequently Asked Questions
1. What is the projected Compound Annual Growth Rate (CAGR) of the Battery Monitoring System Industry?
The projected CAGR is approximately 4.85%.
2. Which companies are prominent players in the Battery Monitoring System Industry?
Key companies in the market include BMS Powersafe*List Not Exhaustive, LION Smart GmbH, Sensata Technologies Inc, Leclanche SA, Nuvation Energy, RCRS Innovations Pvt Ltd, Renesas Electronics Corporation, Eberspaecher Vecture Inc, Texas Instruments Incorporated, Elithion Inc.
3. What are the main segments of the Battery Monitoring System Industry?
The market segments include Application.
4. Can you provide details about the market size?
The market size is estimated to be USD 9.30 Million as of 2022.
5. What are some drivers contributing to market growth?
4.; Global Inclination towards Renewable-based Power Generation4.; Growing Power Demand in Line with the Increasing Population.
6. What are the notable trends driving market growth?
Transportation Segment Expected to Dominate the Market.
7. Are there any restraints impacting market growth?
4.; High Initial Cost.
8. Can you provide examples of recent developments in the market?
In May 2022, a leading global vehicle manufacturer selected BorgWarner's battery management system (BMS) to fit its entire B-segment, C-segment, and light commercial vehicle platforms. Starting mid-2023, the new BorgWarner BMS technology is expected to optimize battery pack performance, safety, and longevity. BorgWarner's battery management system for hybrid and electric vehicles contains a master control unit connected to multiple cell management control units. It is designed to monitor the state of charge, health, and battery temperature of each battery cell and also precisely measure battery pack current and voltage.
9. What pricing options are available for accessing the report?
Pricing options include single-user, multi-user, and enterprise licenses priced at USD 4750, USD 5250, and USD 8750 respectively.
10. Is the market size provided in terms of value or volume?
The market size is provided in terms of value, measured in Million and volume, measured in K Units.
11. Are there any specific market keywords associated with the report?
Yes, the market keyword associated with the report is "Battery Monitoring System Industry," which aids in identifying and referencing the specific market segment covered.
12. How do I determine which pricing option suits my needs best?
The pricing options vary based on user requirements and access needs. Individual users may opt for single-user licenses, while businesses requiring broader access may choose multi-user or enterprise licenses for cost-effective access to the report.
13. Are there any additional resources or data provided in the Battery Monitoring System Industry report?
While the report offers comprehensive insights, it's advisable to review the specific contents or supplementary materials provided to ascertain if additional resources or data are available.
14. How can I stay updated on further developments or reports in the Battery Monitoring System Industry?
To stay informed about further developments, trends, and reports in the Battery Monitoring System Industry, consider subscribing to industry newsletters, following relevant companies and organizations, or regularly checking reputable industry news sources and publications.
Methodology
Step 1 - Identification of Relevant Samples Size from Population Database


Step 2 - Approaches for Defining Global Market Size (Value, Volume* & Price*)

Note*: In applicable scenarios
Step 3 - Data Sources
Primary Research
- Web Analytics
- Survey Reports
- Research Institute
- Latest Research Reports
- Opinion Leaders
Secondary Research
- Annual Reports
- White Paper
- Latest Press Release
- Industry Association
- Paid Database
- Investor Presentations

Step 4 - Data Triangulation
Involves using different sources of information in order to increase the validity of a study
These sources are likely to be stakeholders in a program - participants, other researchers, program staff, other community members, and so on.
Then we put all data in single framework & apply various statistical tools to find out the dynamic on the market.
During the analysis stage, feedback from the stakeholder groups would be compared to determine areas of agreement as well as areas of divergence


