

Key Insights
The Asia-Pacific (APAC) nuclear power reactor decommissioning market is poised for significant expansion, driven by aging nuclear infrastructure and stringent regulatory mandates for safe, efficient dismantlement. The market, estimated at 8.01 billion in 2025, is projected to grow at a Compound Annual Growth Rate (CAGR) of 3.59% throughout the forecast period (2025-2033). Key growth drivers include Japan, China, and South Korea, home to a substantial number of reactors nearing their operational end-of-life. The diverse reactor types present unique decommissioning challenges and opportunities. The market is segmented by application (commercial, prototype, research) and reactor capacity (below 100 MW, 100-1000 MW, above 1000 MW), influencing project costs and complexity. Investment in advanced technologies and specialized expertise is crucial. Challenges include stringent safety regulations, skilled labor shortages, and radioactive waste management. However, a growing emphasis on environmental sustainability and material reuse will catalyze market growth.
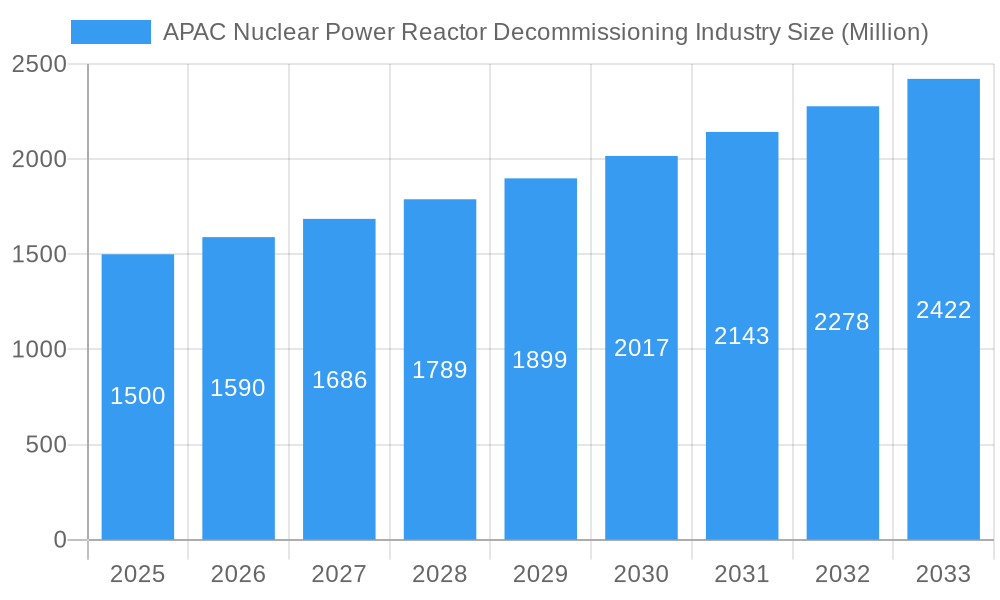
APAC Nuclear Power Reactor Decommissioning Industry Market Size (In Billion)
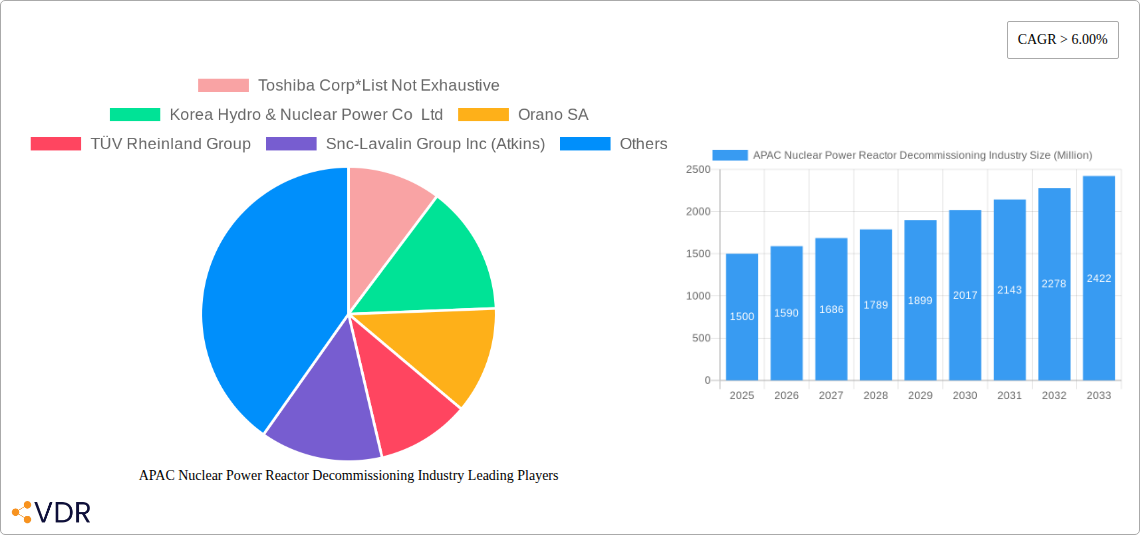
A competitive landscape features key players such as Toshiba Corp, Korea Hydro & Nuclear Power Co Ltd, and Orano SA, who are actively investing in R&D to enhance decommissioning technologies, reduce costs, and improve safety. Future growth hinges on robust regulatory frameworks, efficient waste management, and continuous technological innovation. Government support and infrastructure investment will be vital. While specific regional market sizes are not detailed, estimations are derived from the overall APAC market size and distribution across major nations like Japan, China, and South Korea, alongside other APAC countries based on reactor counts and decommissioning schedules.
APAC Nuclear Power Reactor Decommissioning Industry Company Market Share
This report offers a comprehensive analysis of the APAC nuclear power reactor decommissioning industry, detailing market dynamics, growth trajectories, regional segmentation, and key players. The study covers the period 2019-2033, with 2025 serving as the base year for market size estimation and the forecast period extending from 2025-2033. This analysis is indispensable for industry professionals, investors, and policymakers seeking insights into this critical sector.
APAC Nuclear Power Reactor Decommissioning Industry Market Dynamics & Structure
The APAC nuclear power reactor decommissioning market is characterized by a moderately concentrated structure with several large multinational players and numerous regional specialists. Technological innovation, particularly in robotics, AI-driven monitoring, and waste management, is a key driver. Stringent regulatory frameworks, varying across countries, significantly impact operational costs and timelines. Competitive substitutes, such as advanced recycling technologies, are slowly emerging, posing a long-term threat. End-user demographics largely comprise government agencies, nuclear power plant operators, and specialized decommissioning contractors. M&A activity has been relatively low in recent years (approximately xx deals annually in the historical period), but is expected to increase with the growing decommissioning needs.
- Market Concentration: Moderately concentrated, with a Herfindahl-Hirschman Index (HHI) of xx in 2024.
- Technological Innovation: Robotics, AI, advanced waste processing driving efficiency gains but facing high initial investment barriers.
- Regulatory Landscape: Diverse and complex across APAC nations, leading to varied decommissioning costs and schedules.
- Competitive Substitutes: Limited but growing presence of advanced recycling and waste treatment options.
- M&A Activity: Low historical activity, but projected increase to xx deals annually by 2030.
APAC Nuclear Power Reactor Decommissioning Industry Growth Trends & Insights
The APAC nuclear power reactor decommissioning market experienced substantial growth during the historical period (2019-2024), driven primarily by the aging nuclear fleet and increasing regulatory pressure. The market size reached xx million in 2024 and is projected to exhibit a CAGR of xx% from 2025 to 2033, reaching xx million by 2033. This growth is fueled by several factors, including the increasing number of reactors nearing the end of their operational life, the rising costs of prolonged reactor operation, and stricter environmental regulations regarding nuclear waste disposal. Technological advancements, while expensive upfront, are contributing to higher efficiency and reduced decommissioning times, accelerating market expansion. Consumer behavior, specifically from government agencies, increasingly favors comprehensive and environmentally responsible decommissioning solutions.
Dominant Regions, Countries, or Segments in APAC Nuclear Power Reactor Decommissioning Industry
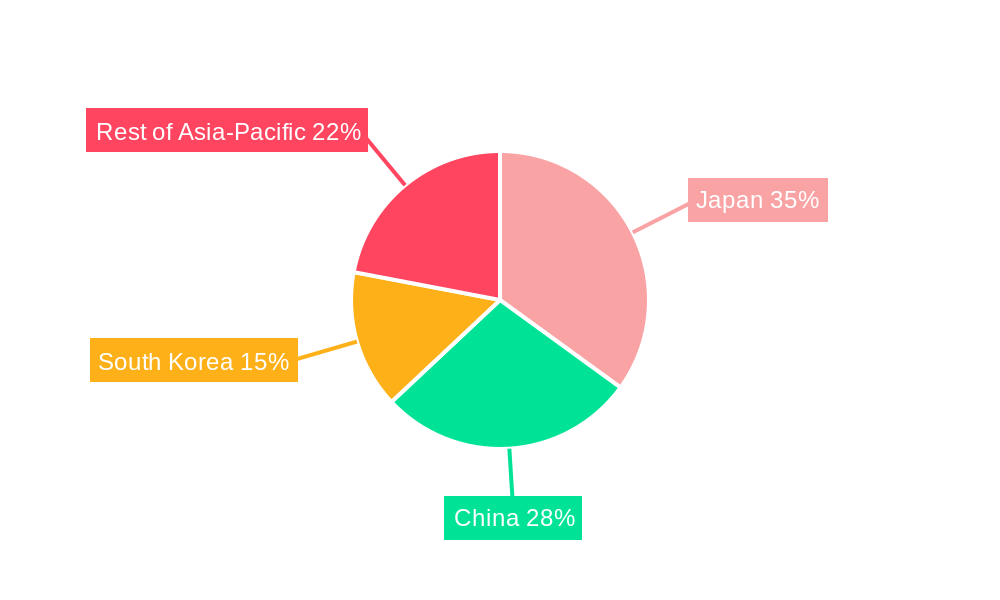
Japan dominates the APAC nuclear power reactor decommissioning market due to the significant number of aging reactors and the aftermath of the Fukushima Daiichi disaster. China is a rapidly expanding segment, driven by the increasing number of commercial reactors nearing decommissioning age. The “Rest of Asia-Pacific” segment presents a substantial but fragmented opportunity with pockets of high growth potential. In terms of reactor type, Pressurized Water Reactors (PWRs) and Boiling Water Reactors (BWRs) represent the largest share of the decommissioning market, followed by Pressurized Heavy Water Reactors (PHWRs). The commercial power reactor segment accounts for the largest share of the application-based market segmentation. Reactors with capacities between 100-1000 MW constitute the most significant segment by capacity.
- Japan: Dominant due to Fukushima and aging reactors; Market size xx million in 2024, projected to reach xx million by 2033.
- China: Rapid growth driven by increasing number of aging reactors; Market size xx million in 2024, projected to reach xx million by 2033.
- Reactor Type: PWRs and BWRs dominate, followed by PHWRs.
- Capacity: 100-1000 MW segment holds the largest market share.
APAP Nuclear Power Reactor Decommissioning Industry Product Landscape
The APAP nuclear power reactor decommissioning industry offers a range of specialized products and services, including robotics for dismantling, remote handling systems, waste treatment technologies, and decommissioning project management. Recent innovations focus on improved safety, efficiency, and reduced environmental impact. Unique selling propositions often center on advanced technologies, customized solutions, and proven track records in challenging decommissioning projects. Technological advancements are continuously enhancing precision, reducing human exposure, and improving waste management techniques.
Key Drivers, Barriers & Challenges in APAC Nuclear Power Reactor Decommissioning Industry
Key Drivers:
- Aging nuclear power plant fleet requiring decommissioning.
- Stringent regulatory requirements for nuclear waste disposal.
- Growing environmental concerns related to nuclear waste.
- Technological advancements enhancing decommissioning efficiency.
Key Challenges:
- High decommissioning costs representing a significant financial burden.
- Complex regulatory processes and licensing requirements.
- Skilled labor shortages and specialized expertise required.
- Potential public opposition to decommissioning projects. The Fukushima decommissioning project, with estimated costs reaching USD 76 billion, illustrates the scale of challenges.
Emerging Opportunities in APAP Nuclear Power Reactor Decommissioning Industry
- Development of advanced robotics and AI-driven decommissioning systems.
- Expansion into emerging markets with growing numbers of aging reactors.
- Innovative waste management solutions focusing on recycling and minimization.
- Growing demand for specialized decommissioning expertise and consulting services.
Growth Accelerators in the APAC Nuclear Power Reactor Decommissioning Industry Industry
Technological breakthroughs, particularly in robotics and waste treatment, are significantly accelerating market growth. Strategic partnerships between technology providers and decommissioning contractors are fostering innovation. Expansion into new markets, including those with smaller reactor fleets, and proactive engagement with regulatory bodies are also contributing to long-term growth.
Key Players Shaping the APAC Nuclear Power Reactor Decommissioning Industry Market
- Toshiba Corp
- Korea Hydro & Nuclear Power Co Ltd
- Orano SA
- TÜV Rheinland Group
- Snc-Lavalin Group Inc (Atkins)
- The Japan Atomic Power Co
- GE- Hitachi Nuclear Energy Ltd
- Tokyo Electric Power Company Holdings Inc
Notable Milestones in APAC Nuclear Power Reactor Decommissioning Industry Sector
- May 2022: Jacobs selected by Tepco to support Fukushima Daiichi decommissioning.
- January 2022: Japan announces plan to release treated wastewater from Fukushima.
In-Depth APAC Nuclear Power Reactor Decommissioning Industry Market Outlook
The APAC nuclear power reactor decommissioning market is poised for sustained growth, driven by a confluence of factors including aging reactor fleets, regulatory pressures, technological advancements, and increasing awareness of environmental responsibility. Strategic opportunities lie in the development of innovative technologies, the expansion into new markets, and the formation of strategic partnerships to address the considerable challenges associated with large-scale decommissioning projects. The market's long-term potential is substantial, with significant opportunities for companies that can effectively navigate the technical, regulatory, and financial complexities of this sector.
APAC Nuclear Power Reactor Decommissioning Industry Segmentation
-
1. Reactor Type
- 1.1. Pressurized Water Reactor
- 1.2. Pressurized Heavy Water Reactor
- 1.3. Boiling Water Reactor
- 1.4. High-temperature Gas-cooled Reactor
- 1.5. Liquid Metal Fast Breeder Reactor
- 1.6. Other Reactor Types
-
2. Application
- 2.1. Commercial Power Reactor
- 2.2. Prototype Power Reactor
- 2.3. Research Reactor
-
3. Capacity
- 3.1. Below 100 MW
- 3.2. 100-1000 MW
- 3.3. Above 1000 MW
APAC Nuclear Power Reactor Decommissioning Industry Segmentation By Geography
-
1. North America
- 1.1. United States
- 1.2. Canada
- 1.3. Mexico
-
2. South America
- 2.1. Brazil
- 2.2. Argentina
- 2.3. Rest of South America
-
3. Europe
- 3.1. United Kingdom
- 3.2. Germany
- 3.3. France
- 3.4. Italy
- 3.5. Spain
- 3.6. Russia
- 3.7. Benelux
- 3.8. Nordics
- 3.9. Rest of Europe
-
4. Middle East & Africa
- 4.1. Turkey
- 4.2. Israel
- 4.3. GCC
- 4.4. North Africa
- 4.5. South Africa
- 4.6. Rest of Middle East & Africa
-
5. Asia Pacific
- 5.1. China
- 5.2. India
- 5.3. Japan
- 5.4. South Korea
- 5.5. ASEAN
- 5.6. Oceania
- 5.7. Rest of Asia Pacific
APAC Nuclear Power Reactor Decommissioning Industry Regional Market Share
Geographic Coverage of APAC Nuclear Power Reactor Decommissioning Industry
APAC Nuclear Power Reactor Decommissioning Industry REPORT HIGHLIGHTS
| Aspects | Details |
|---|---|
| Study Period | 2020-2034 |
| Base Year | 2025 |
| Estimated Year | 2026 |
| Forecast Period | 2026-2034 |
| Historical Period | 2020-2025 |
| Growth Rate | CAGR of 3.59% from 2020-2034 |
| Segmentation |
|
Table of Contents
- 1. Introduction
- 1.1. Research Scope
- 1.2. Market Segmentation
- 1.3. Research Objective
- 1.4. Definitions and Assumptions
- 2. Executive Summary
- 2.1. Market Snapshot
- 3. Market Dynamics
- 3.1. Market Drivers
- 3.2. Market Restrains
- 3.3. Market Trends
- 3.4. Market Opportunities
- 4. Market Factor Analysis
- 4.1. Porters Five Forces
- 4.1.1. Bargaining Power of Suppliers
- 4.1.2. Bargaining Power of Buyers
- 4.1.3. Threat of New Entrants
- 4.1.4. Threat of Substitutes
- 4.1.5. Competitive Rivalry
- 4.2. PESTEL analysis
- 4.3. BCG Analysis
- 4.3.1. Stars (High Growth, High Market Share)
- 4.3.2. Cash Cows (Low Growth, High Market Share)
- 4.3.3. Question Mark (High Growth, Low Market Share)
- 4.3.4. Dogs (Low Growth, Low Market Share)
- 4.4. Ansoff Matrix Analysis
- 4.5. Supply Chain Analysis
- 4.6. Regulatory Landscape
- 4.7. Current Market Potential and Opportunity Assessment (TAM–SAM–SOM Framework)
- 4.8. VDR Analyst Note
- 4.1. Porters Five Forces
- 5. Market Analysis, Insights and Forecast 2021-2033
- 5.1. Market Analysis, Insights and Forecast - by Reactor Type
- 5.1.1. Pressurized Water Reactor
- 5.1.2. Pressurized Heavy Water Reactor
- 5.1.3. Boiling Water Reactor
- 5.1.4. High-temperature Gas-cooled Reactor
- 5.1.5. Liquid Metal Fast Breeder Reactor
- 5.1.6. Other Reactor Types
- 5.2. Market Analysis, Insights and Forecast - by Application
- 5.2.1. Commercial Power Reactor
- 5.2.2. Prototype Power Reactor
- 5.2.3. Research Reactor
- 5.3. Market Analysis, Insights and Forecast - by Capacity
- 5.3.1. Below 100 MW
- 5.3.2. 100-1000 MW
- 5.3.3. Above 1000 MW
- 5.4. Market Analysis, Insights and Forecast - by Region
- 5.4.1. North America
- 5.4.2. South America
- 5.4.3. Europe
- 5.4.4. Middle East & Africa
- 5.4.5. Asia Pacific
- 5.1. Market Analysis, Insights and Forecast - by Reactor Type
- 6. Global APAC Nuclear Power Reactor Decommissioning Industry Analysis, Insights and Forecast, 2021-2033
- 6.1. Market Analysis, Insights and Forecast - by Reactor Type
- 6.1.1. Pressurized Water Reactor
- 6.1.2. Pressurized Heavy Water Reactor
- 6.1.3. Boiling Water Reactor
- 6.1.4. High-temperature Gas-cooled Reactor
- 6.1.5. Liquid Metal Fast Breeder Reactor
- 6.1.6. Other Reactor Types
- 6.2. Market Analysis, Insights and Forecast - by Application
- 6.2.1. Commercial Power Reactor
- 6.2.2. Prototype Power Reactor
- 6.2.3. Research Reactor
- 6.3. Market Analysis, Insights and Forecast - by Capacity
- 6.3.1. Below 100 MW
- 6.3.2. 100-1000 MW
- 6.3.3. Above 1000 MW
- 6.1. Market Analysis, Insights and Forecast - by Reactor Type
- 7. North America APAC Nuclear Power Reactor Decommissioning Industry Analysis, Insights and Forecast, 2021-2033
- 7.1. Market Analysis, Insights and Forecast - by Reactor Type
- 7.1.1. Pressurized Water Reactor
- 7.1.2. Pressurized Heavy Water Reactor
- 7.1.3. Boiling Water Reactor
- 7.1.4. High-temperature Gas-cooled Reactor
- 7.1.5. Liquid Metal Fast Breeder Reactor
- 7.1.6. Other Reactor Types
- 7.2. Market Analysis, Insights and Forecast - by Application
- 7.2.1. Commercial Power Reactor
- 7.2.2. Prototype Power Reactor
- 7.2.3. Research Reactor
- 7.3. Market Analysis, Insights and Forecast - by Capacity
- 7.3.1. Below 100 MW
- 7.3.2. 100-1000 MW
- 7.3.3. Above 1000 MW
- 7.1. Market Analysis, Insights and Forecast - by Reactor Type
- 8. South America APAC Nuclear Power Reactor Decommissioning Industry Analysis, Insights and Forecast, 2021-2033
- 8.1. Market Analysis, Insights and Forecast - by Reactor Type
- 8.1.1. Pressurized Water Reactor
- 8.1.2. Pressurized Heavy Water Reactor
- 8.1.3. Boiling Water Reactor
- 8.1.4. High-temperature Gas-cooled Reactor
- 8.1.5. Liquid Metal Fast Breeder Reactor
- 8.1.6. Other Reactor Types
- 8.2. Market Analysis, Insights and Forecast - by Application
- 8.2.1. Commercial Power Reactor
- 8.2.2. Prototype Power Reactor
- 8.2.3. Research Reactor
- 8.3. Market Analysis, Insights and Forecast - by Capacity
- 8.3.1. Below 100 MW
- 8.3.2. 100-1000 MW
- 8.3.3. Above 1000 MW
- 8.1. Market Analysis, Insights and Forecast - by Reactor Type
- 9. Europe APAC Nuclear Power Reactor Decommissioning Industry Analysis, Insights and Forecast, 2021-2033
- 9.1. Market Analysis, Insights and Forecast - by Reactor Type
- 9.1.1. Pressurized Water Reactor
- 9.1.2. Pressurized Heavy Water Reactor
- 9.1.3. Boiling Water Reactor
- 9.1.4. High-temperature Gas-cooled Reactor
- 9.1.5. Liquid Metal Fast Breeder Reactor
- 9.1.6. Other Reactor Types
- 9.2. Market Analysis, Insights and Forecast - by Application
- 9.2.1. Commercial Power Reactor
- 9.2.2. Prototype Power Reactor
- 9.2.3. Research Reactor
- 9.3. Market Analysis, Insights and Forecast - by Capacity
- 9.3.1. Below 100 MW
- 9.3.2. 100-1000 MW
- 9.3.3. Above 1000 MW
- 9.1. Market Analysis, Insights and Forecast - by Reactor Type
- 10. Middle East & Africa APAC Nuclear Power Reactor Decommissioning Industry Analysis, Insights and Forecast, 2021-2033
- 10.1. Market Analysis, Insights and Forecast - by Reactor Type
- 10.1.1. Pressurized Water Reactor
- 10.1.2. Pressurized Heavy Water Reactor
- 10.1.3. Boiling Water Reactor
- 10.1.4. High-temperature Gas-cooled Reactor
- 10.1.5. Liquid Metal Fast Breeder Reactor
- 10.1.6. Other Reactor Types
- 10.2. Market Analysis, Insights and Forecast - by Application
- 10.2.1. Commercial Power Reactor
- 10.2.2. Prototype Power Reactor
- 10.2.3. Research Reactor
- 10.3. Market Analysis, Insights and Forecast - by Capacity
- 10.3.1. Below 100 MW
- 10.3.2. 100-1000 MW
- 10.3.3. Above 1000 MW
- 10.1. Market Analysis, Insights and Forecast - by Reactor Type
- 11. Asia Pacific APAC Nuclear Power Reactor Decommissioning Industry Analysis, Insights and Forecast, 2021-2033
- 11.1. Market Analysis, Insights and Forecast - by Reactor Type
- 11.1.1. Pressurized Water Reactor
- 11.1.2. Pressurized Heavy Water Reactor
- 11.1.3. Boiling Water Reactor
- 11.1.4. High-temperature Gas-cooled Reactor
- 11.1.5. Liquid Metal Fast Breeder Reactor
- 11.1.6. Other Reactor Types
- 11.2. Market Analysis, Insights and Forecast - by Application
- 11.2.1. Commercial Power Reactor
- 11.2.2. Prototype Power Reactor
- 11.2.3. Research Reactor
- 11.3. Market Analysis, Insights and Forecast - by Capacity
- 11.3.1. Below 100 MW
- 11.3.2. 100-1000 MW
- 11.3.3. Above 1000 MW
- 11.1. Market Analysis, Insights and Forecast - by Reactor Type
- 12. Competitive Analysis
- 12.1. Company Profiles
- 12.1.1 Toshiba Corp*List Not Exhaustive
- 12.1.1.1. Company Overview
- 12.1.1.2. Products
- 12.1.1.3. Company Financials
- 12.1.1.4. SWOT Analysis
- 12.1.2 Korea Hydro & Nuclear Power Co Ltd
- 12.1.2.1. Company Overview
- 12.1.2.2. Products
- 12.1.2.3. Company Financials
- 12.1.2.4. SWOT Analysis
- 12.1.3 Orano SA
- 12.1.3.1. Company Overview
- 12.1.3.2. Products
- 12.1.3.3. Company Financials
- 12.1.3.4. SWOT Analysis
- 12.1.4 TÜV Rheinland Group
- 12.1.4.1. Company Overview
- 12.1.4.2. Products
- 12.1.4.3. Company Financials
- 12.1.4.4. SWOT Analysis
- 12.1.5 Snc-Lavalin Group Inc (Atkins)
- 12.1.5.1. Company Overview
- 12.1.5.2. Products
- 12.1.5.3. Company Financials
- 12.1.5.4. SWOT Analysis
- 12.1.6 The Japan Atomic Power Co
- 12.1.6.1. Company Overview
- 12.1.6.2. Products
- 12.1.6.3. Company Financials
- 12.1.6.4. SWOT Analysis
- 12.1.7 GE- Hitachi Nuclear Energy Ltd
- 12.1.7.1. Company Overview
- 12.1.7.2. Products
- 12.1.7.3. Company Financials
- 12.1.7.4. SWOT Analysis
- 12.1.8 Tokyo Electric Power Company Holdings Inc
- 12.1.8.1. Company Overview
- 12.1.8.2. Products
- 12.1.8.3. Company Financials
- 12.1.8.4. SWOT Analysis
- 12.1.1 Toshiba Corp*List Not Exhaustive
- 12.2. Market Entropy
- 12.2.1 Company's Key Areas Served
- 12.2.2 Recent Developments
- 12.3. Company Market Share Analysis 2025
- 12.3.1 Top 5 Companies Market Share Analysis
- 12.3.2 Top 3 Companies Market Share Analysis
- 12.4. List of Potential Customers
- 13. Research Methodology
List of Figures
- Figure 1: Global APAC Nuclear Power Reactor Decommissioning Industry Revenue Breakdown (billion, %) by Region 2025 & 2033
- Figure 2: North America APAC Nuclear Power Reactor Decommissioning Industry Revenue (billion), by Reactor Type 2025 & 2033
- Figure 3: North America APAC Nuclear Power Reactor Decommissioning Industry Revenue Share (%), by Reactor Type 2025 & 2033
- Figure 4: North America APAC Nuclear Power Reactor Decommissioning Industry Revenue (billion), by Application 2025 & 2033
- Figure 5: North America APAC Nuclear Power Reactor Decommissioning Industry Revenue Share (%), by Application 2025 & 2033
- Figure 6: North America APAC Nuclear Power Reactor Decommissioning Industry Revenue (billion), by Capacity 2025 & 2033
- Figure 7: North America APAC Nuclear Power Reactor Decommissioning Industry Revenue Share (%), by Capacity 2025 & 2033
- Figure 8: North America APAC Nuclear Power Reactor Decommissioning Industry Revenue (billion), by Country 2025 & 2033
- Figure 9: North America APAC Nuclear Power Reactor Decommissioning Industry Revenue Share (%), by Country 2025 & 2033
- Figure 10: South America APAC Nuclear Power Reactor Decommissioning Industry Revenue (billion), by Reactor Type 2025 & 2033
- Figure 11: South America APAC Nuclear Power Reactor Decommissioning Industry Revenue Share (%), by Reactor Type 2025 & 2033
- Figure 12: South America APAC Nuclear Power Reactor Decommissioning Industry Revenue (billion), by Application 2025 & 2033
- Figure 13: South America APAC Nuclear Power Reactor Decommissioning Industry Revenue Share (%), by Application 2025 & 2033
- Figure 14: South America APAC Nuclear Power Reactor Decommissioning Industry Revenue (billion), by Capacity 2025 & 2033
- Figure 15: South America APAC Nuclear Power Reactor Decommissioning Industry Revenue Share (%), by Capacity 2025 & 2033
- Figure 16: South America APAC Nuclear Power Reactor Decommissioning Industry Revenue (billion), by Country 2025 & 2033
- Figure 17: South America APAC Nuclear Power Reactor Decommissioning Industry Revenue Share (%), by Country 2025 & 2033
- Figure 18: Europe APAC Nuclear Power Reactor Decommissioning Industry Revenue (billion), by Reactor Type 2025 & 2033
- Figure 19: Europe APAC Nuclear Power Reactor Decommissioning Industry Revenue Share (%), by Reactor Type 2025 & 2033
- Figure 20: Europe APAC Nuclear Power Reactor Decommissioning Industry Revenue (billion), by Application 2025 & 2033
- Figure 21: Europe APAC Nuclear Power Reactor Decommissioning Industry Revenue Share (%), by Application 2025 & 2033
- Figure 22: Europe APAC Nuclear Power Reactor Decommissioning Industry Revenue (billion), by Capacity 2025 & 2033
- Figure 23: Europe APAC Nuclear Power Reactor Decommissioning Industry Revenue Share (%), by Capacity 2025 & 2033
- Figure 24: Europe APAC Nuclear Power Reactor Decommissioning Industry Revenue (billion), by Country 2025 & 2033
- Figure 25: Europe APAC Nuclear Power Reactor Decommissioning Industry Revenue Share (%), by Country 2025 & 2033
- Figure 26: Middle East & Africa APAC Nuclear Power Reactor Decommissioning Industry Revenue (billion), by Reactor Type 2025 & 2033
- Figure 27: Middle East & Africa APAC Nuclear Power Reactor Decommissioning Industry Revenue Share (%), by Reactor Type 2025 & 2033
- Figure 28: Middle East & Africa APAC Nuclear Power Reactor Decommissioning Industry Revenue (billion), by Application 2025 & 2033
- Figure 29: Middle East & Africa APAC Nuclear Power Reactor Decommissioning Industry Revenue Share (%), by Application 2025 & 2033
- Figure 30: Middle East & Africa APAC Nuclear Power Reactor Decommissioning Industry Revenue (billion), by Capacity 2025 & 2033
- Figure 31: Middle East & Africa APAC Nuclear Power Reactor Decommissioning Industry Revenue Share (%), by Capacity 2025 & 2033
- Figure 32: Middle East & Africa APAC Nuclear Power Reactor Decommissioning Industry Revenue (billion), by Country 2025 & 2033
- Figure 33: Middle East & Africa APAC Nuclear Power Reactor Decommissioning Industry Revenue Share (%), by Country 2025 & 2033
- Figure 34: Asia Pacific APAC Nuclear Power Reactor Decommissioning Industry Revenue (billion), by Reactor Type 2025 & 2033
- Figure 35: Asia Pacific APAC Nuclear Power Reactor Decommissioning Industry Revenue Share (%), by Reactor Type 2025 & 2033
- Figure 36: Asia Pacific APAC Nuclear Power Reactor Decommissioning Industry Revenue (billion), by Application 2025 & 2033
- Figure 37: Asia Pacific APAC Nuclear Power Reactor Decommissioning Industry Revenue Share (%), by Application 2025 & 2033
- Figure 38: Asia Pacific APAC Nuclear Power Reactor Decommissioning Industry Revenue (billion), by Capacity 2025 & 2033
- Figure 39: Asia Pacific APAC Nuclear Power Reactor Decommissioning Industry Revenue Share (%), by Capacity 2025 & 2033
- Figure 40: Asia Pacific APAC Nuclear Power Reactor Decommissioning Industry Revenue (billion), by Country 2025 & 2033
- Figure 41: Asia Pacific APAC Nuclear Power Reactor Decommissioning Industry Revenue Share (%), by Country 2025 & 2033
List of Tables
- Table 1: Global APAC Nuclear Power Reactor Decommissioning Industry Revenue billion Forecast, by Reactor Type 2020 & 2033
- Table 2: Global APAC Nuclear Power Reactor Decommissioning Industry Revenue billion Forecast, by Application 2020 & 2033
- Table 3: Global APAC Nuclear Power Reactor Decommissioning Industry Revenue billion Forecast, by Capacity 2020 & 2033
- Table 4: Global APAC Nuclear Power Reactor Decommissioning Industry Revenue billion Forecast, by Region 2020 & 2033
- Table 5: Global APAC Nuclear Power Reactor Decommissioning Industry Revenue billion Forecast, by Reactor Type 2020 & 2033
- Table 6: Global APAC Nuclear Power Reactor Decommissioning Industry Revenue billion Forecast, by Application 2020 & 2033
- Table 7: Global APAC Nuclear Power Reactor Decommissioning Industry Revenue billion Forecast, by Capacity 2020 & 2033
- Table 8: Global APAC Nuclear Power Reactor Decommissioning Industry Revenue billion Forecast, by Country 2020 & 2033
- Table 9: United States APAC Nuclear Power Reactor Decommissioning Industry Revenue (billion) Forecast, by Application 2020 & 2033
- Table 10: Canada APAC Nuclear Power Reactor Decommissioning Industry Revenue (billion) Forecast, by Application 2020 & 2033
- Table 11: Mexico APAC Nuclear Power Reactor Decommissioning Industry Revenue (billion) Forecast, by Application 2020 & 2033
- Table 12: Global APAC Nuclear Power Reactor Decommissioning Industry Revenue billion Forecast, by Reactor Type 2020 & 2033
- Table 13: Global APAC Nuclear Power Reactor Decommissioning Industry Revenue billion Forecast, by Application 2020 & 2033
- Table 14: Global APAC Nuclear Power Reactor Decommissioning Industry Revenue billion Forecast, by Capacity 2020 & 2033
- Table 15: Global APAC Nuclear Power Reactor Decommissioning Industry Revenue billion Forecast, by Country 2020 & 2033
- Table 16: Brazil APAC Nuclear Power Reactor Decommissioning Industry Revenue (billion) Forecast, by Application 2020 & 2033
- Table 17: Argentina APAC Nuclear Power Reactor Decommissioning Industry Revenue (billion) Forecast, by Application 2020 & 2033
- Table 18: Rest of South America APAC Nuclear Power Reactor Decommissioning Industry Revenue (billion) Forecast, by Application 2020 & 2033
- Table 19: Global APAC Nuclear Power Reactor Decommissioning Industry Revenue billion Forecast, by Reactor Type 2020 & 2033
- Table 20: Global APAC Nuclear Power Reactor Decommissioning Industry Revenue billion Forecast, by Application 2020 & 2033
- Table 21: Global APAC Nuclear Power Reactor Decommissioning Industry Revenue billion Forecast, by Capacity 2020 & 2033
- Table 22: Global APAC Nuclear Power Reactor Decommissioning Industry Revenue billion Forecast, by Country 2020 & 2033
- Table 23: United Kingdom APAC Nuclear Power Reactor Decommissioning Industry Revenue (billion) Forecast, by Application 2020 & 2033
- Table 24: Germany APAC Nuclear Power Reactor Decommissioning Industry Revenue (billion) Forecast, by Application 2020 & 2033
- Table 25: France APAC Nuclear Power Reactor Decommissioning Industry Revenue (billion) Forecast, by Application 2020 & 2033
- Table 26: Italy APAC Nuclear Power Reactor Decommissioning Industry Revenue (billion) Forecast, by Application 2020 & 2033
- Table 27: Spain APAC Nuclear Power Reactor Decommissioning Industry Revenue (billion) Forecast, by Application 2020 & 2033
- Table 28: Russia APAC Nuclear Power Reactor Decommissioning Industry Revenue (billion) Forecast, by Application 2020 & 2033
- Table 29: Benelux APAC Nuclear Power Reactor Decommissioning Industry Revenue (billion) Forecast, by Application 2020 & 2033
- Table 30: Nordics APAC Nuclear Power Reactor Decommissioning Industry Revenue (billion) Forecast, by Application 2020 & 2033
- Table 31: Rest of Europe APAC Nuclear Power Reactor Decommissioning Industry Revenue (billion) Forecast, by Application 2020 & 2033
- Table 32: Global APAC Nuclear Power Reactor Decommissioning Industry Revenue billion Forecast, by Reactor Type 2020 & 2033
- Table 33: Global APAC Nuclear Power Reactor Decommissioning Industry Revenue billion Forecast, by Application 2020 & 2033
- Table 34: Global APAC Nuclear Power Reactor Decommissioning Industry Revenue billion Forecast, by Capacity 2020 & 2033
- Table 35: Global APAC Nuclear Power Reactor Decommissioning Industry Revenue billion Forecast, by Country 2020 & 2033
- Table 36: Turkey APAC Nuclear Power Reactor Decommissioning Industry Revenue (billion) Forecast, by Application 2020 & 2033
- Table 37: Israel APAC Nuclear Power Reactor Decommissioning Industry Revenue (billion) Forecast, by Application 2020 & 2033
- Table 38: GCC APAC Nuclear Power Reactor Decommissioning Industry Revenue (billion) Forecast, by Application 2020 & 2033
- Table 39: North Africa APAC Nuclear Power Reactor Decommissioning Industry Revenue (billion) Forecast, by Application 2020 & 2033
- Table 40: South Africa APAC Nuclear Power Reactor Decommissioning Industry Revenue (billion) Forecast, by Application 2020 & 2033
- Table 41: Rest of Middle East & Africa APAC Nuclear Power Reactor Decommissioning Industry Revenue (billion) Forecast, by Application 2020 & 2033
- Table 42: Global APAC Nuclear Power Reactor Decommissioning Industry Revenue billion Forecast, by Reactor Type 2020 & 2033
- Table 43: Global APAC Nuclear Power Reactor Decommissioning Industry Revenue billion Forecast, by Application 2020 & 2033
- Table 44: Global APAC Nuclear Power Reactor Decommissioning Industry Revenue billion Forecast, by Capacity 2020 & 2033
- Table 45: Global APAC Nuclear Power Reactor Decommissioning Industry Revenue billion Forecast, by Country 2020 & 2033
- Table 46: China APAC Nuclear Power Reactor Decommissioning Industry Revenue (billion) Forecast, by Application 2020 & 2033
- Table 47: India APAC Nuclear Power Reactor Decommissioning Industry Revenue (billion) Forecast, by Application 2020 & 2033
- Table 48: Japan APAC Nuclear Power Reactor Decommissioning Industry Revenue (billion) Forecast, by Application 2020 & 2033
- Table 49: South Korea APAC Nuclear Power Reactor Decommissioning Industry Revenue (billion) Forecast, by Application 2020 & 2033
- Table 50: ASEAN APAC Nuclear Power Reactor Decommissioning Industry Revenue (billion) Forecast, by Application 2020 & 2033
- Table 51: Oceania APAC Nuclear Power Reactor Decommissioning Industry Revenue (billion) Forecast, by Application 2020 & 2033
- Table 52: Rest of Asia Pacific APAC Nuclear Power Reactor Decommissioning Industry Revenue (billion) Forecast, by Application 2020 & 2033
Frequently Asked Questions
1. What is the projected Compound Annual Growth Rate (CAGR) of the APAC Nuclear Power Reactor Decommissioning Industry?
The projected CAGR is approximately 3.59%.
2. Which companies are prominent players in the APAC Nuclear Power Reactor Decommissioning Industry?
Key companies in the market include Toshiba Corp*List Not Exhaustive, Korea Hydro & Nuclear Power Co Ltd, Orano SA, TÜV Rheinland Group, Snc-Lavalin Group Inc (Atkins), The Japan Atomic Power Co, GE- Hitachi Nuclear Energy Ltd, Tokyo Electric Power Company Holdings Inc.
3. What are the main segments of the APAC Nuclear Power Reactor Decommissioning Industry?
The market segments include Reactor Type, Application, Capacity.
4. Can you provide details about the market size?
The market size is estimated to be USD 8.01 billion as of 2022.
5. What are some drivers contributing to market growth?
Rising Demand for Reliable Electricity; Increasing Government Support for Hydropower Generation.
6. What are the notable trends driving market growth?
Commercial Power Reactor Expected to Dominate the Market.
7. Are there any restraints impacting market growth?
Negative Environmental Consequences of Hydropower Projects.
8. Can you provide examples of recent developments in the market?
May 2022: USA-based engineering group Jacobs has been selected by Tokyo Electric Power Company (Tepco) to support decommissioning efforts at its damaged Fukushima Daiichi nuclear power plant in Japan.
9. What pricing options are available for accessing the report?
Pricing options include single-user, multi-user, and enterprise licenses priced at USD 4750, USD 5250, and USD 8750 respectively.
10. Is the market size provided in terms of value or volume?
The market size is provided in terms of value, measured in billion.
11. Are there any specific market keywords associated with the report?
Yes, the market keyword associated with the report is "APAC Nuclear Power Reactor Decommissioning Industry," which aids in identifying and referencing the specific market segment covered.
12. How do I determine which pricing option suits my needs best?
The pricing options vary based on user requirements and access needs. Individual users may opt for single-user licenses, while businesses requiring broader access may choose multi-user or enterprise licenses for cost-effective access to the report.
13. Are there any additional resources or data provided in the APAC Nuclear Power Reactor Decommissioning Industry report?
While the report offers comprehensive insights, it's advisable to review the specific contents or supplementary materials provided to ascertain if additional resources or data are available.
14. How can I stay updated on further developments or reports in the APAC Nuclear Power Reactor Decommissioning Industry?
To stay informed about further developments, trends, and reports in the APAC Nuclear Power Reactor Decommissioning Industry, consider subscribing to industry newsletters, following relevant companies and organizations, or regularly checking reputable industry news sources and publications.
Methodology
Step 1 - Identification of Relevant Samples Size from Population Database


Step 2 - Approaches for Defining Global Market Size (Value, Volume* & Price*)

Note*: In applicable scenarios
Step 3 - Data Sources
Primary Research
- Web Analytics
- Survey Reports
- Research Institute
- Latest Research Reports
- Opinion Leaders
Secondary Research
- Annual Reports
- White Paper
- Latest Press Release
- Industry Association
- Paid Database
- Investor Presentations

Step 4 - Data Triangulation
Involves using different sources of information in order to increase the validity of a study
These sources are likely to be stakeholders in a program - participants, other researchers, program staff, other community members, and so on.
Then we put all data in single framework & apply various statistical tools to find out the dynamic on the market.
During the analysis stage, feedback from the stakeholder groups would be compared to determine areas of agreement as well as areas of divergence