

Key Insights
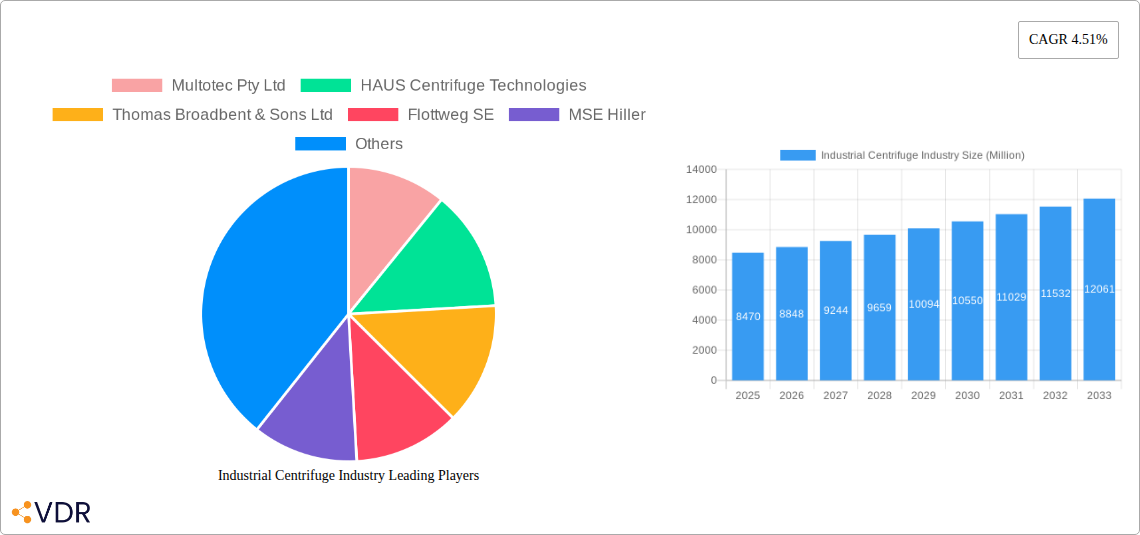
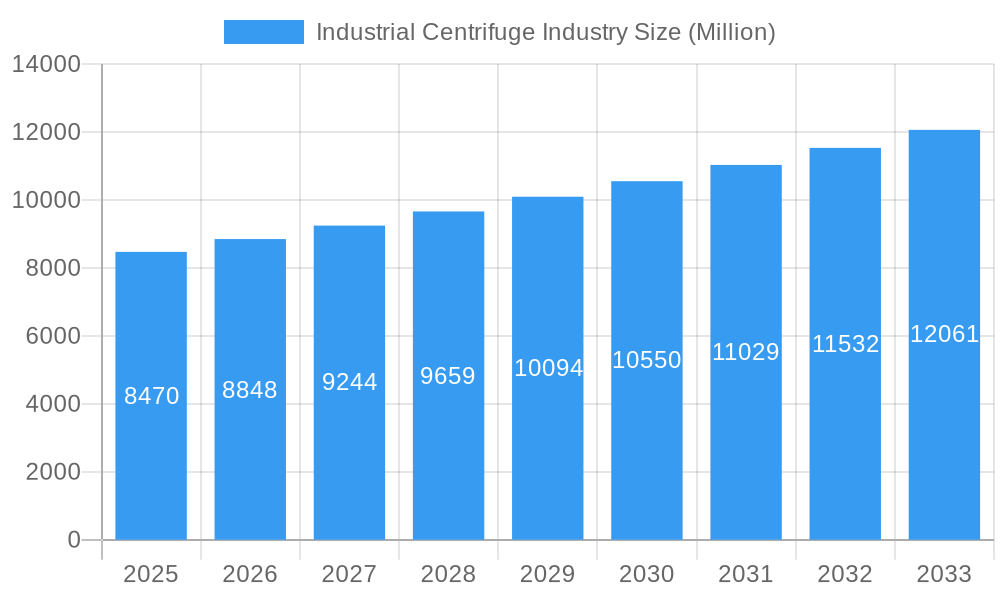
The global industrial centrifuge market is poised for significant growth, projected to reach $8.47 billion by 2025, with a Compound Annual Growth Rate (CAGR) of 4.51% anticipated throughout the forecast period of 2025-2033. This robust expansion is fueled by increasing demand across diverse industries, particularly in water and wastewater treatment, where stringent environmental regulations necessitate efficient separation processes. The pharmaceutical sector also presents a substantial growth opportunity, driven by the rising production of biopharmaceuticals and the need for high-purity separation. Furthermore, the food and beverage industry's focus on quality and efficiency in processing, along with the metal and mining sector's requirement for effective dewatering and solid-liquid separation, are significant market drivers. Technological advancements, such as the development of more energy-efficient and automated centrifuge designs, are also contributing to market vitality.
Industrial Centrifuge Industry Market Size (In Billion)
The market segmentation reveals a strong preference for continuous operation centrifuges, reflecting the need for high throughput in industrial settings. Sedimentation centrifuges, particularly decanter and disc stack types, are expected to dominate the market due to their versatility in handling a wide range of solid-liquid separation applications. Geographically, the Asia Pacific region is emerging as a pivotal market, driven by rapid industrialization and increasing investments in infrastructure and manufacturing in countries like China and India. North America and Europe remain mature yet strong markets, benefiting from established industries and continuous technological innovation. However, the market faces some restraints, including the high initial capital investment required for advanced centrifuge systems and the operational complexities associated with certain models, which could temper growth in specific segments.
Industrial Centrifuge Industry Company Market Share
Industrial Centrifuge Industry Report: Market Analysis & Future Outlook (2019-2033)
This comprehensive report offers an in-depth analysis of the global Industrial Centrifuge market, encompassing market size, growth drivers, segmentation, competitive landscape, and future trends. With a study period spanning from 2019 to 2033, and a base year of 2025, this report provides critical insights for stakeholders looking to capitalize on the evolving opportunities within this vital industrial sector. We delve into parent and child markets to provide a holistic view of market dynamics.
Industrial Centrifuge Industry Market Dynamics & Structure
The industrial centrifuge market exhibits a moderately concentrated structure, with key players like Alfa Laval AB, GEA Group AG, and Andritz AG holding significant market shares. Technological innovation is a primary driver, fueled by the constant need for enhanced separation efficiency, energy savings, and process automation across diverse industries. Regulatory frameworks, particularly concerning environmental protection and safety standards in water treatment and chemical processing, also shape market development. While industrial centrifuges offer superior separation capabilities compared to simpler filtration methods, competition from advanced filtration technologies and membrane separation systems presents a degree of product substitutability. End-user demographics are increasingly sophisticated, demanding tailored solutions for specific applications, driving customization and specialized product development. Mergers and acquisitions (M&A) remain a strategic tool for market consolidation and expansion, as companies seek to broaden their product portfolios and geographical reach. Innovation barriers include the high capital investment required for research and development, stringent quality control demands, and the lengthy product lifecycle typical of industrial equipment. The market is anticipated to see approximately XX million units of centrifuges sold globally in the estimated year 2025.
Industrial Centrifuge Industry Growth Trends & Insights
The global industrial centrifuge market is poised for robust growth, projected to expand at a Compound Annual Growth Rate (CAGR) of approximately 5.8% during the forecast period of 2025–2033. This expansion is underpinned by a confluence of factors, including escalating demand from burgeoning industries such as pharmaceuticals, food and beverages, and water and wastewater treatment, coupled with a growing emphasis on resource recovery and waste minimization. The adoption rate of advanced centrifuge technologies is steadily increasing, driven by their inherent efficiency, cost-effectiveness, and environmental benefits. Technological disruptions are playing a pivotal role, with advancements in automation, AI-powered control systems, and smart sensor integration enhancing operational performance and predictive maintenance capabilities. For instance, the integration of AI promises quicker data analysis and self-optimization, as seen with GEA's X Control system. Consumer behavior shifts are also influencing market dynamics, with an increasing preference for sustainable and energy-efficient separation solutions. The market size is estimated to reach USD XX billion by 2033, up from an estimated USD XX billion in 2025, with the sales volume projected to grow from XX million units in 2025 to XX million units by 2033. The parent market, encompassing all separation technologies, is significantly larger, with industrial centrifuges capturing a substantial share due to their versatility and reliability.
Dominant Regions, Countries, or Segments in Industrial Centrifuge Industry
The Water and Wastewater Treatment industry segment stands out as a dominant force driving growth within the global industrial centrifuge market. This critical sector's expansion is propelled by increasing global urbanization, stricter environmental regulations mandating efficient sludge dewatering and water purification, and the growing need for resource recovery from wastewater. Geographically, Asia Pacific is emerging as the leading region, fueled by rapid industrialization, significant investments in infrastructure, and a burgeoning manufacturing base across countries like China, India, and Southeast Asian nations.
Key Drivers in Water and Wastewater Treatment:
- Stringent Environmental Regulations: Governments worldwide are implementing tougher standards for wastewater discharge, necessitating advanced separation technologies.
- Population Growth & Urbanization: Increased demand for clean water and efficient wastewater management in densely populated urban areas.
- Resource Recovery Initiatives: Growing focus on extracting valuable resources (e.g., biogas, nutrients) from wastewater sludge, enhancing the economic viability of treatment processes.
- Aging Infrastructure Upgrades: Significant investment in modernizing and expanding existing water and wastewater treatment facilities.
Dominance Factors in Asia Pacific:
- Economic Growth & Industrial Expansion: Rapid development across manufacturing, chemical, and food sectors, all of which rely heavily on industrial centrifuges.
- Government Initiatives & Investments: Substantial government spending on infrastructure projects, including water treatment and industrial development.
- Growing Awareness of Environmental Concerns: Increasing recognition of the importance of sustainable industrial practices and pollution control.
- Cost-Effectiveness & Scalability: The demand for robust and scalable separation solutions to meet the needs of a rapidly developing industrial landscape.
Within the Sedimentation type, Decanter Centrifuges are experiencing particularly strong demand due to their high throughput and efficiency in handling slurries and sludges, making them ideal for applications in wastewater treatment and chemical processing. Continuous operation mode centrifuges are also favored across many industries for their ability to process large volumes of material efficiently, contributing significantly to market growth. The market for industrial centrifuges in this segment is projected to reach xx million units by 2033.
Industrial Centrifuge Industry Product Landscape
The industrial centrifuge market is characterized by continuous product innovation focused on enhancing separation efficiency, reducing energy consumption, and improving operational reliability. Key advancements include the development of highly specialized disc stack centrifuges for ultra-fine particle separation in the pharmaceutical and biotechnology sectors, and robust decanter centrifuges engineered for challenging applications in the mining and oil and gas industries. The integration of advanced materials, such as corrosion-resistant alloys, extends product lifespans and expands their applicability in harsh chemical environments. Furthermore, smart technologies, including sensor integration and AI-driven control systems, are optimizing performance, enabling predictive maintenance, and streamlining operational data collection and analysis. Applications span from clarifying beverages and thickening chemical slurries to dewatering sludge in wastewater treatment plants and separating minerals in mining operations. Performance metrics such as throughput capacity, separation factor, and energy efficiency are key differentiating factors, driving manufacturers to offer a diverse range of solutions tailored to specific industry needs.
Key Drivers, Barriers & Challenges in Industrial Centrifuge Industry
The industrial centrifuge industry is propelled by several key drivers, including the escalating demand for efficient separation processes in burgeoning sectors like pharmaceuticals and food & beverages, coupled with stringent environmental regulations necessitating effective wastewater treatment. Technological advancements, such as the integration of AI for enhanced operational control and predictive maintenance, are also significant growth catalysts.
However, the industry faces considerable barriers and challenges. High capital expenditure for sophisticated centrifuge systems can be a restraint, particularly for smaller enterprises. Stringent regulatory compliance across different regions adds complexity and cost to product development and deployment. Supply chain disruptions, as experienced in recent global events, can impact the availability of critical components and extend lead times. Intense competition from alternative separation technologies, although often less efficient for specific applications, also presents a challenge. Furthermore, the need for skilled labor to operate and maintain these complex machines can be a limiting factor in some markets.
Emerging Opportunities in Industrial Centrifuge Industry
Emerging opportunities in the industrial centrifuge industry lie in the growing demand for sustainable solutions and the expansion of niche applications. The circular economy trend is driving innovation in centrifuges designed for enhanced resource recovery from industrial waste streams, such as recovering valuable metals from electronic waste or extracting proteins from food processing by-products. The biopharmaceutical sector's rapid growth presents a significant opportunity for high-purity centrifuges used in the production of vaccines, biologics, and cell therapies. Furthermore, the development of portable and modular centrifuge systems for remote or temporary industrial sites, such as in disaster relief or exploratory mining operations, offers untapped market potential. The increasing adoption of digital technologies, including IoT sensors and cloud-based analytics, is creating opportunities for service-based revenue models, such as predictive maintenance contracts and performance optimization services.
Growth Accelerators in the Industrial Centrifuge Industry Industry
Long-term growth in the industrial centrifuge industry will be significantly accelerated by continued technological breakthroughs, strategic partnerships, and targeted market expansion. The ongoing integration of Artificial Intelligence (AI) and Machine Learning (ML) into centrifuge control systems promises unprecedented levels of automation, efficiency, and self-optimization, driving adoption across all sectors. Strategic alliances between centrifuge manufacturers and end-users, as well as with providers of complementary technologies (e.g., automation and software solutions), will foster co-creation and accelerate the development of tailored solutions. Furthermore, expanding into emerging economies with rapidly industrializing sectors and increasing environmental consciousness will unlock substantial new market potential. The development of more energy-efficient and environmentally friendly centrifuge designs will also act as a significant growth accelerator, aligning with global sustainability initiatives.
Key Players Shaping the Industrial Centrifuge Industry Market
- Multotec Pty Ltd
- HAUS Centrifuge Technologies
- Thomas Broadbent & Sons Ltd
- Flottweg SE
- MSE Hiller
- GEA Group AG
- Ferrum Ltd
- Andritz AG
- Alfa Laval AB
Notable Milestones in Industrial Centrifuge Industry Sector
- January 2024: GEA unveiled X Control, a fresh centrifuge control system. The introduction of X Control sets the stage for incorporating Artificial Intelligence (AI), promising quicker and simpler data collection and analysis and self-optimization of the entire system in the future. The heightened computing capabilities will also enhance integration with SCADA (Supervisory Control and Data Acquisition) systems.
- September 2023: The United States Army Engineer Research and Development Center (ERDC) completed the upgrade of beam centrifuges, giving modernized functionality to one of the most innovative pieces of technology. The centrifuge within the Geotechnical and Structures Laboratory's (GSL) Geotechnical Engineering and Geosciences Branch (GEGB) was upgraded with improvements to its electrical and hydraulic systems and significant renovations to the control building.
- February 2023: The globally operating Eppendorf Group announced an expansion of its manufacturing presence within the Chinese market. The company finalized an agreement for a new production facility in the Shanghai metropolitan area. This facility will focus on producing Eppendorf centrifuges specifically for the local market. The establishment of this new site is expected to catalyze further growth for the life science company's centrifuge business.
In-Depth Industrial Centrifuge Industry Market Outlook
The industrial centrifuge market is characterized by a positive future outlook, driven by ongoing technological advancements, increasing global industrialization, and a heightened focus on sustainability. Growth accelerators such as the pervasive integration of AI and IoT for smarter, more efficient operations, alongside strategic partnerships focused on developing customized solutions for evolving industry needs, will significantly boost market potential. The expansion into emerging economies and the development of innovative applications in sectors like biopharmaceuticals and resource recovery represent substantial strategic opportunities. The anticipated market size of xx million units by 2033 underscores the robust and sustained demand for these critical separation technologies.
Industrial Centrifuge Industry Segmentation
-
1. Type
-
1.1. Sedimentation
- 1.1.1. Clarifier/Thickener Centrifuges
- 1.1.2. Decanter Centrifuges
- 1.1.3. Disc Stack Centrifuges
- 1.1.4. Hydrocyclones
- 1.1.5. Other Sedimentation Centrifuges
-
1.2. Filtering
- 1.2.1. Basket Centrifuges
- 1.2.2. Scroll Screen Centrifuges
- 1.2.3. Peeler Centrifuges
- 1.2.4. Pusher Centrifuges
- 1.2.5. Other Filtering Centrifuges
-
1.1. Sedimentation
-
2. Design
- 2.1. Horizontal Centrifuges
- 2.2. Vertical Centrifuges
-
3. Operation Mode
- 3.1. Batch
- 3.2. Continuous
-
4. Industry
- 4.1. Food and Beverages
- 4.2. Pharmaceutical
- 4.3. Water and Wastewater Treatment
- 4.4. Chemical
- 4.5. Metal and Mining
- 4.6. Power
- 4.7. Pulp and Paper
- 4.8. Other Industries
Industrial Centrifuge Industry Segmentation By Geography
-
1. North America
- 1.1. United States
- 1.2. Canada
- 1.3. Rest of North America
-
2. Europe
- 2.1. Germany
- 2.2. France
- 2.3. United Kingdom
- 2.4. Italy
- 2.5. Spain
- 2.6. Russia
- 2.7. NORDIC
- 2.8. Turkey
- 2.9. Rest of Europe
-
3. Asia Pacific
- 3.1. China
- 3.2. India
- 3.3. Japan
- 3.4. Australia
- 3.5. South Korea
- 3.6. Malaysia
- 3.7. Thailand
- 3.8. Indonesia
- 3.9. Vietnam
- 3.10. Rest of the Asia Pacific
-
4. South America
- 4.1. Brazil
- 4.2. Argentina
- 4.3. Chile
- 4.4. Colombia
- 4.5. Rest of South America
-
5. Middle East and Africa
- 5.1. United Arab Emirates
- 5.2. Saudi Arabia
- 5.3. Qatar
- 5.4. South Africa
- 5.5. Nigeria
- 5.6. Egypt
- 5.7. Rest of the Middle East and Africa
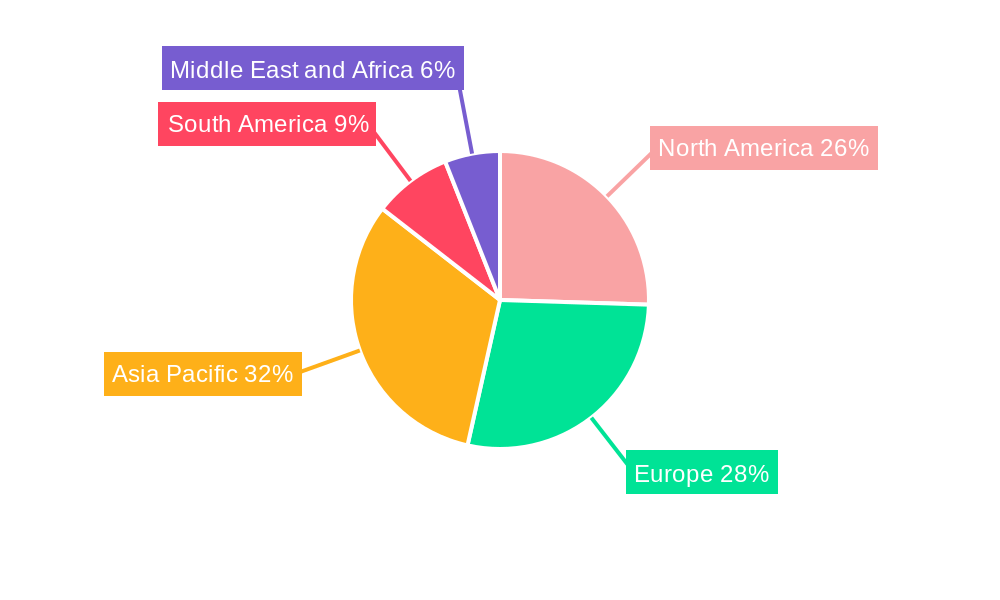
Industrial Centrifuge Industry Regional Market Share
Geographic Coverage of Industrial Centrifuge Industry
Industrial Centrifuge Industry REPORT HIGHLIGHTS
| Aspects | Details |
|---|---|
| Study Period | 2020-2034 |
| Base Year | 2025 |
| Estimated Year | 2026 |
| Forecast Period | 2026-2034 |
| Historical Period | 2020-2025 |
| Growth Rate | CAGR of 4.51% from 2020-2034 |
| Segmentation |
|
Table of Contents
- 1. Introduction
- 1.1. Research Scope
- 1.2. Market Segmentation
- 1.3. Research Objective
- 1.4. Definitions and Assumptions
- 2. Executive Summary
- 2.1. Market Snapshot
- 3. Market Dynamics
- 3.1. Market Drivers
- 3.2. Market Restrains
- 3.3. Market Trends
- 3.4. Market Opportunities
- 4. Market Factor Analysis
- 4.1. Porters Five Forces
- 4.1.1. Bargaining Power of Suppliers
- 4.1.2. Bargaining Power of Buyers
- 4.1.3. Threat of New Entrants
- 4.1.4. Threat of Substitutes
- 4.1.5. Competitive Rivalry
- 4.2. PESTEL analysis
- 4.3. BCG Analysis
- 4.3.1. Stars (High Growth, High Market Share)
- 4.3.2. Cash Cows (Low Growth, High Market Share)
- 4.3.3. Question Mark (High Growth, Low Market Share)
- 4.3.4. Dogs (Low Growth, Low Market Share)
- 4.4. Ansoff Matrix Analysis
- 4.5. Supply Chain Analysis
- 4.6. Regulatory Landscape
- 4.7. Current Market Potential and Opportunity Assessment (TAM–SAM–SOM Framework)
- 4.8. VDR Analyst Note
- 4.1. Porters Five Forces
- 5. Market Analysis, Insights and Forecast 2021-2033
- 5.1. Market Analysis, Insights and Forecast - by Type
- 5.1.1. Sedimentation
- 5.1.1.1. Clarifier/Thickener Centrifuges
- 5.1.1.2. Decanter Centrifuges
- 5.1.1.3. Disc Stack Centrifuges
- 5.1.1.4. Hydrocyclones
- 5.1.1.5. Other Sedimentation Centrifuges
- 5.1.2. Filtering
- 5.1.2.1. Basket Centrifuges
- 5.1.2.2. Scroll Screen Centrifuges
- 5.1.2.3. Peeler Centrifuges
- 5.1.2.4. Pusher Centrifuges
- 5.1.2.5. Other Filtering Centrifuges
- 5.1.1. Sedimentation
- 5.2. Market Analysis, Insights and Forecast - by Design
- 5.2.1. Horizontal Centrifuges
- 5.2.2. Vertical Centrifuges
- 5.3. Market Analysis, Insights and Forecast - by Operation Mode
- 5.3.1. Batch
- 5.3.2. Continuous
- 5.4. Market Analysis, Insights and Forecast - by Industry
- 5.4.1. Food and Beverages
- 5.4.2. Pharmaceutical
- 5.4.3. Water and Wastewater Treatment
- 5.4.4. Chemical
- 5.4.5. Metal and Mining
- 5.4.6. Power
- 5.4.7. Pulp and Paper
- 5.4.8. Other Industries
- 5.5. Market Analysis, Insights and Forecast - by Region
- 5.5.1. North America
- 5.5.2. Europe
- 5.5.3. Asia Pacific
- 5.5.4. South America
- 5.5.5. Middle East and Africa
- 5.1. Market Analysis, Insights and Forecast - by Type
- 6. Global Industrial Centrifuge Industry Analysis, Insights and Forecast, 2021-2033
- 6.1. Market Analysis, Insights and Forecast - by Type
- 6.1.1. Sedimentation
- 6.1.1.1. Clarifier/Thickener Centrifuges
- 6.1.1.2. Decanter Centrifuges
- 6.1.1.3. Disc Stack Centrifuges
- 6.1.1.4. Hydrocyclones
- 6.1.1.5. Other Sedimentation Centrifuges
- 6.1.2. Filtering
- 6.1.2.1. Basket Centrifuges
- 6.1.2.2. Scroll Screen Centrifuges
- 6.1.2.3. Peeler Centrifuges
- 6.1.2.4. Pusher Centrifuges
- 6.1.2.5. Other Filtering Centrifuges
- 6.1.1. Sedimentation
- 6.2. Market Analysis, Insights and Forecast - by Design
- 6.2.1. Horizontal Centrifuges
- 6.2.2. Vertical Centrifuges
- 6.3. Market Analysis, Insights and Forecast - by Operation Mode
- 6.3.1. Batch
- 6.3.2. Continuous
- 6.4. Market Analysis, Insights and Forecast - by Industry
- 6.4.1. Food and Beverages
- 6.4.2. Pharmaceutical
- 6.4.3. Water and Wastewater Treatment
- 6.4.4. Chemical
- 6.4.5. Metal and Mining
- 6.4.6. Power
- 6.4.7. Pulp and Paper
- 6.4.8. Other Industries
- 6.1. Market Analysis, Insights and Forecast - by Type
- 7. North America Industrial Centrifuge Industry Analysis, Insights and Forecast, 2021-2033
- 7.1. Market Analysis, Insights and Forecast - by Type
- 7.1.1. Sedimentation
- 7.1.1.1. Clarifier/Thickener Centrifuges
- 7.1.1.2. Decanter Centrifuges
- 7.1.1.3. Disc Stack Centrifuges
- 7.1.1.4. Hydrocyclones
- 7.1.1.5. Other Sedimentation Centrifuges
- 7.1.2. Filtering
- 7.1.2.1. Basket Centrifuges
- 7.1.2.2. Scroll Screen Centrifuges
- 7.1.2.3. Peeler Centrifuges
- 7.1.2.4. Pusher Centrifuges
- 7.1.2.5. Other Filtering Centrifuges
- 7.1.1. Sedimentation
- 7.2. Market Analysis, Insights and Forecast - by Design
- 7.2.1. Horizontal Centrifuges
- 7.2.2. Vertical Centrifuges
- 7.3. Market Analysis, Insights and Forecast - by Operation Mode
- 7.3.1. Batch
- 7.3.2. Continuous
- 7.4. Market Analysis, Insights and Forecast - by Industry
- 7.4.1. Food and Beverages
- 7.4.2. Pharmaceutical
- 7.4.3. Water and Wastewater Treatment
- 7.4.4. Chemical
- 7.4.5. Metal and Mining
- 7.4.6. Power
- 7.4.7. Pulp and Paper
- 7.4.8. Other Industries
- 7.1. Market Analysis, Insights and Forecast - by Type
- 8. Europe Industrial Centrifuge Industry Analysis, Insights and Forecast, 2021-2033
- 8.1. Market Analysis, Insights and Forecast - by Type
- 8.1.1. Sedimentation
- 8.1.1.1. Clarifier/Thickener Centrifuges
- 8.1.1.2. Decanter Centrifuges
- 8.1.1.3. Disc Stack Centrifuges
- 8.1.1.4. Hydrocyclones
- 8.1.1.5. Other Sedimentation Centrifuges
- 8.1.2. Filtering
- 8.1.2.1. Basket Centrifuges
- 8.1.2.2. Scroll Screen Centrifuges
- 8.1.2.3. Peeler Centrifuges
- 8.1.2.4. Pusher Centrifuges
- 8.1.2.5. Other Filtering Centrifuges
- 8.1.1. Sedimentation
- 8.2. Market Analysis, Insights and Forecast - by Design
- 8.2.1. Horizontal Centrifuges
- 8.2.2. Vertical Centrifuges
- 8.3. Market Analysis, Insights and Forecast - by Operation Mode
- 8.3.1. Batch
- 8.3.2. Continuous
- 8.4. Market Analysis, Insights and Forecast - by Industry
- 8.4.1. Food and Beverages
- 8.4.2. Pharmaceutical
- 8.4.3. Water and Wastewater Treatment
- 8.4.4. Chemical
- 8.4.5. Metal and Mining
- 8.4.6. Power
- 8.4.7. Pulp and Paper
- 8.4.8. Other Industries
- 8.1. Market Analysis, Insights and Forecast - by Type
- 9. Asia Pacific Industrial Centrifuge Industry Analysis, Insights and Forecast, 2021-2033
- 9.1. Market Analysis, Insights and Forecast - by Type
- 9.1.1. Sedimentation
- 9.1.1.1. Clarifier/Thickener Centrifuges
- 9.1.1.2. Decanter Centrifuges
- 9.1.1.3. Disc Stack Centrifuges
- 9.1.1.4. Hydrocyclones
- 9.1.1.5. Other Sedimentation Centrifuges
- 9.1.2. Filtering
- 9.1.2.1. Basket Centrifuges
- 9.1.2.2. Scroll Screen Centrifuges
- 9.1.2.3. Peeler Centrifuges
- 9.1.2.4. Pusher Centrifuges
- 9.1.2.5. Other Filtering Centrifuges
- 9.1.1. Sedimentation
- 9.2. Market Analysis, Insights and Forecast - by Design
- 9.2.1. Horizontal Centrifuges
- 9.2.2. Vertical Centrifuges
- 9.3. Market Analysis, Insights and Forecast - by Operation Mode
- 9.3.1. Batch
- 9.3.2. Continuous
- 9.4. Market Analysis, Insights and Forecast - by Industry
- 9.4.1. Food and Beverages
- 9.4.2. Pharmaceutical
- 9.4.3. Water and Wastewater Treatment
- 9.4.4. Chemical
- 9.4.5. Metal and Mining
- 9.4.6. Power
- 9.4.7. Pulp and Paper
- 9.4.8. Other Industries
- 9.1. Market Analysis, Insights and Forecast - by Type
- 10. South America Industrial Centrifuge Industry Analysis, Insights and Forecast, 2021-2033
- 10.1. Market Analysis, Insights and Forecast - by Type
- 10.1.1. Sedimentation
- 10.1.1.1. Clarifier/Thickener Centrifuges
- 10.1.1.2. Decanter Centrifuges
- 10.1.1.3. Disc Stack Centrifuges
- 10.1.1.4. Hydrocyclones
- 10.1.1.5. Other Sedimentation Centrifuges
- 10.1.2. Filtering
- 10.1.2.1. Basket Centrifuges
- 10.1.2.2. Scroll Screen Centrifuges
- 10.1.2.3. Peeler Centrifuges
- 10.1.2.4. Pusher Centrifuges
- 10.1.2.5. Other Filtering Centrifuges
- 10.1.1. Sedimentation
- 10.2. Market Analysis, Insights and Forecast - by Design
- 10.2.1. Horizontal Centrifuges
- 10.2.2. Vertical Centrifuges
- 10.3. Market Analysis, Insights and Forecast - by Operation Mode
- 10.3.1. Batch
- 10.3.2. Continuous
- 10.4. Market Analysis, Insights and Forecast - by Industry
- 10.4.1. Food and Beverages
- 10.4.2. Pharmaceutical
- 10.4.3. Water and Wastewater Treatment
- 10.4.4. Chemical
- 10.4.5. Metal and Mining
- 10.4.6. Power
- 10.4.7. Pulp and Paper
- 10.4.8. Other Industries
- 10.1. Market Analysis, Insights and Forecast - by Type
- 11. Middle East and Africa Industrial Centrifuge Industry Analysis, Insights and Forecast, 2021-2033
- 11.1. Market Analysis, Insights and Forecast - by Type
- 11.1.1. Sedimentation
- 11.1.1.1. Clarifier/Thickener Centrifuges
- 11.1.1.2. Decanter Centrifuges
- 11.1.1.3. Disc Stack Centrifuges
- 11.1.1.4. Hydrocyclones
- 11.1.1.5. Other Sedimentation Centrifuges
- 11.1.2. Filtering
- 11.1.2.1. Basket Centrifuges
- 11.1.2.2. Scroll Screen Centrifuges
- 11.1.2.3. Peeler Centrifuges
- 11.1.2.4. Pusher Centrifuges
- 11.1.2.5. Other Filtering Centrifuges
- 11.1.1. Sedimentation
- 11.2. Market Analysis, Insights and Forecast - by Design
- 11.2.1. Horizontal Centrifuges
- 11.2.2. Vertical Centrifuges
- 11.3. Market Analysis, Insights and Forecast - by Operation Mode
- 11.3.1. Batch
- 11.3.2. Continuous
- 11.4. Market Analysis, Insights and Forecast - by Industry
- 11.4.1. Food and Beverages
- 11.4.2. Pharmaceutical
- 11.4.3. Water and Wastewater Treatment
- 11.4.4. Chemical
- 11.4.5. Metal and Mining
- 11.4.6. Power
- 11.4.7. Pulp and Paper
- 11.4.8. Other Industries
- 11.1. Market Analysis, Insights and Forecast - by Type
- 12. Competitive Analysis
- 12.1. Company Profiles
- 12.1.1 Multotec Pty Ltd
- 12.1.1.1. Company Overview
- 12.1.1.2. Products
- 12.1.1.3. Company Financials
- 12.1.1.4. SWOT Analysis
- 12.1.2 HAUS Centrifuge Technologies
- 12.1.2.1. Company Overview
- 12.1.2.2. Products
- 12.1.2.3. Company Financials
- 12.1.2.4. SWOT Analysis
- 12.1.3 Thomas Broadbent & Sons Ltd
- 12.1.3.1. Company Overview
- 12.1.3.2. Products
- 12.1.3.3. Company Financials
- 12.1.3.4. SWOT Analysis
- 12.1.4 Flottweg SE
- 12.1.4.1. Company Overview
- 12.1.4.2. Products
- 12.1.4.3. Company Financials
- 12.1.4.4. SWOT Analysis
- 12.1.5 MSE Hiller
- 12.1.5.1. Company Overview
- 12.1.5.2. Products
- 12.1.5.3. Company Financials
- 12.1.5.4. SWOT Analysis
- 12.1.6 GEA Group AG
- 12.1.6.1. Company Overview
- 12.1.6.2. Products
- 12.1.6.3. Company Financials
- 12.1.6.4. SWOT Analysis
- 12.1.7 Ferrum Ltd
- 12.1.7.1. Company Overview
- 12.1.7.2. Products
- 12.1.7.3. Company Financials
- 12.1.7.4. SWOT Analysis
- 12.1.8 Andritz AG
- 12.1.8.1. Company Overview
- 12.1.8.2. Products
- 12.1.8.3. Company Financials
- 12.1.8.4. SWOT Analysis
- 12.1.9 Alfa Laval AB
- 12.1.9.1. Company Overview
- 12.1.9.2. Products
- 12.1.9.3. Company Financials
- 12.1.9.4. SWOT Analysis
- 12.1.1 Multotec Pty Ltd
- 12.2. Market Entropy
- 12.2.1 Company's Key Areas Served
- 12.2.2 Recent Developments
- 12.3. Company Market Share Analysis 2025
- 12.3.1 Top 5 Companies Market Share Analysis
- 12.3.2 Top 3 Companies Market Share Analysis
- 12.4. List of Potential Customers
- 13. Research Methodology
List of Figures
- Figure 1: Global Industrial Centrifuge Industry Revenue Breakdown (Million, %) by Region 2025 & 2033
- Figure 2: Global Industrial Centrifuge Industry Volume Breakdown (K Unit, %) by Region 2025 & 2033
- Figure 3: North America Industrial Centrifuge Industry Revenue (Million), by Type 2025 & 2033
- Figure 4: North America Industrial Centrifuge Industry Volume (K Unit), by Type 2025 & 2033
- Figure 5: North America Industrial Centrifuge Industry Revenue Share (%), by Type 2025 & 2033
- Figure 6: North America Industrial Centrifuge Industry Volume Share (%), by Type 2025 & 2033
- Figure 7: North America Industrial Centrifuge Industry Revenue (Million), by Design 2025 & 2033
- Figure 8: North America Industrial Centrifuge Industry Volume (K Unit), by Design 2025 & 2033
- Figure 9: North America Industrial Centrifuge Industry Revenue Share (%), by Design 2025 & 2033
- Figure 10: North America Industrial Centrifuge Industry Volume Share (%), by Design 2025 & 2033
- Figure 11: North America Industrial Centrifuge Industry Revenue (Million), by Operation Mode 2025 & 2033
- Figure 12: North America Industrial Centrifuge Industry Volume (K Unit), by Operation Mode 2025 & 2033
- Figure 13: North America Industrial Centrifuge Industry Revenue Share (%), by Operation Mode 2025 & 2033
- Figure 14: North America Industrial Centrifuge Industry Volume Share (%), by Operation Mode 2025 & 2033
- Figure 15: North America Industrial Centrifuge Industry Revenue (Million), by Industry 2025 & 2033
- Figure 16: North America Industrial Centrifuge Industry Volume (K Unit), by Industry 2025 & 2033
- Figure 17: North America Industrial Centrifuge Industry Revenue Share (%), by Industry 2025 & 2033
- Figure 18: North America Industrial Centrifuge Industry Volume Share (%), by Industry 2025 & 2033
- Figure 19: North America Industrial Centrifuge Industry Revenue (Million), by Country 2025 & 2033
- Figure 20: North America Industrial Centrifuge Industry Volume (K Unit), by Country 2025 & 2033
- Figure 21: North America Industrial Centrifuge Industry Revenue Share (%), by Country 2025 & 2033
- Figure 22: North America Industrial Centrifuge Industry Volume Share (%), by Country 2025 & 2033
- Figure 23: Europe Industrial Centrifuge Industry Revenue (Million), by Type 2025 & 2033
- Figure 24: Europe Industrial Centrifuge Industry Volume (K Unit), by Type 2025 & 2033
- Figure 25: Europe Industrial Centrifuge Industry Revenue Share (%), by Type 2025 & 2033
- Figure 26: Europe Industrial Centrifuge Industry Volume Share (%), by Type 2025 & 2033
- Figure 27: Europe Industrial Centrifuge Industry Revenue (Million), by Design 2025 & 2033
- Figure 28: Europe Industrial Centrifuge Industry Volume (K Unit), by Design 2025 & 2033
- Figure 29: Europe Industrial Centrifuge Industry Revenue Share (%), by Design 2025 & 2033
- Figure 30: Europe Industrial Centrifuge Industry Volume Share (%), by Design 2025 & 2033
- Figure 31: Europe Industrial Centrifuge Industry Revenue (Million), by Operation Mode 2025 & 2033
- Figure 32: Europe Industrial Centrifuge Industry Volume (K Unit), by Operation Mode 2025 & 2033
- Figure 33: Europe Industrial Centrifuge Industry Revenue Share (%), by Operation Mode 2025 & 2033
- Figure 34: Europe Industrial Centrifuge Industry Volume Share (%), by Operation Mode 2025 & 2033
- Figure 35: Europe Industrial Centrifuge Industry Revenue (Million), by Industry 2025 & 2033
- Figure 36: Europe Industrial Centrifuge Industry Volume (K Unit), by Industry 2025 & 2033
- Figure 37: Europe Industrial Centrifuge Industry Revenue Share (%), by Industry 2025 & 2033
- Figure 38: Europe Industrial Centrifuge Industry Volume Share (%), by Industry 2025 & 2033
- Figure 39: Europe Industrial Centrifuge Industry Revenue (Million), by Country 2025 & 2033
- Figure 40: Europe Industrial Centrifuge Industry Volume (K Unit), by Country 2025 & 2033
- Figure 41: Europe Industrial Centrifuge Industry Revenue Share (%), by Country 2025 & 2033
- Figure 42: Europe Industrial Centrifuge Industry Volume Share (%), by Country 2025 & 2033
- Figure 43: Asia Pacific Industrial Centrifuge Industry Revenue (Million), by Type 2025 & 2033
- Figure 44: Asia Pacific Industrial Centrifuge Industry Volume (K Unit), by Type 2025 & 2033
- Figure 45: Asia Pacific Industrial Centrifuge Industry Revenue Share (%), by Type 2025 & 2033
- Figure 46: Asia Pacific Industrial Centrifuge Industry Volume Share (%), by Type 2025 & 2033
- Figure 47: Asia Pacific Industrial Centrifuge Industry Revenue (Million), by Design 2025 & 2033
- Figure 48: Asia Pacific Industrial Centrifuge Industry Volume (K Unit), by Design 2025 & 2033
- Figure 49: Asia Pacific Industrial Centrifuge Industry Revenue Share (%), by Design 2025 & 2033
- Figure 50: Asia Pacific Industrial Centrifuge Industry Volume Share (%), by Design 2025 & 2033
- Figure 51: Asia Pacific Industrial Centrifuge Industry Revenue (Million), by Operation Mode 2025 & 2033
- Figure 52: Asia Pacific Industrial Centrifuge Industry Volume (K Unit), by Operation Mode 2025 & 2033
- Figure 53: Asia Pacific Industrial Centrifuge Industry Revenue Share (%), by Operation Mode 2025 & 2033
- Figure 54: Asia Pacific Industrial Centrifuge Industry Volume Share (%), by Operation Mode 2025 & 2033
- Figure 55: Asia Pacific Industrial Centrifuge Industry Revenue (Million), by Industry 2025 & 2033
- Figure 56: Asia Pacific Industrial Centrifuge Industry Volume (K Unit), by Industry 2025 & 2033
- Figure 57: Asia Pacific Industrial Centrifuge Industry Revenue Share (%), by Industry 2025 & 2033
- Figure 58: Asia Pacific Industrial Centrifuge Industry Volume Share (%), by Industry 2025 & 2033
- Figure 59: Asia Pacific Industrial Centrifuge Industry Revenue (Million), by Country 2025 & 2033
- Figure 60: Asia Pacific Industrial Centrifuge Industry Volume (K Unit), by Country 2025 & 2033
- Figure 61: Asia Pacific Industrial Centrifuge Industry Revenue Share (%), by Country 2025 & 2033
- Figure 62: Asia Pacific Industrial Centrifuge Industry Volume Share (%), by Country 2025 & 2033
- Figure 63: South America Industrial Centrifuge Industry Revenue (Million), by Type 2025 & 2033
- Figure 64: South America Industrial Centrifuge Industry Volume (K Unit), by Type 2025 & 2033
- Figure 65: South America Industrial Centrifuge Industry Revenue Share (%), by Type 2025 & 2033
- Figure 66: South America Industrial Centrifuge Industry Volume Share (%), by Type 2025 & 2033
- Figure 67: South America Industrial Centrifuge Industry Revenue (Million), by Design 2025 & 2033
- Figure 68: South America Industrial Centrifuge Industry Volume (K Unit), by Design 2025 & 2033
- Figure 69: South America Industrial Centrifuge Industry Revenue Share (%), by Design 2025 & 2033
- Figure 70: South America Industrial Centrifuge Industry Volume Share (%), by Design 2025 & 2033
- Figure 71: South America Industrial Centrifuge Industry Revenue (Million), by Operation Mode 2025 & 2033
- Figure 72: South America Industrial Centrifuge Industry Volume (K Unit), by Operation Mode 2025 & 2033
- Figure 73: South America Industrial Centrifuge Industry Revenue Share (%), by Operation Mode 2025 & 2033
- Figure 74: South America Industrial Centrifuge Industry Volume Share (%), by Operation Mode 2025 & 2033
- Figure 75: South America Industrial Centrifuge Industry Revenue (Million), by Industry 2025 & 2033
- Figure 76: South America Industrial Centrifuge Industry Volume (K Unit), by Industry 2025 & 2033
- Figure 77: South America Industrial Centrifuge Industry Revenue Share (%), by Industry 2025 & 2033
- Figure 78: South America Industrial Centrifuge Industry Volume Share (%), by Industry 2025 & 2033
- Figure 79: South America Industrial Centrifuge Industry Revenue (Million), by Country 2025 & 2033
- Figure 80: South America Industrial Centrifuge Industry Volume (K Unit), by Country 2025 & 2033
- Figure 81: South America Industrial Centrifuge Industry Revenue Share (%), by Country 2025 & 2033
- Figure 82: South America Industrial Centrifuge Industry Volume Share (%), by Country 2025 & 2033
- Figure 83: Middle East and Africa Industrial Centrifuge Industry Revenue (Million), by Type 2025 & 2033
- Figure 84: Middle East and Africa Industrial Centrifuge Industry Volume (K Unit), by Type 2025 & 2033
- Figure 85: Middle East and Africa Industrial Centrifuge Industry Revenue Share (%), by Type 2025 & 2033
- Figure 86: Middle East and Africa Industrial Centrifuge Industry Volume Share (%), by Type 2025 & 2033
- Figure 87: Middle East and Africa Industrial Centrifuge Industry Revenue (Million), by Design 2025 & 2033
- Figure 88: Middle East and Africa Industrial Centrifuge Industry Volume (K Unit), by Design 2025 & 2033
- Figure 89: Middle East and Africa Industrial Centrifuge Industry Revenue Share (%), by Design 2025 & 2033
- Figure 90: Middle East and Africa Industrial Centrifuge Industry Volume Share (%), by Design 2025 & 2033
- Figure 91: Middle East and Africa Industrial Centrifuge Industry Revenue (Million), by Operation Mode 2025 & 2033
- Figure 92: Middle East and Africa Industrial Centrifuge Industry Volume (K Unit), by Operation Mode 2025 & 2033
- Figure 93: Middle East and Africa Industrial Centrifuge Industry Revenue Share (%), by Operation Mode 2025 & 2033
- Figure 94: Middle East and Africa Industrial Centrifuge Industry Volume Share (%), by Operation Mode 2025 & 2033
- Figure 95: Middle East and Africa Industrial Centrifuge Industry Revenue (Million), by Industry 2025 & 2033
- Figure 96: Middle East and Africa Industrial Centrifuge Industry Volume (K Unit), by Industry 2025 & 2033
- Figure 97: Middle East and Africa Industrial Centrifuge Industry Revenue Share (%), by Industry 2025 & 2033
- Figure 98: Middle East and Africa Industrial Centrifuge Industry Volume Share (%), by Industry 2025 & 2033
- Figure 99: Middle East and Africa Industrial Centrifuge Industry Revenue (Million), by Country 2025 & 2033
- Figure 100: Middle East and Africa Industrial Centrifuge Industry Volume (K Unit), by Country 2025 & 2033
- Figure 101: Middle East and Africa Industrial Centrifuge Industry Revenue Share (%), by Country 2025 & 2033
- Figure 102: Middle East and Africa Industrial Centrifuge Industry Volume Share (%), by Country 2025 & 2033
List of Tables
- Table 1: Global Industrial Centrifuge Industry Revenue Million Forecast, by Type 2020 & 2033
- Table 2: Global Industrial Centrifuge Industry Volume K Unit Forecast, by Type 2020 & 2033
- Table 3: Global Industrial Centrifuge Industry Revenue Million Forecast, by Design 2020 & 2033
- Table 4: Global Industrial Centrifuge Industry Volume K Unit Forecast, by Design 2020 & 2033
- Table 5: Global Industrial Centrifuge Industry Revenue Million Forecast, by Operation Mode 2020 & 2033
- Table 6: Global Industrial Centrifuge Industry Volume K Unit Forecast, by Operation Mode 2020 & 2033
- Table 7: Global Industrial Centrifuge Industry Revenue Million Forecast, by Industry 2020 & 2033
- Table 8: Global Industrial Centrifuge Industry Volume K Unit Forecast, by Industry 2020 & 2033
- Table 9: Global Industrial Centrifuge Industry Revenue Million Forecast, by Region 2020 & 2033
- Table 10: Global Industrial Centrifuge Industry Volume K Unit Forecast, by Region 2020 & 2033
- Table 11: Global Industrial Centrifuge Industry Revenue Million Forecast, by Type 2020 & 2033
- Table 12: Global Industrial Centrifuge Industry Volume K Unit Forecast, by Type 2020 & 2033
- Table 13: Global Industrial Centrifuge Industry Revenue Million Forecast, by Design 2020 & 2033
- Table 14: Global Industrial Centrifuge Industry Volume K Unit Forecast, by Design 2020 & 2033
- Table 15: Global Industrial Centrifuge Industry Revenue Million Forecast, by Operation Mode 2020 & 2033
- Table 16: Global Industrial Centrifuge Industry Volume K Unit Forecast, by Operation Mode 2020 & 2033
- Table 17: Global Industrial Centrifuge Industry Revenue Million Forecast, by Industry 2020 & 2033
- Table 18: Global Industrial Centrifuge Industry Volume K Unit Forecast, by Industry 2020 & 2033
- Table 19: Global Industrial Centrifuge Industry Revenue Million Forecast, by Country 2020 & 2033
- Table 20: Global Industrial Centrifuge Industry Volume K Unit Forecast, by Country 2020 & 2033
- Table 21: United States Industrial Centrifuge Industry Revenue (Million) Forecast, by Application 2020 & 2033
- Table 22: United States Industrial Centrifuge Industry Volume (K Unit) Forecast, by Application 2020 & 2033
- Table 23: Canada Industrial Centrifuge Industry Revenue (Million) Forecast, by Application 2020 & 2033
- Table 24: Canada Industrial Centrifuge Industry Volume (K Unit) Forecast, by Application 2020 & 2033
- Table 25: Rest of North America Industrial Centrifuge Industry Revenue (Million) Forecast, by Application 2020 & 2033
- Table 26: Rest of North America Industrial Centrifuge Industry Volume (K Unit) Forecast, by Application 2020 & 2033
- Table 27: Global Industrial Centrifuge Industry Revenue Million Forecast, by Type 2020 & 2033
- Table 28: Global Industrial Centrifuge Industry Volume K Unit Forecast, by Type 2020 & 2033
- Table 29: Global Industrial Centrifuge Industry Revenue Million Forecast, by Design 2020 & 2033
- Table 30: Global Industrial Centrifuge Industry Volume K Unit Forecast, by Design 2020 & 2033
- Table 31: Global Industrial Centrifuge Industry Revenue Million Forecast, by Operation Mode 2020 & 2033
- Table 32: Global Industrial Centrifuge Industry Volume K Unit Forecast, by Operation Mode 2020 & 2033
- Table 33: Global Industrial Centrifuge Industry Revenue Million Forecast, by Industry 2020 & 2033
- Table 34: Global Industrial Centrifuge Industry Volume K Unit Forecast, by Industry 2020 & 2033
- Table 35: Global Industrial Centrifuge Industry Revenue Million Forecast, by Country 2020 & 2033
- Table 36: Global Industrial Centrifuge Industry Volume K Unit Forecast, by Country 2020 & 2033
- Table 37: Germany Industrial Centrifuge Industry Revenue (Million) Forecast, by Application 2020 & 2033
- Table 38: Germany Industrial Centrifuge Industry Volume (K Unit) Forecast, by Application 2020 & 2033
- Table 39: France Industrial Centrifuge Industry Revenue (Million) Forecast, by Application 2020 & 2033
- Table 40: France Industrial Centrifuge Industry Volume (K Unit) Forecast, by Application 2020 & 2033
- Table 41: United Kingdom Industrial Centrifuge Industry Revenue (Million) Forecast, by Application 2020 & 2033
- Table 42: United Kingdom Industrial Centrifuge Industry Volume (K Unit) Forecast, by Application 2020 & 2033
- Table 43: Italy Industrial Centrifuge Industry Revenue (Million) Forecast, by Application 2020 & 2033
- Table 44: Italy Industrial Centrifuge Industry Volume (K Unit) Forecast, by Application 2020 & 2033
- Table 45: Spain Industrial Centrifuge Industry Revenue (Million) Forecast, by Application 2020 & 2033
- Table 46: Spain Industrial Centrifuge Industry Volume (K Unit) Forecast, by Application 2020 & 2033
- Table 47: Russia Industrial Centrifuge Industry Revenue (Million) Forecast, by Application 2020 & 2033
- Table 48: Russia Industrial Centrifuge Industry Volume (K Unit) Forecast, by Application 2020 & 2033
- Table 49: NORDIC Industrial Centrifuge Industry Revenue (Million) Forecast, by Application 2020 & 2033
- Table 50: NORDIC Industrial Centrifuge Industry Volume (K Unit) Forecast, by Application 2020 & 2033
- Table 51: Turkey Industrial Centrifuge Industry Revenue (Million) Forecast, by Application 2020 & 2033
- Table 52: Turkey Industrial Centrifuge Industry Volume (K Unit) Forecast, by Application 2020 & 2033
- Table 53: Rest of Europe Industrial Centrifuge Industry Revenue (Million) Forecast, by Application 2020 & 2033
- Table 54: Rest of Europe Industrial Centrifuge Industry Volume (K Unit) Forecast, by Application 2020 & 2033
- Table 55: Global Industrial Centrifuge Industry Revenue Million Forecast, by Type 2020 & 2033
- Table 56: Global Industrial Centrifuge Industry Volume K Unit Forecast, by Type 2020 & 2033
- Table 57: Global Industrial Centrifuge Industry Revenue Million Forecast, by Design 2020 & 2033
- Table 58: Global Industrial Centrifuge Industry Volume K Unit Forecast, by Design 2020 & 2033
- Table 59: Global Industrial Centrifuge Industry Revenue Million Forecast, by Operation Mode 2020 & 2033
- Table 60: Global Industrial Centrifuge Industry Volume K Unit Forecast, by Operation Mode 2020 & 2033
- Table 61: Global Industrial Centrifuge Industry Revenue Million Forecast, by Industry 2020 & 2033
- Table 62: Global Industrial Centrifuge Industry Volume K Unit Forecast, by Industry 2020 & 2033
- Table 63: Global Industrial Centrifuge Industry Revenue Million Forecast, by Country 2020 & 2033
- Table 64: Global Industrial Centrifuge Industry Volume K Unit Forecast, by Country 2020 & 2033
- Table 65: China Industrial Centrifuge Industry Revenue (Million) Forecast, by Application 2020 & 2033
- Table 66: China Industrial Centrifuge Industry Volume (K Unit) Forecast, by Application 2020 & 2033
- Table 67: India Industrial Centrifuge Industry Revenue (Million) Forecast, by Application 2020 & 2033
- Table 68: India Industrial Centrifuge Industry Volume (K Unit) Forecast, by Application 2020 & 2033
- Table 69: Japan Industrial Centrifuge Industry Revenue (Million) Forecast, by Application 2020 & 2033
- Table 70: Japan Industrial Centrifuge Industry Volume (K Unit) Forecast, by Application 2020 & 2033
- Table 71: Australia Industrial Centrifuge Industry Revenue (Million) Forecast, by Application 2020 & 2033
- Table 72: Australia Industrial Centrifuge Industry Volume (K Unit) Forecast, by Application 2020 & 2033
- Table 73: South Korea Industrial Centrifuge Industry Revenue (Million) Forecast, by Application 2020 & 2033
- Table 74: South Korea Industrial Centrifuge Industry Volume (K Unit) Forecast, by Application 2020 & 2033
- Table 75: Malaysia Industrial Centrifuge Industry Revenue (Million) Forecast, by Application 2020 & 2033
- Table 76: Malaysia Industrial Centrifuge Industry Volume (K Unit) Forecast, by Application 2020 & 2033
- Table 77: Thailand Industrial Centrifuge Industry Revenue (Million) Forecast, by Application 2020 & 2033
- Table 78: Thailand Industrial Centrifuge Industry Volume (K Unit) Forecast, by Application 2020 & 2033
- Table 79: Indonesia Industrial Centrifuge Industry Revenue (Million) Forecast, by Application 2020 & 2033
- Table 80: Indonesia Industrial Centrifuge Industry Volume (K Unit) Forecast, by Application 2020 & 2033
- Table 81: Vietnam Industrial Centrifuge Industry Revenue (Million) Forecast, by Application 2020 & 2033
- Table 82: Vietnam Industrial Centrifuge Industry Volume (K Unit) Forecast, by Application 2020 & 2033
- Table 83: Rest of the Asia Pacific Industrial Centrifuge Industry Revenue (Million) Forecast, by Application 2020 & 2033
- Table 84: Rest of the Asia Pacific Industrial Centrifuge Industry Volume (K Unit) Forecast, by Application 2020 & 2033
- Table 85: Global Industrial Centrifuge Industry Revenue Million Forecast, by Type 2020 & 2033
- Table 86: Global Industrial Centrifuge Industry Volume K Unit Forecast, by Type 2020 & 2033
- Table 87: Global Industrial Centrifuge Industry Revenue Million Forecast, by Design 2020 & 2033
- Table 88: Global Industrial Centrifuge Industry Volume K Unit Forecast, by Design 2020 & 2033
- Table 89: Global Industrial Centrifuge Industry Revenue Million Forecast, by Operation Mode 2020 & 2033
- Table 90: Global Industrial Centrifuge Industry Volume K Unit Forecast, by Operation Mode 2020 & 2033
- Table 91: Global Industrial Centrifuge Industry Revenue Million Forecast, by Industry 2020 & 2033
- Table 92: Global Industrial Centrifuge Industry Volume K Unit Forecast, by Industry 2020 & 2033
- Table 93: Global Industrial Centrifuge Industry Revenue Million Forecast, by Country 2020 & 2033
- Table 94: Global Industrial Centrifuge Industry Volume K Unit Forecast, by Country 2020 & 2033
- Table 95: Brazil Industrial Centrifuge Industry Revenue (Million) Forecast, by Application 2020 & 2033
- Table 96: Brazil Industrial Centrifuge Industry Volume (K Unit) Forecast, by Application 2020 & 2033
- Table 97: Argentina Industrial Centrifuge Industry Revenue (Million) Forecast, by Application 2020 & 2033
- Table 98: Argentina Industrial Centrifuge Industry Volume (K Unit) Forecast, by Application 2020 & 2033
- Table 99: Chile Industrial Centrifuge Industry Revenue (Million) Forecast, by Application 2020 & 2033
- Table 100: Chile Industrial Centrifuge Industry Volume (K Unit) Forecast, by Application 2020 & 2033
- Table 101: Colombia Industrial Centrifuge Industry Revenue (Million) Forecast, by Application 2020 & 2033
- Table 102: Colombia Industrial Centrifuge Industry Volume (K Unit) Forecast, by Application 2020 & 2033
- Table 103: Rest of South America Industrial Centrifuge Industry Revenue (Million) Forecast, by Application 2020 & 2033
- Table 104: Rest of South America Industrial Centrifuge Industry Volume (K Unit) Forecast, by Application 2020 & 2033
- Table 105: Global Industrial Centrifuge Industry Revenue Million Forecast, by Type 2020 & 2033
- Table 106: Global Industrial Centrifuge Industry Volume K Unit Forecast, by Type 2020 & 2033
- Table 107: Global Industrial Centrifuge Industry Revenue Million Forecast, by Design 2020 & 2033
- Table 108: Global Industrial Centrifuge Industry Volume K Unit Forecast, by Design 2020 & 2033
- Table 109: Global Industrial Centrifuge Industry Revenue Million Forecast, by Operation Mode 2020 & 2033
- Table 110: Global Industrial Centrifuge Industry Volume K Unit Forecast, by Operation Mode 2020 & 2033
- Table 111: Global Industrial Centrifuge Industry Revenue Million Forecast, by Industry 2020 & 2033
- Table 112: Global Industrial Centrifuge Industry Volume K Unit Forecast, by Industry 2020 & 2033
- Table 113: Global Industrial Centrifuge Industry Revenue Million Forecast, by Country 2020 & 2033
- Table 114: Global Industrial Centrifuge Industry Volume K Unit Forecast, by Country 2020 & 2033
- Table 115: United Arab Emirates Industrial Centrifuge Industry Revenue (Million) Forecast, by Application 2020 & 2033
- Table 116: United Arab Emirates Industrial Centrifuge Industry Volume (K Unit) Forecast, by Application 2020 & 2033
- Table 117: Saudi Arabia Industrial Centrifuge Industry Revenue (Million) Forecast, by Application 2020 & 2033
- Table 118: Saudi Arabia Industrial Centrifuge Industry Volume (K Unit) Forecast, by Application 2020 & 2033
- Table 119: Qatar Industrial Centrifuge Industry Revenue (Million) Forecast, by Application 2020 & 2033
- Table 120: Qatar Industrial Centrifuge Industry Volume (K Unit) Forecast, by Application 2020 & 2033
- Table 121: South Africa Industrial Centrifuge Industry Revenue (Million) Forecast, by Application 2020 & 2033
- Table 122: South Africa Industrial Centrifuge Industry Volume (K Unit) Forecast, by Application 2020 & 2033
- Table 123: Nigeria Industrial Centrifuge Industry Revenue (Million) Forecast, by Application 2020 & 2033
- Table 124: Nigeria Industrial Centrifuge Industry Volume (K Unit) Forecast, by Application 2020 & 2033
- Table 125: Egypt Industrial Centrifuge Industry Revenue (Million) Forecast, by Application 2020 & 2033
- Table 126: Egypt Industrial Centrifuge Industry Volume (K Unit) Forecast, by Application 2020 & 2033
- Table 127: Rest of the Middle East and Africa Industrial Centrifuge Industry Revenue (Million) Forecast, by Application 2020 & 2033
- Table 128: Rest of the Middle East and Africa Industrial Centrifuge Industry Volume (K Unit) Forecast, by Application 2020 & 2033
Frequently Asked Questions
1. What is the projected Compound Annual Growth Rate (CAGR) of the Industrial Centrifuge Industry?
The projected CAGR is approximately 4.51%.
2. Which companies are prominent players in the Industrial Centrifuge Industry?
Key companies in the market include Multotec Pty Ltd, HAUS Centrifuge Technologies, Thomas Broadbent & Sons Ltd, Flottweg SE, MSE Hiller, GEA Group AG, Ferrum Ltd, Andritz AG, Alfa Laval AB.
3. What are the main segments of the Industrial Centrifuge Industry?
The market segments include Type, Design, Operation Mode, Industry.
4. Can you provide details about the market size?
The market size is estimated to be USD 8.47 Million as of 2022.
5. What are some drivers contributing to market growth?
4.; Increasing Demand from Various End-user Industries.
6. What are the notable trends driving market growth?
The Chemical Industry to Dominate the Market.
7. Are there any restraints impacting market growth?
4.; Higher Capital and Operational Cost.
8. Can you provide examples of recent developments in the market?
January 2024: GEA unveiled X Control, a fresh centrifuge control system. The introduction of X Control sets the stage for incorporating Artificial Intelligence (AI), promising quicker and simpler data collection and analysis and self-optimization of the entire system in the future. The heightened computing capabilities will also enhance integration with SCADA (Supervisory Control and Data Acquisition) systems.
9. What pricing options are available for accessing the report?
Pricing options include single-user, multi-user, and enterprise licenses priced at USD 4750, USD 5250, and USD 8750 respectively.
10. Is the market size provided in terms of value or volume?
The market size is provided in terms of value, measured in Million and volume, measured in K Unit.
11. Are there any specific market keywords associated with the report?
Yes, the market keyword associated with the report is "Industrial Centrifuge Industry," which aids in identifying and referencing the specific market segment covered.
12. How do I determine which pricing option suits my needs best?
The pricing options vary based on user requirements and access needs. Individual users may opt for single-user licenses, while businesses requiring broader access may choose multi-user or enterprise licenses for cost-effective access to the report.
13. Are there any additional resources or data provided in the Industrial Centrifuge Industry report?
While the report offers comprehensive insights, it's advisable to review the specific contents or supplementary materials provided to ascertain if additional resources or data are available.
14. How can I stay updated on further developments or reports in the Industrial Centrifuge Industry?
To stay informed about further developments, trends, and reports in the Industrial Centrifuge Industry, consider subscribing to industry newsletters, following relevant companies and organizations, or regularly checking reputable industry news sources and publications.
Methodology
Step 1 - Identification of Relevant Samples Size from Population Database


Step 2 - Approaches for Defining Global Market Size (Value, Volume* & Price*)

Note*: In applicable scenarios
Step 3 - Data Sources
Primary Research
- Web Analytics
- Survey Reports
- Research Institute
- Latest Research Reports
- Opinion Leaders
Secondary Research
- Annual Reports
- White Paper
- Latest Press Release
- Industry Association
- Paid Database
- Investor Presentations

Step 4 - Data Triangulation
Involves using different sources of information in order to increase the validity of a study
These sources are likely to be stakeholders in a program - participants, other researchers, program staff, other community members, and so on.
Then we put all data in single framework & apply various statistical tools to find out the dynamic on the market.
During the analysis stage, feedback from the stakeholder groups would be compared to determine areas of agreement as well as areas of divergence