

Key Insights
The Europe Power to Gas (PtG) market is projected for substantial growth, fueled by increasing demand for renewable energy integration, stringent environmental mandates, and the crucial need to decarbonize industrial and utility sectors. The market is estimated at USD 46.76 billion in 2025 and is expected to expand at a Compound Annual Growth Rate (CAGR) of 11.35% from 2025 to 2033. This expansion is driven by the rising adoption of Power-to-Methane (PtM) and Power-to-Hydrogen technologies, which convert surplus renewable electricity into storable and transportable energy carriers. PtG solutions are vital for managing the intermittency of renewable sources, thus bolstering grid stability and European energy security.
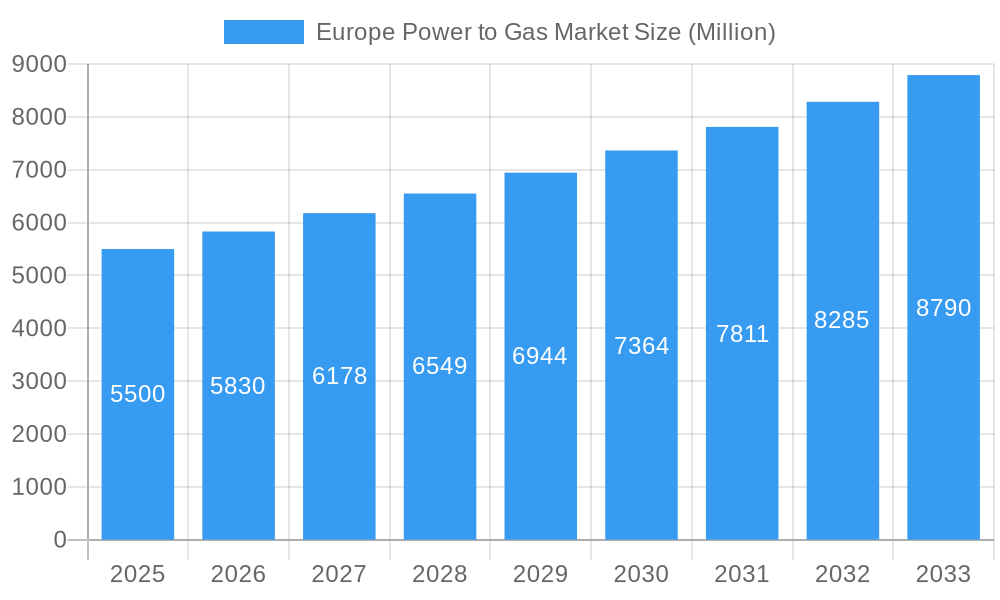
Europe Power to Gas Market Market Size (In Billion)
Key growth catalysts include government incentives, expanding renewable energy infrastructure, and a growing emphasis on circular economy principles by repurposing excess renewable electricity. The market is segmented by technology, with Power-to-Methane showing the highest adoption, followed by Power-to-Hydrogen. System capacity analysis indicates that units ranging from 100 to 1000 KW will lead initial deployments due to their cost-effectiveness for pilot and mid-sized applications, with larger capacities (>1000 KW) expected to grow as infrastructure scales. Utilities are significant investors in PtG for grid balancing and energy storage, while the industrial sector is leveraging PtG for process heat and chemical decarbonization. Leading European markets include Germany, the United Kingdom, France, and Spain, supported by supportive policies and green hydrogen initiatives. While challenges like high initial capital expenditure and policy standardization exist, technological advancements and maturing regulatory frameworks are expected to drive market expansion.
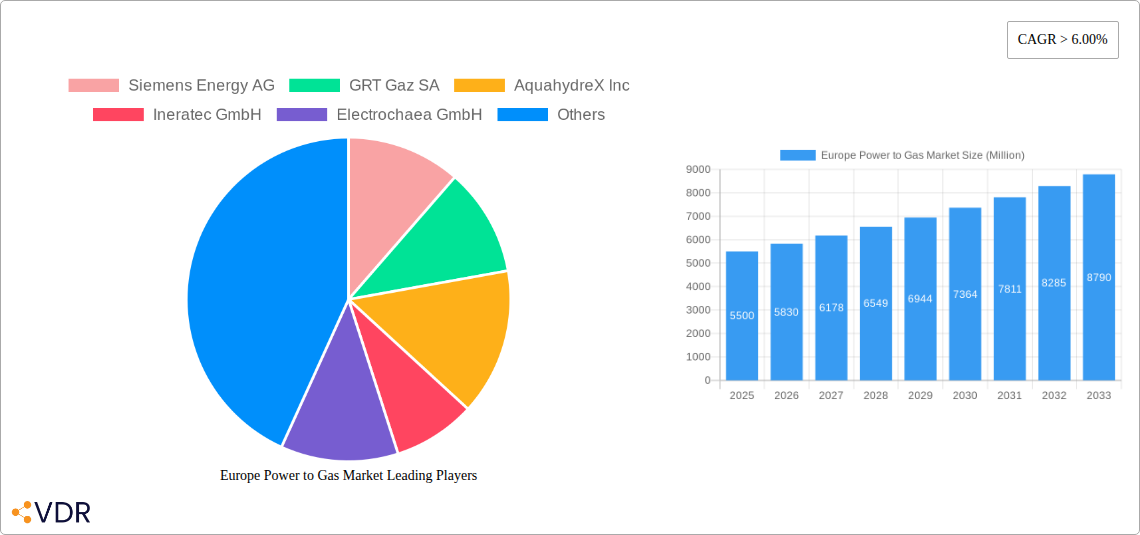
Europe Power to Gas Market Company Market Share
Europe Power to Gas Market: Comprehensive Analysis and Future Outlook (2019-2033)
This comprehensive report provides an in-depth analysis of the Europe Power to Gas Market, a pivotal sector for the continent's decarbonization efforts. Covering the historical period from 2019 to 2024, the base and estimated year of 2025, and a forecast period extending to 2033, this study meticulously examines market dynamics, growth trends, regional dominance, product landscapes, key players, and emerging opportunities. We delve into crucial segments including technology (Power-to-Hydrogen, Power-to-Methane), capacity (<100 KW, 100-1000 KW, >1000 KW), end-users (Utilities, Industrial, Commercial), and geographical locations (United Kingdom, Germany, France, Spain, Others). The report leverages advanced analytical tools and market intelligence to deliver actionable insights for stakeholders navigating this rapidly evolving industry.
Europe Power to Gas Market Dynamics & Structure
The Europe Power to Gas market is characterized by a dynamic interplay of technological innovation, evolving regulatory landscapes, and increasing environmental consciousness. Market concentration varies, with established players like Siemens Energy AG and Nel ASA leading in electrolysis technologies, while newer entrants like AquahydreX Inc. and Ineratec GmbH are making strides in advanced Power-to-Methane solutions. The primary driver for market growth is the urgent need for decarbonization across various sectors, fueled by ambitious EU climate targets. Regulatory frameworks, including renewable energy directives and carbon pricing mechanisms, are instrumental in shaping investment decisions and promoting the adoption of Power-to-Gas technologies.
- Technological Innovation: Continuous advancements in electrolyzer efficiency and the development of novel methanation processes are key innovation drivers, reducing operational costs and improving the competitiveness of synthetic fuels.
- Regulatory Frameworks: Supportive policies such as feed-in tariffs for green hydrogen and synthetic methane, alongside stringent emissions regulations, are crucial for market expansion.
- Competitive Product Substitutes: While direct substitutes are limited for green hydrogen and synthetic methane in certain applications, the ongoing development of alternative decarbonization pathways presents a competitive pressure.
- End-User Demographics: The shift towards sustainability is influencing end-user demographics, with utilities and industrial sectors showing the most immediate demand for Power-to-Gas solutions to meet their green energy targets.
- M&A Trends: The market is witnessing strategic mergers and acquisitions as larger energy companies seek to integrate Power-to-Gas capabilities into their portfolios, fostering consolidation and accelerating technology deployment. For instance, the market has seen xx M&A deals in the historical period.
Europe Power to Gas Market Growth Trends & Insights
The Europe Power to Gas market is poised for significant expansion, driven by a confluence of environmental imperatives and technological advancements. The market size is projected to grow from approximately $xx Million in 2025 to an estimated $xx Million by 2033, exhibiting a robust Compound Annual Growth Rate (CAGR) of xx% during the forecast period. This growth trajectory is underpinned by increasing adoption rates of green hydrogen and synthetic methane across various industrial applications, including transportation, chemical production, and energy storage. Technological disruptions, such as the miniaturization of electrolyzers and the development of more efficient catalytic converters for methanation, are playing a pivotal role in making these solutions more accessible and cost-effective.
Consumer behavior shifts are also contributing to this growth, with a growing demand for sustainable products and a willingness from industrial consumers to invest in cleaner energy alternatives. The push towards a circular economy and the concept of sector coupling, where renewable electricity is converted into storable fuels, further propels the market. For example, the integration of Power-to-Gas systems with intermittent renewable energy sources like wind and solar is enhancing grid stability and optimizing energy utilization. Market penetration is expected to accelerate as policy support solidifies and the economics of green hydrogen and synthetic methane production become increasingly competitive with fossil fuels. The adoption of Power-to-Methane, in particular, is seeing a surge due to its direct applicability in existing natural gas infrastructure.
Dominant Regions, Countries, or Segments in Europe Power to Gas Market
The Europe Power to Gas market's dominance is multifaceted, with specific regions, countries, and technology segments emerging as key growth drivers. Germany stands out as a frontrunner, owing to its strong industrial base, progressive environmental policies, and substantial investments in hydrogen infrastructure. The country benefits from early adoption of Power-to-Hydrogen and Power-to-Methane technologies, driven by its "Energiewende" (energy transition) initiative. The United Kingdom is also a significant player, particularly in the offshore wind-to-hydrogen segment, as highlighted by recent project developments.
- Dominant Technology Segment: The Power-to-Hydrogen segment is currently leading the market due to its fundamental role in producing green hydrogen, a versatile energy carrier. However, Power-to-Methane (including Chemical and Biological) is rapidly gaining traction as it offers a direct pathway to decarbonize natural gas networks and existing infrastructure. The chemical methanation route is favored for large-scale industrial applications, while biological methanation shows promise for smaller, decentralized systems.
- Dominant Capacity Segment: The More than 1000 KW capacity segment is witnessing the most substantial growth, driven by large-scale industrial projects and utility-scale energy storage initiatives. These larger installations benefit from economies of scale, making green hydrogen and synthetic methane production more cost-competitive.
- Dominant End-User Segment: Industrial end-users represent the largest and fastest-growing segment, encompassing sectors like chemicals, refining, and heavy transport, all seeking to reduce their carbon footprint. Utilities are also a crucial segment, investing in Power-to-Gas for grid balancing and energy storage.
- Dominant Geographic Locations: Germany exhibits the highest market share due to robust policy support and a mature industrial sector actively pursuing decarbonization. France and the United Kingdom follow closely, with significant government initiatives and project pipelines aimed at scaling up hydrogen and synthetic methane production.
Europe Power to Gas Market Product Landscape
The Europe Power to Gas market is characterized by a diverse and rapidly evolving product landscape, focusing on efficiency, scalability, and integration with renewable energy sources. Key innovations revolve around advanced electrolyzer technologies, including PEM (Proton Exchange Membrane) and alkaline electrolysis, offering higher current densities and improved durability. For Power-to-Methane, advancements in catalytic methanation processes and novel biological methanation strains are enhancing conversion efficiencies and reducing operational costs.
The product offerings span from modular, small-scale units for niche commercial applications to large industrial-scale plants capable of producing gigawatts of green hydrogen or synthetic methane. These products are increasingly designed for seamless integration with renewable energy farms, offering grid balancing services and enabling the conversion of surplus renewable electricity into valuable, storable fuels.
Key Drivers, Barriers & Challenges in Europe Power to Gas Market
Key Drivers:
- Stringent Climate Targets: Ambitious EU and national decarbonization goals are the primary impetus for the Power-to-Gas market.
- Energy Security: The drive to reduce reliance on imported fossil fuels and enhance energy independence is a significant motivator.
- Technological Advancements: Continuous improvements in electrolyzer and methanation technologies are lowering costs and increasing efficiency.
- Policy Support and Incentives: Government subsidies, tax credits, and favorable regulatory frameworks are crucial for market adoption.
- Growing Demand for Green Hydrogen: Increasing applications in transportation, industry, and power generation are fueling demand.
Barriers & Challenges:
- High Capital Costs: The initial investment for Power-to-Gas infrastructure, particularly large-scale electrolysis plants, remains a significant barrier.
- Infrastructure Development: The need for extensive hydrogen transportation and storage infrastructure presents a considerable challenge.
- Electrolysis Efficiency and Cost: While improving, the cost and efficiency of electrolyzers still need to reach parity with conventional methods in some applications.
- Renewable Energy Availability and Grid Integration: The intermittent nature of renewable sources and the complexity of grid integration can impact consistent Power-to-Gas production.
- Regulatory Uncertainty: Evolving regulations and the lack of a fully harmonized framework across Europe can create investment risks. The market currently faces an estimated xx% gap in necessary infrastructure investment to meet 2030 targets.
Emerging Opportunities in Europe Power to Gas Market
The Europe Power to Gas market presents a wealth of emerging opportunities driven by innovation and policy shifts. The expansion of green hydrogen hubs across the continent offers significant potential for centralized production and distribution, fostering economies of scale. The integration of Power-to-Gas with industrial clusters to create circular economy loops, where waste heat and CO2 are utilized for synthetic methane production, is a promising avenue. Furthermore, the decarbonization of hard-to-abate sectors like aviation and shipping through the use of synthetic fuels derived from Power-to-Gas processes represents a vast untapped market. Decentralized Power-to-Gas solutions for remote communities and island nations also present unique growth prospects.
Growth Accelerators in the Europe Power to Gas Market Industry
Several catalysts are accelerating the growth of the Europe Power to Gas market. Technological breakthroughs in electrolyzer durability and cost reduction are making green hydrogen more economically viable. Strategic partnerships between renewable energy developers, industrial players, and technology providers are facilitating project development and deployment. For example, collaborations to develop integrated Power-to-X facilities are crucial. Market expansion strategies focused on creating robust supply chains for electrolyzers and related components are also vital. The increasing focus on hydrogen as a key component of national energy strategies and the development of international hydrogen trade routes are further bolstering growth prospects.
Key Players Shaping the Europe Power to Gas Market Market
- Siemens Energy AG
- GRT Gaz SA
- AquahydreX Inc
- Ineratec GmbH
- Electrochaea GmbH
- Sempra Energy
- Nel ASA
- Sunfire
Notable Milestones in Europe Power to Gas Market Sector
- March 2022: Environmental Resources Management's (ERM) ERM Dolphyn and Source Energie entered into a partnership to develop a 200-megawatt floating wind-to-hydrogen project in the United Kingdom. The project is expected to be commissioned by 2027 and is likely to produce green hydrogen.
- March 2022: Sunfire won the contract to supply electrolysis equipment for Finland's first industrial-scale green hydrogen plant constructed by P2X Solutions. The construction of the plant in Harjavalta, southwest Finland, was expected to begin by mid-2022, with the company investing EUR 70 million in the facility – a 20-megawatt hydrogen and synthetic methane production plant.
In-Depth Europe Power to Gas Market Market Outlook
The future outlook for the Europe Power to Gas market is exceptionally bright, driven by the synergistic effect of ambitious climate policies, rapid technological innovation, and increasing industry commitment. Growth accelerators such as the scaling up of hydrogen production capacity beyond xx GW by 2030 and the development of advanced Power-to-Methane solutions for grid injection will be pivotal. Strategic partnerships and the establishment of dedicated hydrogen valleys will foster innovation clusters and streamline project development. The market's potential to significantly contribute to energy security, industrial decarbonization, and the creation of a sustainable energy future positions it as a cornerstone of Europe's green transition. Investors and stakeholders are advised to closely monitor policy developments and technological advancements to capitalize on the immense opportunities this sector presents.
Europe Power to Gas Market Segmentation
-
1. Technology
- 1.1. Power-to
- 1.2. Power-to-Methane (incl. Chemical and Biological)
-
2. Capacity
- 2.1. More than 1000 KW
- 2.2. 100 to 1000 KW
- 2.3. Less than 100 KW
-
3. End-User
- 3.1. Utilities
- 3.2. Industrial
- 3.3. Commercial
-
4. Location
- 4.1. United Kingdom
- 4.2. Germany
- 4.3. France
- 4.4. Spain
- 4.5. Others
Europe Power to Gas Market Segmentation By Geography
-
1. Europe
- 1.1. United Kingdom
- 1.2. Germany
- 1.3. France
- 1.4. Italy
- 1.5. Spain
- 1.6. Netherlands
- 1.7. Belgium
- 1.8. Sweden
- 1.9. Norway
- 1.10. Poland
- 1.11. Denmark
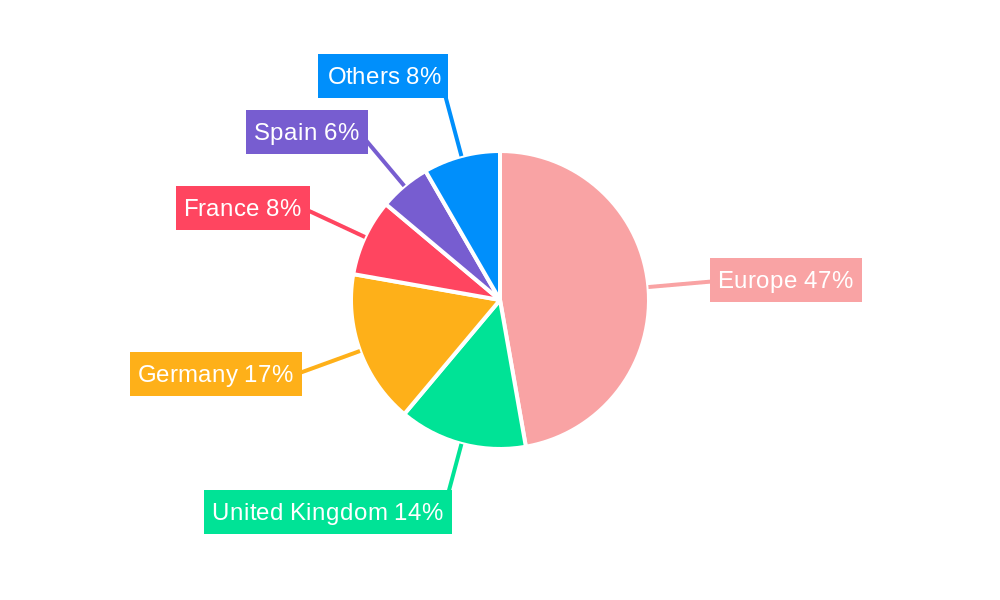
Europe Power to Gas Market Regional Market Share
Geographic Coverage of Europe Power to Gas Market
Europe Power to Gas Market REPORT HIGHLIGHTS
| Aspects | Details |
|---|---|
| Study Period | 2020-2034 |
| Base Year | 2025 |
| Estimated Year | 2026 |
| Forecast Period | 2026-2034 |
| Historical Period | 2020-2025 |
| Growth Rate | CAGR of 11.35% from 2020-2034 |
| Segmentation |
|
Table of Contents
- 1. Introduction
- 1.1. Research Scope
- 1.2. Market Segmentation
- 1.3. Research Objective
- 1.4. Definitions and Assumptions
- 2. Executive Summary
- 2.1. Market Snapshot
- 3. Market Dynamics
- 3.1. Market Drivers
- 3.2. Market Restrains
- 3.3. Market Trends
- 3.4. Market Opportunities
- 4. Market Factor Analysis
- 4.1. Porters Five Forces
- 4.1.1. Bargaining Power of Suppliers
- 4.1.2. Bargaining Power of Buyers
- 4.1.3. Threat of New Entrants
- 4.1.4. Threat of Substitutes
- 4.1.5. Competitive Rivalry
- 4.2. PESTEL analysis
- 4.3. BCG Analysis
- 4.3.1. Stars (High Growth, High Market Share)
- 4.3.2. Cash Cows (Low Growth, High Market Share)
- 4.3.3. Question Mark (High Growth, Low Market Share)
- 4.3.4. Dogs (Low Growth, Low Market Share)
- 4.4. Ansoff Matrix Analysis
- 4.5. Supply Chain Analysis
- 4.6. Regulatory Landscape
- 4.7. Current Market Potential and Opportunity Assessment (TAM–SAM–SOM Framework)
- 4.8. VDR Analyst Note
- 4.1. Porters Five Forces
- 5. Market Analysis, Insights and Forecast 2021-2033
- 5.1. Market Analysis, Insights and Forecast - by Technology
- 5.1.1. Power-to
- 5.1.2. Power-to-Methane (incl. Chemical and Biological)
- 5.2. Market Analysis, Insights and Forecast - by Capacity
- 5.2.1. More than 1000 KW
- 5.2.2. 100 to 1000 KW
- 5.2.3. Less than 100 KW
- 5.3. Market Analysis, Insights and Forecast - by End-User
- 5.3.1. Utilities
- 5.3.2. Industrial
- 5.3.3. Commercial
- 5.4. Market Analysis, Insights and Forecast - by Location
- 5.4.1. United Kingdom
- 5.4.2. Germany
- 5.4.3. France
- 5.4.4. Spain
- 5.4.5. Others
- 5.5. Market Analysis, Insights and Forecast - by Region
- 5.5.1. Europe
- 5.1. Market Analysis, Insights and Forecast - by Technology
- 6. Europe Power to Gas Market Analysis, Insights and Forecast, 2021-2033
- 6.1. Market Analysis, Insights and Forecast - by Technology
- 6.1.1. Power-to
- 6.1.2. Power-to-Methane (incl. Chemical and Biological)
- 6.2. Market Analysis, Insights and Forecast - by Capacity
- 6.2.1. More than 1000 KW
- 6.2.2. 100 to 1000 KW
- 6.2.3. Less than 100 KW
- 6.3. Market Analysis, Insights and Forecast - by End-User
- 6.3.1. Utilities
- 6.3.2. Industrial
- 6.3.3. Commercial
- 6.4. Market Analysis, Insights and Forecast - by Location
- 6.4.1. United Kingdom
- 6.4.2. Germany
- 6.4.3. France
- 6.4.4. Spain
- 6.4.5. Others
- 6.1. Market Analysis, Insights and Forecast - by Technology
- 7. Competitive Analysis
- 7.1. Company Profiles
- 7.1.1 Siemens Energy AG
- 7.1.1.1. Company Overview
- 7.1.1.2. Products
- 7.1.1.3. Company Financials
- 7.1.1.4. SWOT Analysis
- 7.1.2 GRT Gaz SA
- 7.1.2.1. Company Overview
- 7.1.2.2. Products
- 7.1.2.3. Company Financials
- 7.1.2.4. SWOT Analysis
- 7.1.3 AquahydreX Inc
- 7.1.3.1. Company Overview
- 7.1.3.2. Products
- 7.1.3.3. Company Financials
- 7.1.3.4. SWOT Analysis
- 7.1.4 Ineratec GmbH
- 7.1.4.1. Company Overview
- 7.1.4.2. Products
- 7.1.4.3. Company Financials
- 7.1.4.4. SWOT Analysis
- 7.1.5 Electrochaea GmbH
- 7.1.5.1. Company Overview
- 7.1.5.2. Products
- 7.1.5.3. Company Financials
- 7.1.5.4. SWOT Analysis
- 7.1.6 Sempra Energy
- 7.1.6.1. Company Overview
- 7.1.6.2. Products
- 7.1.6.3. Company Financials
- 7.1.6.4. SWOT Analysis
- 7.1.7 Nel ASA
- 7.1.7.1. Company Overview
- 7.1.7.2. Products
- 7.1.7.3. Company Financials
- 7.1.7.4. SWOT Analysis
- 7.1.1 Siemens Energy AG
- 7.2. Market Entropy
- 7.2.1 Company's Key Areas Served
- 7.2.2 Recent Developments
- 7.3. Company Market Share Analysis 2025
- 7.3.1 Top 5 Companies Market Share Analysis
- 7.3.2 Top 3 Companies Market Share Analysis
- 7.4. List of Potential Customers
- 8. Research Methodology
List of Figures
- Figure 1: Europe Power to Gas Market Revenue Breakdown (billion, %) by Product 2025 & 2033
- Figure 2: Europe Power to Gas Market Share (%) by Company 2025
List of Tables
- Table 1: Europe Power to Gas Market Revenue billion Forecast, by Technology 2020 & 2033
- Table 2: Europe Power to Gas Market Volume Gigawatt Forecast, by Technology 2020 & 2033
- Table 3: Europe Power to Gas Market Revenue billion Forecast, by Capacity 2020 & 2033
- Table 4: Europe Power to Gas Market Volume Gigawatt Forecast, by Capacity 2020 & 2033
- Table 5: Europe Power to Gas Market Revenue billion Forecast, by End-User 2020 & 2033
- Table 6: Europe Power to Gas Market Volume Gigawatt Forecast, by End-User 2020 & 2033
- Table 7: Europe Power to Gas Market Revenue billion Forecast, by Location 2020 & 2033
- Table 8: Europe Power to Gas Market Volume Gigawatt Forecast, by Location 2020 & 2033
- Table 9: Europe Power to Gas Market Revenue billion Forecast, by Region 2020 & 2033
- Table 10: Europe Power to Gas Market Volume Gigawatt Forecast, by Region 2020 & 2033
- Table 11: Europe Power to Gas Market Revenue billion Forecast, by Technology 2020 & 2033
- Table 12: Europe Power to Gas Market Volume Gigawatt Forecast, by Technology 2020 & 2033
- Table 13: Europe Power to Gas Market Revenue billion Forecast, by Capacity 2020 & 2033
- Table 14: Europe Power to Gas Market Volume Gigawatt Forecast, by Capacity 2020 & 2033
- Table 15: Europe Power to Gas Market Revenue billion Forecast, by End-User 2020 & 2033
- Table 16: Europe Power to Gas Market Volume Gigawatt Forecast, by End-User 2020 & 2033
- Table 17: Europe Power to Gas Market Revenue billion Forecast, by Location 2020 & 2033
- Table 18: Europe Power to Gas Market Volume Gigawatt Forecast, by Location 2020 & 2033
- Table 19: Europe Power to Gas Market Revenue billion Forecast, by Country 2020 & 2033
- Table 20: Europe Power to Gas Market Volume Gigawatt Forecast, by Country 2020 & 2033
- Table 21: United Kingdom Europe Power to Gas Market Revenue (billion) Forecast, by Application 2020 & 2033
- Table 22: United Kingdom Europe Power to Gas Market Volume (Gigawatt) Forecast, by Application 2020 & 2033
- Table 23: Germany Europe Power to Gas Market Revenue (billion) Forecast, by Application 2020 & 2033
- Table 24: Germany Europe Power to Gas Market Volume (Gigawatt) Forecast, by Application 2020 & 2033
- Table 25: France Europe Power to Gas Market Revenue (billion) Forecast, by Application 2020 & 2033
- Table 26: France Europe Power to Gas Market Volume (Gigawatt) Forecast, by Application 2020 & 2033
- Table 27: Italy Europe Power to Gas Market Revenue (billion) Forecast, by Application 2020 & 2033
- Table 28: Italy Europe Power to Gas Market Volume (Gigawatt) Forecast, by Application 2020 & 2033
- Table 29: Spain Europe Power to Gas Market Revenue (billion) Forecast, by Application 2020 & 2033
- Table 30: Spain Europe Power to Gas Market Volume (Gigawatt) Forecast, by Application 2020 & 2033
- Table 31: Netherlands Europe Power to Gas Market Revenue (billion) Forecast, by Application 2020 & 2033
- Table 32: Netherlands Europe Power to Gas Market Volume (Gigawatt) Forecast, by Application 2020 & 2033
- Table 33: Belgium Europe Power to Gas Market Revenue (billion) Forecast, by Application 2020 & 2033
- Table 34: Belgium Europe Power to Gas Market Volume (Gigawatt) Forecast, by Application 2020 & 2033
- Table 35: Sweden Europe Power to Gas Market Revenue (billion) Forecast, by Application 2020 & 2033
- Table 36: Sweden Europe Power to Gas Market Volume (Gigawatt) Forecast, by Application 2020 & 2033
- Table 37: Norway Europe Power to Gas Market Revenue (billion) Forecast, by Application 2020 & 2033
- Table 38: Norway Europe Power to Gas Market Volume (Gigawatt) Forecast, by Application 2020 & 2033
- Table 39: Poland Europe Power to Gas Market Revenue (billion) Forecast, by Application 2020 & 2033
- Table 40: Poland Europe Power to Gas Market Volume (Gigawatt) Forecast, by Application 2020 & 2033
- Table 41: Denmark Europe Power to Gas Market Revenue (billion) Forecast, by Application 2020 & 2033
- Table 42: Denmark Europe Power to Gas Market Volume (Gigawatt) Forecast, by Application 2020 & 2033
Frequently Asked Questions
1. What is the projected Compound Annual Growth Rate (CAGR) of the Europe Power to Gas Market?
The projected CAGR is approximately 11.35%.
2. Which companies are prominent players in the Europe Power to Gas Market?
Key companies in the market include Siemens Energy AG, GRT Gaz SA, AquahydreX Inc, Ineratec GmbH, Electrochaea GmbH, Sempra Energy, Nel ASA.
3. What are the main segments of the Europe Power to Gas Market?
The market segments include Technology, Capacity, End-User, Location.
4. Can you provide details about the market size?
The market size is estimated to be USD 46.76 billion as of 2022.
5. What are some drivers contributing to market growth?
4.; Growing Demand to Develop the Natural Gas Infrastructure4.; Increase in Offshore Oil and Gas Exploration and Production (E&P) Activities.
6. What are the notable trends driving market growth?
Germany is going to dominate the market.
7. Are there any restraints impacting market growth?
4.; High Volatility of Oil and Gas Prices.
8. Can you provide examples of recent developments in the market?
In March 2022. Environmental Resources Management's (ERM) ERM Dolphyn and Source Energie have entered into a partnership to develop a 200 floating wind to hydrogen project in the United Kingdom. The project is expected to be commissioned by 2027 and is likely to produce green hydrogen.
9. What pricing options are available for accessing the report?
Pricing options include single-user, multi-user, and enterprise licenses priced at USD 4750, USD 5250, and USD 8750 respectively.
10. Is the market size provided in terms of value or volume?
The market size is provided in terms of value, measured in billion and volume, measured in Gigawatt.
11. Are there any specific market keywords associated with the report?
Yes, the market keyword associated with the report is "Europe Power to Gas Market," which aids in identifying and referencing the specific market segment covered.
12. How do I determine which pricing option suits my needs best?
The pricing options vary based on user requirements and access needs. Individual users may opt for single-user licenses, while businesses requiring broader access may choose multi-user or enterprise licenses for cost-effective access to the report.
13. Are there any additional resources or data provided in the Europe Power to Gas Market report?
While the report offers comprehensive insights, it's advisable to review the specific contents or supplementary materials provided to ascertain if additional resources or data are available.
14. How can I stay updated on further developments or reports in the Europe Power to Gas Market?
To stay informed about further developments, trends, and reports in the Europe Power to Gas Market, consider subscribing to industry newsletters, following relevant companies and organizations, or regularly checking reputable industry news sources and publications.
Methodology
Step 1 - Identification of Relevant Samples Size from Population Database


Step 2 - Approaches for Defining Global Market Size (Value, Volume* & Price*)

Note*: In applicable scenarios
Step 3 - Data Sources
Primary Research
- Web Analytics
- Survey Reports
- Research Institute
- Latest Research Reports
- Opinion Leaders
Secondary Research
- Annual Reports
- White Paper
- Latest Press Release
- Industry Association
- Paid Database
- Investor Presentations

Step 4 - Data Triangulation
Involves using different sources of information in order to increase the validity of a study
These sources are likely to be stakeholders in a program - participants, other researchers, program staff, other community members, and so on.
Then we put all data in single framework & apply various statistical tools to find out the dynamic on the market.
During the analysis stage, feedback from the stakeholder groups would be compared to determine areas of agreement as well as areas of divergence