

Key Insights
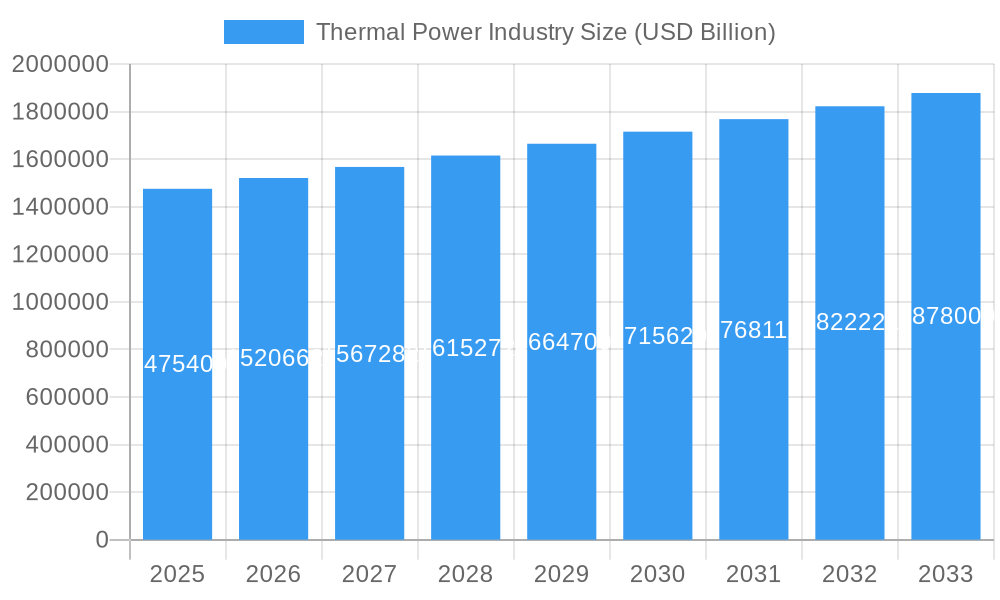
The global Thermal Power Industry is poised for steady expansion, with a current market size of USD 1,475.40 billion and a projected Compound Annual Growth Rate (CAGR) of 3% over the forecast period of 2025-2033. This sustained growth is primarily driven by the ongoing demand for reliable and baseload electricity generation to support industrial activities and meet the increasing energy needs of a growing global population. While the industry faces challenges related to environmental regulations and the push towards renewable energy sources, its essential role in ensuring grid stability and providing a consistent power supply will continue to fuel its market presence. The diverse fuel types within the thermal power sector, including coal, natural gas, and nuclear energy, highlight the industry's adaptability and its ability to cater to varying regional energy landscapes and resource availabilities. Key players like Iberdrola S.A., Electricite de France S.A., and Siemens AG are actively involved in technological advancements and strategic partnerships to optimize operational efficiencies and explore cleaner thermal generation technologies.
Thermal Power Industry Market Size (In Million)
The thermal power sector's evolution is marked by significant trends aimed at mitigating its environmental impact and enhancing efficiency. Investments in advanced combustion technologies, carbon capture, utilization, and storage (CCUS) solutions, and the integration of cleaner-burning natural gas are becoming increasingly prevalent. These initiatives are crucial for addressing concerns surrounding greenhouse gas emissions and aligning with global climate objectives. However, stringent environmental policies and the escalating adoption of renewable energy sources like solar and wind present considerable restraints to the industry's unbridled growth. Despite these headwinds, the inherent advantages of thermal power, such as dispatchability and capacity factors, ensure its continued relevance in the energy mix. Regions like Asia Pacific, driven by rapid industrialization and expanding economies, are expected to exhibit robust demand for thermal power, while North America and Europe are likely to focus on modernizing existing infrastructure and transitioning towards more sustainable thermal generation methods. The strategic presence of major companies like General Electric Company and National Thermal Power Corporation Limited underscores the global nature and competitive landscape of this vital industry.
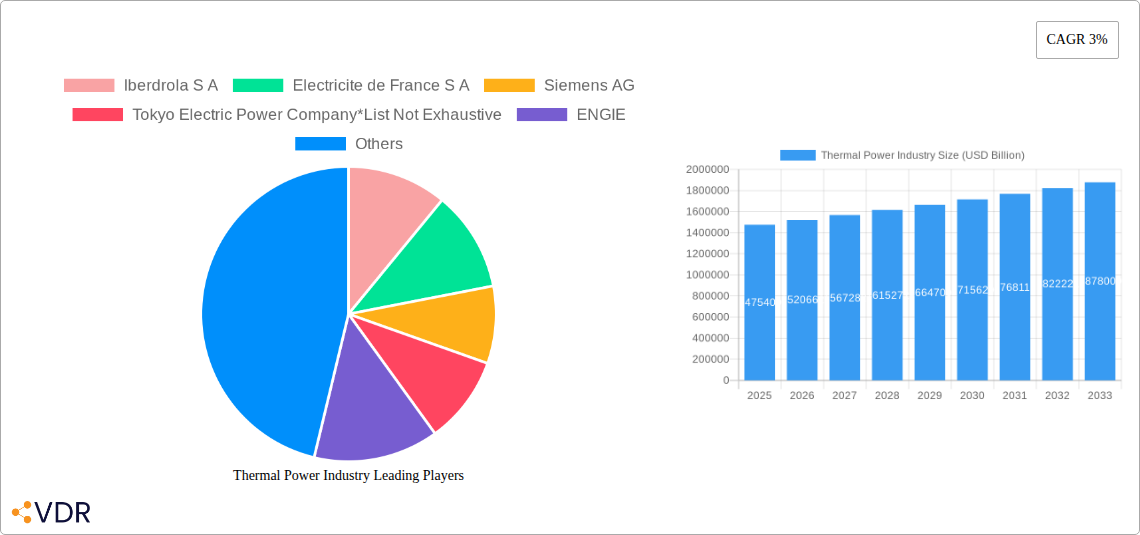
Thermal Power Industry Company Market Share
Thermal Power Industry Report: Market Dynamics, Growth Trends, and Future Outlook (2019-2033)
This comprehensive report offers an in-depth analysis of the global Thermal Power Industry, providing critical insights into its market dynamics, growth trajectories, and future outlook. Spanning a study period from 2019 to 2033, with a base year of 2025 and a forecast period of 2025–2033, this report is designed for industry professionals, investors, and stakeholders seeking to understand the evolving landscape of thermal power generation. The report meticulously examines key segments, including Coal, Gas, Nuclear, and Others, and analyzes the impact of crucial industry developments such as the development of new, more efficient thermal power technologies, the adoption of renewable energy sources, and the implementation of stricter environmental regulations. The market is valued in USD Billion units, with all quantitative data presented accordingly.
Thermal Power Industry Market Dynamics & Structure
The global Thermal Power Industry is characterized by a complex interplay of market concentration, technological innovation drivers, regulatory frameworks, and competitive product substitutes. Major players like Iberdrola S A, Electricite de France S A, Siemens AG, Tokyo Electric Power Company, ENGIE, National Thermal Power Corporation Limited, General Electric Company, Chubu Electric Power Co Inc, ABB, and Bharat Heavy Electricals Limited (BHEL) exert significant influence, though market concentration varies across different regional segments and fuel types. Technological innovation, particularly in enhancing efficiency and reducing emissions for coal and gas-fired power plants, is a primary driver. However, the accelerating adoption of renewable energy sources presents a substantial competitive threat, necessitating continuous investment in advanced thermal power technologies. Regulatory frameworks, driven by environmental concerns and climate change mitigation efforts, are increasingly shaping investment decisions and operational standards. Merger and acquisition (M&A) trends within the sector reflect strategic realignments, with companies consolidating to gain market share or divest from carbon-intensive assets.
- Market Concentration: Moderate to high in developed regions, with increasing fragmentation in developing economies.
- Technological Innovation Drivers: Efficiency improvements, emissions reduction, carbon capture technologies, and integration with renewable energy systems.
- Regulatory Frameworks: Stringent environmental regulations, carbon pricing mechanisms, and renewable energy mandates impacting investment and operational strategies.
- Competitive Product Substitutes: Renewable energy sources (solar, wind, hydro), battery storage, and advancements in grid modernization.
- End-User Demographics: Industrial, commercial, and residential sectors relying on stable and consistent power supply.
- M&A Trends: Consolidation for operational efficiency, strategic divestments of fossil fuel assets, and acquisitions in renewable energy and grid infrastructure.
Thermal Power Industry Growth Trends & Insights
The global Thermal Power Industry is undergoing a significant transformation, driven by evolving energy policies, technological advancements, and shifting consumer preferences. The market size for thermal power generation is projected to experience a dynamic evolution, influenced by the sustained demand for baseload power in many regions while simultaneously confronting the rapid growth of renewable energy sources. In the base year of 2025, the global thermal power market is estimated to be valued at USD 1,850.75 Billion. The historical period (2019–2024) witnessed steady growth, with the market reaching approximately USD 1,700.20 Billion in 2024. Looking ahead, the forecast period (2025–2033) is expected to see a compound annual growth rate (CAGR) of 3.10%, culminating in a market valuation of approximately USD 2,370.50 Billion by 2033.
Technological disruptions are at the forefront of this evolution. The development of new, more efficient thermal power technologies, including advanced gas turbines and supercritical/ultra-supercritical coal technologies, aims to improve operational performance and reduce environmental impact. However, the increasing adoption of renewable energy sources, such as solar and wind power, is a major disruptor, leading to a decline in the market share of traditional thermal power in some regions. This necessitates a strategic shift within the thermal power industry towards flexible generation that can complement intermittent renewables and ensure grid stability.
Consumer behavior is also a critical factor, with a growing emphasis on sustainability and reduced carbon footprints influencing energy procurement decisions. Governments and utility companies are increasingly investing in cleaner thermal power solutions, such as combined heat and power (CHP) systems and advanced nuclear technologies, alongside significant investments in renewable energy portfolios. The implementation of stricter environmental regulations worldwide is further accelerating this transition, compelling operators to upgrade existing facilities or invest in cleaner generation methods. This dynamic environment presents both challenges and opportunities for market participants. The market penetration of renewables continues to rise, impacting the demand for new thermal power capacity, while the need for reliable baseload power ensures a continued, albeit evolving, role for thermal generation. The industry is witnessing a heightened focus on energy transition strategies, integrating advanced thermal power solutions with decarbonization goals.
Dominant Regions, Countries, or Segments in Thermal Power Industry
The global Thermal Power Industry exhibits distinct regional dominance, driven by a confluence of economic policies, existing infrastructure, and energy demand patterns. Among the fuel types, Gas currently emerges as a dominant segment, driven by its relative cleaner profile compared to coal and its flexibility in complementing renewable energy sources. In the base year of 2025, the Gas segment is estimated to hold a market share of 45.50%, valued at USD 841.69 Billion.
Asia-Pacific is the leading region, accounting for approximately 40% of the global thermal power market in 2025, with a market value of USD 740.30 Billion. This dominance is propelled by rapid industrialization, a burgeoning population, and the sustained demand for electricity to fuel economic growth. Countries like China and India are major contributors, heavily relying on thermal power, particularly coal and increasingly natural gas, to meet their vast energy requirements.
- Key Drivers in Asia-Pacific:
- Economic Growth and Industrialization: Rapid expansion of manufacturing and industrial sectors requiring substantial and reliable electricity supply.
- Growing Population and Urbanization: Increasing household and commercial energy consumption.
- Energy Security Concerns: Diversification of energy sources to reduce reliance on imports, with domestic coal reserves playing a significant role in some nations.
- Existing Infrastructure: Large installed base of thermal power plants, particularly coal-fired, requiring ongoing operation and modernization.
- Government Policies: Support for domestic energy production and infrastructure development, though increasingly balanced with renewable energy targets.
While Coal remains a significant fuel source, particularly in developing economies, its dominance is being challenged by environmental regulations and the rise of gas and renewables. The Coal segment is expected to be valued at USD 639.26 Billion in 2025, representing 34.54% of the market. Nuclear power, while a crucial source of low-carbon baseload energy, faces challenges related to high capital costs, public perception, and waste disposal, contributing 15.20% or USD 281.21 Billion in 2025. The Others segment, encompassing biomass and geothermal, is projected to contribute 4.76%, or USD 88.49 Billion, in 2025.
The dominance of gas is further bolstered by its lower carbon emissions compared to coal and its inherent flexibility, allowing for rapid ramp-up and ramp-down to support the integration of intermittent renewable energy sources. This characteristic makes gas-fired power plants critical for grid stability in the energy transition. The substantial investments in new gas infrastructure and the conversion of older coal plants to gas in many developed and developing nations underscore its strategic importance in the current energy landscape.
Thermal Power Industry Product Landscape
The product landscape within the Thermal Power Industry is characterized by continuous innovation aimed at enhancing efficiency, reducing environmental impact, and ensuring reliability. Advanced gas turbines, supercritical and ultra-supercritical steam turbines for coal power plants, and modular nuclear reactor designs represent key technological advancements. These products are designed to operate at higher temperatures and pressures, leading to improved thermal efficiency and reduced fuel consumption. Furthermore, the integration of carbon capture, utilization, and storage (CCUS) technologies with thermal power plants is a significant area of development, aiming to mitigate greenhouse gas emissions. The performance metrics of these products are constantly being refined, with a focus on lower emissions per unit of electricity generated, higher operational flexibility, and extended service life. Unique selling propositions often revolve around fuel flexibility, lower operational costs, and adherence to stringent environmental standards, positioning these advanced thermal power solutions as crucial components of a balanced and sustainable energy mix.
Key Drivers, Barriers & Challenges in Thermal Power Industry
Key Drivers:
- Growing Global Energy Demand: Continued expansion of economies and populations worldwide necessitates increased electricity generation.
- Baseload Power Requirements: Thermal power plants, particularly nuclear and efficient gas plants, provide essential stable and reliable electricity to complement intermittent renewables.
- Technological Advancements: Development of more efficient, cleaner, and flexible thermal power generation technologies, including advanced turbines and CCUS.
- Energy Security: Countries seeking to diversify their energy mix and ensure a consistent domestic power supply often rely on thermal generation.
- Grid Stability and Flexibility: Gas-fired power plants are crucial for balancing the grid with the increasing integration of renewable energy sources.
Key Barriers & Challenges:
- Environmental Regulations and Climate Change Concerns: Stricter emissions standards and the global push towards decarbonization pose significant challenges for fossil fuel-based thermal power.
- Competition from Renewable Energy Sources: Rapidly falling costs and increasing deployment of solar, wind, and battery storage offer competitive alternatives.
- High Capital Investment and Long Lead Times: Building new thermal power plants, especially nuclear facilities, requires substantial upfront investment and lengthy construction periods.
- Fuel Price Volatility: Fluctuations in the prices of coal, natural gas, and uranium can impact the operational costs and profitability of thermal power plants.
- Public Perception and Social License: Concerns over pollution, greenhouse gas emissions, and nuclear safety can lead to public opposition and regulatory hurdles.
- Aging Infrastructure: Many existing thermal power plants are aging and require significant investment for upgrades or decommissioning, posing operational and environmental risks.
- Supply Chain Disruptions: Global supply chain issues can impact the availability of critical components and materials for plant construction and maintenance, with potential cost increases. The ongoing geopolitical landscape can also influence fuel availability and price stability, affecting operational costs by an estimated 10-15% in some instances.
Emerging Opportunities in Thermal Power Industry
Emerging opportunities within the Thermal Power Industry lie in the strategic adaptation and integration of advanced technologies. The development and deployment of Carbon Capture, Utilization, and Storage (CCUS) technologies present a significant avenue for existing fossil fuel power plants to reduce their carbon footprint and continue operating under stricter environmental regulations. Furthermore, the growing demand for hydrogen as a fuel creates an opportunity for thermal power plants to co-fire or transition to hydrogen combustion, offering a pathway to decarbonized power generation. Advanced modular reactors (AMRs) in the nuclear sector offer potential for smaller, more scalable, and safer nuclear power solutions, catering to specific regional demands. The industry can also capitalize on the need for flexible and dispatchable power to support the grid as renewable energy penetration increases, focusing on high-efficiency gas turbines and integrated energy storage solutions.
Growth Accelerators in the Thermal Power Industry Industry
Several key catalysts are driving long-term growth and transformation within the Thermal Power Industry. Technological breakthroughs in supercritical and ultra-supercritical coal technologies coupled with advanced gas turbine designs are significantly enhancing operational efficiency and reducing emissions. The ongoing global push for energy security continues to underpin the demand for reliable baseload power, which thermal generation provides. Strategic partnerships between traditional power companies and technology providers are fostering innovation in areas like CCUS and hydrogen combustion. Furthermore, the strategic expansion of liquefied natural gas (LNG) infrastructure globally is making natural gas a more accessible and versatile fuel source for power generation, particularly in regions with limited domestic reserves. Investments in modernization and life extension of existing thermal power assets also represent a significant growth area, ensuring continued operation and improved performance.
Key Players Shaping the Thermal Power Industry Market
- Iberdrola S A
- Electricite de France S A
- Siemens AG
- Tokyo Electric Power Company
- ENGIE
- National Thermal Power Corporation Limited
- General Electric Company
- Chubu Electric Power Co Inc
- ABB
- Bharat Heavy Electricals Limited (BHEL)
Notable Milestones in Thermal Power Industry Sector
- 2020: Significant advancements reported in development of new, more efficient thermal power technologies, with several companies showcasing next-generation gas turbines achieving higher efficiency rates exceeding 60%.
- 2021: Increased focus on the adoption of renewable energy sources as major utility companies announce ambitious targets for renewable energy integration, impacting investment strategies for new thermal power projects.
- 2022: The implementation of stricter environmental regulations in key markets, such as the European Union's tightening of emissions standards for power plants, spurred investment in retrofitting existing facilities and exploring cleaner fuel options.
- 2023: Launch of several pilot projects for carbon capture, utilization, and storage (CCUS) technologies integrated with gas-fired power plants, demonstrating potential for significant emissions reduction.
- 2024: Major M&A activities observed with General Electric Company divesting some of its thermal power assets while focusing on its cleaner energy solutions portfolio.
In-Depth Thermal Power Industry Market Outlook
The Thermal Power Industry is poised for continued evolution, driven by a complex interplay of energy security needs, technological innovation, and environmental imperatives. The market outlook remains robust, fueled by the indispensable role of thermal power in providing baseload and dispatchable electricity to support global grids, particularly as renewable energy penetration escalates. Growth accelerators such as advancements in carbon capture technologies and the increasing viability of hydrogen as a fuel offer promising pathways for decarbonizing thermal generation. Strategic investments in upgrading and modernizing existing power plants will ensure their continued contribution to the energy mix while adhering to stricter environmental standards. Furthermore, the development of advanced modular nuclear reactors presents an opportunity for smaller, more flexible, and potentially safer nuclear power deployments. The industry is expected to witness a strategic shift towards more efficient, flexible, and lower-emission thermal power solutions, ensuring its integral role in a sustainable and reliable global energy future.
Thermal Power Industry Segmentation
-
1. Fuel Type
- 1.1. Coal
- 1.2. Gas
- 1.3. Nuclear
- 1.4. Others
Thermal Power Industry Segmentation By Geography
- 1. North America
- 2. Asia Pacific
- 3. Europe
- 4. South America
- 5. Middle East and Africa
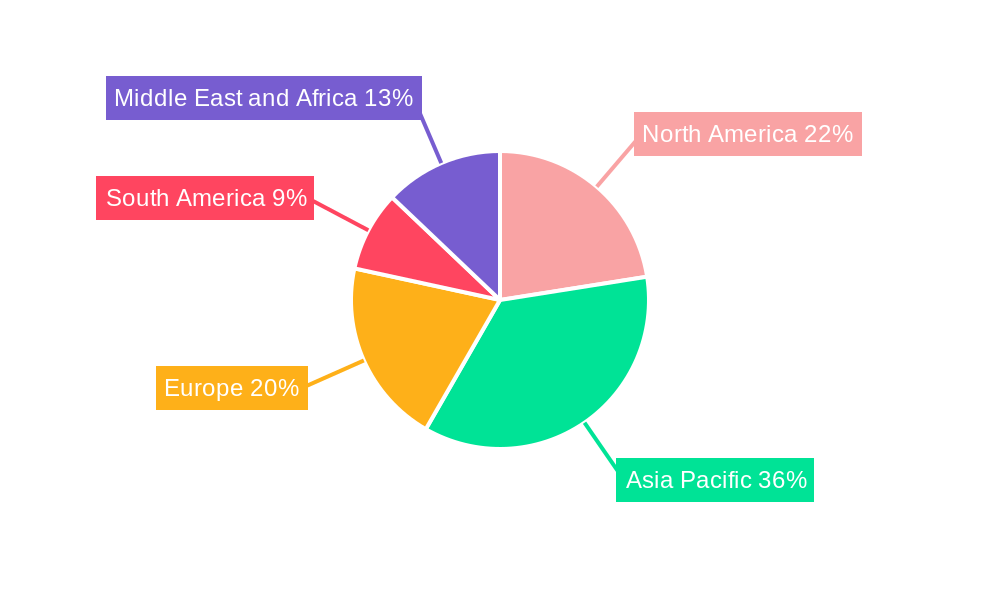
Thermal Power Industry Regional Market Share
Geographic Coverage of Thermal Power Industry
Thermal Power Industry REPORT HIGHLIGHTS
| Aspects | Details |
|---|---|
| Study Period | 2020-2034 |
| Base Year | 2025 |
| Estimated Year | 2026 |
| Forecast Period | 2026-2034 |
| Historical Period | 2020-2025 |
| Growth Rate | CAGR of 3% from 2020-2034 |
| Segmentation |
|
Table of Contents
- 1. Introduction
- 1.1. Research Scope
- 1.2. Market Segmentation
- 1.3. Research Objective
- 1.4. Definitions and Assumptions
- 2. Executive Summary
- 2.1. Market Snapshot
- 3. Market Dynamics
- 3.1. Market Drivers
- 3.2. Market Restrains
- 3.3. Market Trends
- 3.4. Market Opportunities
- 4. Market Factor Analysis
- 4.1. Porters Five Forces
- 4.1.1. Bargaining Power of Suppliers
- 4.1.2. Bargaining Power of Buyers
- 4.1.3. Threat of New Entrants
- 4.1.4. Threat of Substitutes
- 4.1.5. Competitive Rivalry
- 4.2. PESTEL analysis
- 4.3. BCG Analysis
- 4.3.1. Stars (High Growth, High Market Share)
- 4.3.2. Cash Cows (Low Growth, High Market Share)
- 4.3.3. Question Mark (High Growth, Low Market Share)
- 4.3.4. Dogs (Low Growth, Low Market Share)
- 4.4. Ansoff Matrix Analysis
- 4.5. Supply Chain Analysis
- 4.6. Regulatory Landscape
- 4.7. Current Market Potential and Opportunity Assessment (TAM–SAM–SOM Framework)
- 4.8. VDR Analyst Note
- 4.1. Porters Five Forces
- 5. Market Analysis, Insights and Forecast 2021-2033
- 5.1. Market Analysis, Insights and Forecast - by Fuel Type
- 5.1.1. Coal
- 5.1.2. Gas
- 5.1.3. Nuclear
- 5.1.4. Others
- 5.2. Market Analysis, Insights and Forecast - by Region
- 5.2.1. North America
- 5.2.2. Asia Pacific
- 5.2.3. Europe
- 5.2.4. South America
- 5.2.5. Middle East and Africa
- 5.1. Market Analysis, Insights and Forecast - by Fuel Type
- 6. Global Thermal Power Industry Analysis, Insights and Forecast, 2021-2033
- 6.1. Market Analysis, Insights and Forecast - by Fuel Type
- 6.1.1. Coal
- 6.1.2. Gas
- 6.1.3. Nuclear
- 6.1.4. Others
- 6.1. Market Analysis, Insights and Forecast - by Fuel Type
- 7. North America Thermal Power Industry Analysis, Insights and Forecast, 2021-2033
- 7.1. Market Analysis, Insights and Forecast - by Fuel Type
- 7.1.1. Coal
- 7.1.2. Gas
- 7.1.3. Nuclear
- 7.1.4. Others
- 7.1. Market Analysis, Insights and Forecast - by Fuel Type
- 8. Asia Pacific Thermal Power Industry Analysis, Insights and Forecast, 2021-2033
- 8.1. Market Analysis, Insights and Forecast - by Fuel Type
- 8.1.1. Coal
- 8.1.2. Gas
- 8.1.3. Nuclear
- 8.1.4. Others
- 8.1. Market Analysis, Insights and Forecast - by Fuel Type
- 9. Europe Thermal Power Industry Analysis, Insights and Forecast, 2021-2033
- 9.1. Market Analysis, Insights and Forecast - by Fuel Type
- 9.1.1. Coal
- 9.1.2. Gas
- 9.1.3. Nuclear
- 9.1.4. Others
- 9.1. Market Analysis, Insights and Forecast - by Fuel Type
- 10. South America Thermal Power Industry Analysis, Insights and Forecast, 2021-2033
- 10.1. Market Analysis, Insights and Forecast - by Fuel Type
- 10.1.1. Coal
- 10.1.2. Gas
- 10.1.3. Nuclear
- 10.1.4. Others
- 10.1. Market Analysis, Insights and Forecast - by Fuel Type
- 11. Middle East and Africa Thermal Power Industry Analysis, Insights and Forecast, 2021-2033
- 11.1. Market Analysis, Insights and Forecast - by Fuel Type
- 11.1.1. Coal
- 11.1.2. Gas
- 11.1.3. Nuclear
- 11.1.4. Others
- 11.1. Market Analysis, Insights and Forecast - by Fuel Type
- 12. Competitive Analysis
- 12.1. Company Profiles
- 12.1.1 Iberdrola S A
- 12.1.1.1. Company Overview
- 12.1.1.2. Products
- 12.1.1.3. Company Financials
- 12.1.1.4. SWOT Analysis
- 12.1.2 Electricite de France S A
- 12.1.2.1. Company Overview
- 12.1.2.2. Products
- 12.1.2.3. Company Financials
- 12.1.2.4. SWOT Analysis
- 12.1.3 Siemens AG
- 12.1.3.1. Company Overview
- 12.1.3.2. Products
- 12.1.3.3. Company Financials
- 12.1.3.4. SWOT Analysis
- 12.1.4 Tokyo Electric Power Company*List Not Exhaustive
- 12.1.4.1. Company Overview
- 12.1.4.2. Products
- 12.1.4.3. Company Financials
- 12.1.4.4. SWOT Analysis
- 12.1.5 ENGIE
- 12.1.5.1. Company Overview
- 12.1.5.2. Products
- 12.1.5.3. Company Financials
- 12.1.5.4. SWOT Analysis
- 12.1.6 National Thermal Power Corporation Limited
- 12.1.6.1. Company Overview
- 12.1.6.2. Products
- 12.1.6.3. Company Financials
- 12.1.6.4. SWOT Analysis
- 12.1.7 General Electric Company
- 12.1.7.1. Company Overview
- 12.1.7.2. Products
- 12.1.7.3. Company Financials
- 12.1.7.4. SWOT Analysis
- 12.1.8 Chubu Electric Power Co Inc
- 12.1.8.1. Company Overview
- 12.1.8.2. Products
- 12.1.8.3. Company Financials
- 12.1.8.4. SWOT Analysis
- 12.1.9 ABB
- 12.1.9.1. Company Overview
- 12.1.9.2. Products
- 12.1.9.3. Company Financials
- 12.1.9.4. SWOT Analysis
- 12.1.10 Bharat Heavy Electricals Limited (BHEL)
- 12.1.10.1. Company Overview
- 12.1.10.2. Products
- 12.1.10.3. Company Financials
- 12.1.10.4. SWOT Analysis
- 12.1.1 Iberdrola S A
- 12.2. Market Entropy
- 12.2.1 Company's Key Areas Served
- 12.2.2 Recent Developments
- 12.3. Company Market Share Analysis 2025
- 12.3.1 Top 5 Companies Market Share Analysis
- 12.3.2 Top 3 Companies Market Share Analysis
- 12.4. List of Potential Customers
- 13. Research Methodology
List of Figures
- Figure 1: Global Thermal Power Industry Revenue Breakdown (USD Billion, %) by Region 2025 & 2033
- Figure 2: Global Thermal Power Industry Volume Breakdown (Megawatt, %) by Region 2025 & 2033
- Figure 3: North America Thermal Power Industry Revenue (USD Billion), by Fuel Type 2025 & 2033
- Figure 4: North America Thermal Power Industry Volume (Megawatt), by Fuel Type 2025 & 2033
- Figure 5: North America Thermal Power Industry Revenue Share (%), by Fuel Type 2025 & 2033
- Figure 6: North America Thermal Power Industry Volume Share (%), by Fuel Type 2025 & 2033
- Figure 7: North America Thermal Power Industry Revenue (USD Billion), by Country 2025 & 2033
- Figure 8: North America Thermal Power Industry Volume (Megawatt), by Country 2025 & 2033
- Figure 9: North America Thermal Power Industry Revenue Share (%), by Country 2025 & 2033
- Figure 10: North America Thermal Power Industry Volume Share (%), by Country 2025 & 2033
- Figure 11: Asia Pacific Thermal Power Industry Revenue (USD Billion), by Fuel Type 2025 & 2033
- Figure 12: Asia Pacific Thermal Power Industry Volume (Megawatt), by Fuel Type 2025 & 2033
- Figure 13: Asia Pacific Thermal Power Industry Revenue Share (%), by Fuel Type 2025 & 2033
- Figure 14: Asia Pacific Thermal Power Industry Volume Share (%), by Fuel Type 2025 & 2033
- Figure 15: Asia Pacific Thermal Power Industry Revenue (USD Billion), by Country 2025 & 2033
- Figure 16: Asia Pacific Thermal Power Industry Volume (Megawatt), by Country 2025 & 2033
- Figure 17: Asia Pacific Thermal Power Industry Revenue Share (%), by Country 2025 & 2033
- Figure 18: Asia Pacific Thermal Power Industry Volume Share (%), by Country 2025 & 2033
- Figure 19: Europe Thermal Power Industry Revenue (USD Billion), by Fuel Type 2025 & 2033
- Figure 20: Europe Thermal Power Industry Volume (Megawatt), by Fuel Type 2025 & 2033
- Figure 21: Europe Thermal Power Industry Revenue Share (%), by Fuel Type 2025 & 2033
- Figure 22: Europe Thermal Power Industry Volume Share (%), by Fuel Type 2025 & 2033
- Figure 23: Europe Thermal Power Industry Revenue (USD Billion), by Country 2025 & 2033
- Figure 24: Europe Thermal Power Industry Volume (Megawatt), by Country 2025 & 2033
- Figure 25: Europe Thermal Power Industry Revenue Share (%), by Country 2025 & 2033
- Figure 26: Europe Thermal Power Industry Volume Share (%), by Country 2025 & 2033
- Figure 27: South America Thermal Power Industry Revenue (USD Billion), by Fuel Type 2025 & 2033
- Figure 28: South America Thermal Power Industry Volume (Megawatt), by Fuel Type 2025 & 2033
- Figure 29: South America Thermal Power Industry Revenue Share (%), by Fuel Type 2025 & 2033
- Figure 30: South America Thermal Power Industry Volume Share (%), by Fuel Type 2025 & 2033
- Figure 31: South America Thermal Power Industry Revenue (USD Billion), by Country 2025 & 2033
- Figure 32: South America Thermal Power Industry Volume (Megawatt), by Country 2025 & 2033
- Figure 33: South America Thermal Power Industry Revenue Share (%), by Country 2025 & 2033
- Figure 34: South America Thermal Power Industry Volume Share (%), by Country 2025 & 2033
- Figure 35: Middle East and Africa Thermal Power Industry Revenue (USD Billion), by Fuel Type 2025 & 2033
- Figure 36: Middle East and Africa Thermal Power Industry Volume (Megawatt), by Fuel Type 2025 & 2033
- Figure 37: Middle East and Africa Thermal Power Industry Revenue Share (%), by Fuel Type 2025 & 2033
- Figure 38: Middle East and Africa Thermal Power Industry Volume Share (%), by Fuel Type 2025 & 2033
- Figure 39: Middle East and Africa Thermal Power Industry Revenue (USD Billion), by Country 2025 & 2033
- Figure 40: Middle East and Africa Thermal Power Industry Volume (Megawatt), by Country 2025 & 2033
- Figure 41: Middle East and Africa Thermal Power Industry Revenue Share (%), by Country 2025 & 2033
- Figure 42: Middle East and Africa Thermal Power Industry Volume Share (%), by Country 2025 & 2033
List of Tables
- Table 1: Global Thermal Power Industry Revenue USD Billion Forecast, by Fuel Type 2020 & 2033
- Table 2: Global Thermal Power Industry Volume Megawatt Forecast, by Fuel Type 2020 & 2033
- Table 3: Global Thermal Power Industry Revenue USD Billion Forecast, by Region 2020 & 2033
- Table 4: Global Thermal Power Industry Volume Megawatt Forecast, by Region 2020 & 2033
- Table 5: Global Thermal Power Industry Revenue USD Billion Forecast, by Fuel Type 2020 & 2033
- Table 6: Global Thermal Power Industry Volume Megawatt Forecast, by Fuel Type 2020 & 2033
- Table 7: Global Thermal Power Industry Revenue USD Billion Forecast, by Country 2020 & 2033
- Table 8: Global Thermal Power Industry Volume Megawatt Forecast, by Country 2020 & 2033
- Table 9: Global Thermal Power Industry Revenue USD Billion Forecast, by Fuel Type 2020 & 2033
- Table 10: Global Thermal Power Industry Volume Megawatt Forecast, by Fuel Type 2020 & 2033
- Table 11: Global Thermal Power Industry Revenue USD Billion Forecast, by Country 2020 & 2033
- Table 12: Global Thermal Power Industry Volume Megawatt Forecast, by Country 2020 & 2033
- Table 13: Global Thermal Power Industry Revenue USD Billion Forecast, by Fuel Type 2020 & 2033
- Table 14: Global Thermal Power Industry Volume Megawatt Forecast, by Fuel Type 2020 & 2033
- Table 15: Global Thermal Power Industry Revenue USD Billion Forecast, by Country 2020 & 2033
- Table 16: Global Thermal Power Industry Volume Megawatt Forecast, by Country 2020 & 2033
- Table 17: Global Thermal Power Industry Revenue USD Billion Forecast, by Fuel Type 2020 & 2033
- Table 18: Global Thermal Power Industry Volume Megawatt Forecast, by Fuel Type 2020 & 2033
- Table 19: Global Thermal Power Industry Revenue USD Billion Forecast, by Country 2020 & 2033
- Table 20: Global Thermal Power Industry Volume Megawatt Forecast, by Country 2020 & 2033
- Table 21: Global Thermal Power Industry Revenue USD Billion Forecast, by Fuel Type 2020 & 2033
- Table 22: Global Thermal Power Industry Volume Megawatt Forecast, by Fuel Type 2020 & 2033
- Table 23: Global Thermal Power Industry Revenue USD Billion Forecast, by Country 2020 & 2033
- Table 24: Global Thermal Power Industry Volume Megawatt Forecast, by Country 2020 & 2033
Frequently Asked Questions
1. What is the projected Compound Annual Growth Rate (CAGR) of the Thermal Power Industry?
The projected CAGR is approximately 3%.
2. Which companies are prominent players in the Thermal Power Industry?
Key companies in the market include Iberdrola S A, Electricite de France S A, Siemens AG, Tokyo Electric Power Company*List Not Exhaustive, ENGIE, National Thermal Power Corporation Limited, General Electric Company, Chubu Electric Power Co Inc, ABB , Bharat Heavy Electricals Limited (BHEL).
3. What are the main segments of the Thermal Power Industry?
The market segments include Fuel Type.
4. Can you provide details about the market size?
The market size is estimated to be USD 1,475.40 USD Billion as of 2022.
5. What are some drivers contributing to market growth?
4.; Increasing investment in the Midstream Sector4.; Increasing Production of Oil and Natural Gas.
6. What are the notable trends driving market growth?
Natural Gas Power Plants to Witness Significant Growth.
7. Are there any restraints impacting market growth?
4.; Inadequate Infrastructure in the Country.
8. Can you provide examples of recent developments in the market?
The development of new, more efficient thermal power technologies
9. What pricing options are available for accessing the report?
Pricing options include single-user, multi-user, and enterprise licenses priced at USD 4750, USD 5250, and USD 8750 respectively.
10. Is the market size provided in terms of value or volume?
The market size is provided in terms of value, measured in USD Billion and volume, measured in Megawatt.
11. Are there any specific market keywords associated with the report?
Yes, the market keyword associated with the report is "Thermal Power Industry," which aids in identifying and referencing the specific market segment covered.
12. How do I determine which pricing option suits my needs best?
The pricing options vary based on user requirements and access needs. Individual users may opt for single-user licenses, while businesses requiring broader access may choose multi-user or enterprise licenses for cost-effective access to the report.
13. Are there any additional resources or data provided in the Thermal Power Industry report?
While the report offers comprehensive insights, it's advisable to review the specific contents or supplementary materials provided to ascertain if additional resources or data are available.
14. How can I stay updated on further developments or reports in the Thermal Power Industry?
To stay informed about further developments, trends, and reports in the Thermal Power Industry, consider subscribing to industry newsletters, following relevant companies and organizations, or regularly checking reputable industry news sources and publications.
Methodology
Step 1 - Identification of Relevant Samples Size from Population Database


Step 2 - Approaches for Defining Global Market Size (Value, Volume* & Price*)

Note*: In applicable scenarios
Step 3 - Data Sources
Primary Research
- Web Analytics
- Survey Reports
- Research Institute
- Latest Research Reports
- Opinion Leaders
Secondary Research
- Annual Reports
- White Paper
- Latest Press Release
- Industry Association
- Paid Database
- Investor Presentations

Step 4 - Data Triangulation
Involves using different sources of information in order to increase the validity of a study
These sources are likely to be stakeholders in a program - participants, other researchers, program staff, other community members, and so on.
Then we put all data in single framework & apply various statistical tools to find out the dynamic on the market.
During the analysis stage, feedback from the stakeholder groups would be compared to determine areas of agreement as well as areas of divergence