

Key Insights
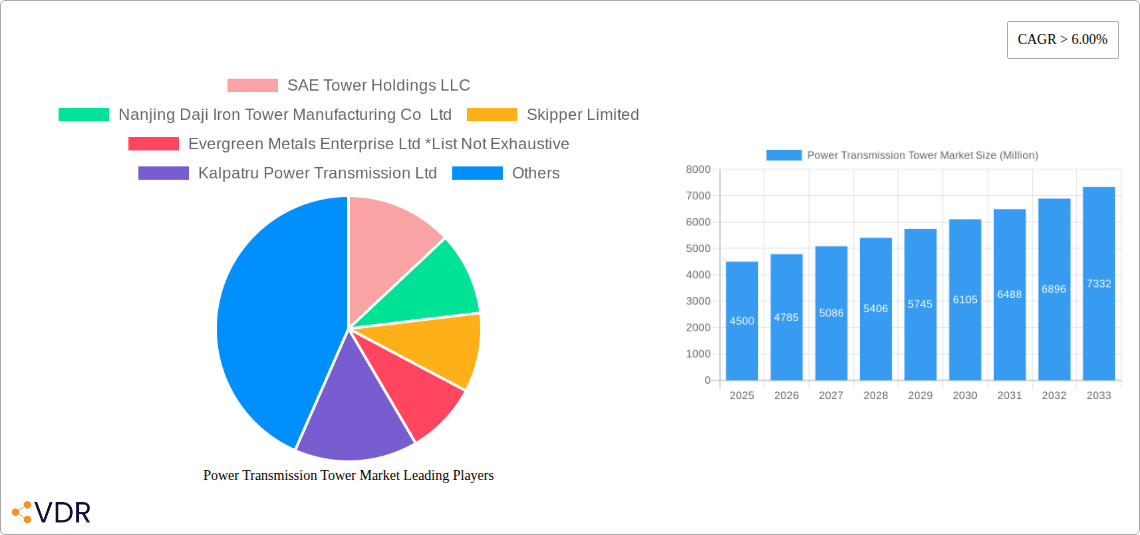
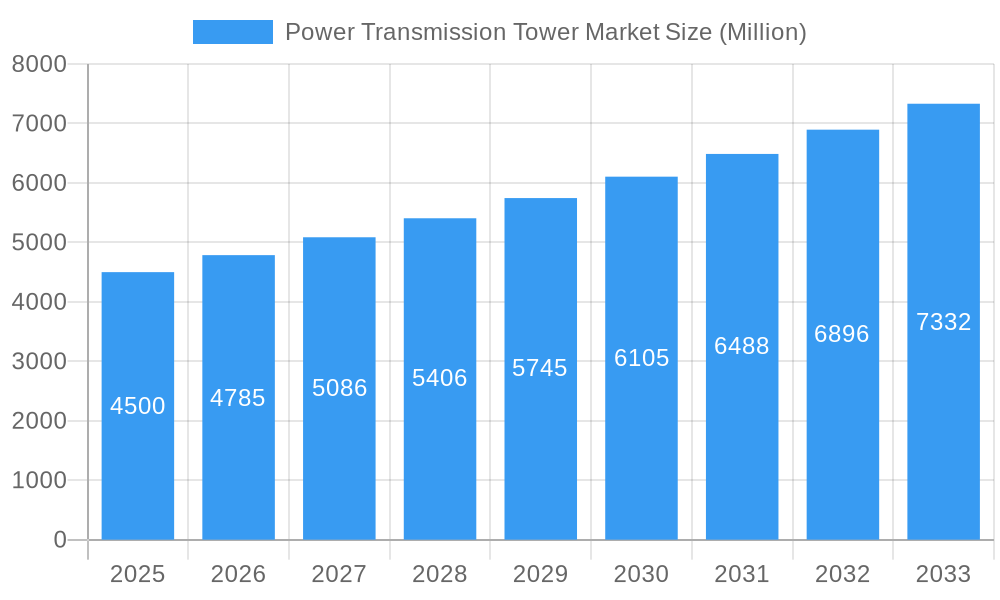
The global Power Transmission Tower Market is poised for significant expansion, projected to reach a market size of approximately $4,500 million by 2025 and exhibiting a robust Compound Annual Growth Rate (CAGR) exceeding 6.00% through 2033. This growth is primarily fueled by the escalating demand for electricity, driven by rapid industrialization, urbanization, and the increasing adoption of renewable energy sources that necessitate expanded and upgraded grid infrastructure. Key drivers include substantial investments in modernizing aging power grids, the development of new transmission lines to connect remote renewable energy projects, and the ongoing need for enhanced grid reliability and efficiency. The market segments are diverse, encompassing various structure types such as Waist Type Towers, Guyed-V-Towers, Tubular Steel Poles, and Guyed Cross-Rope Suspension Towers, catering to different geographical and load-bearing requirements. Additionally, the increasing prevalence of multi-circuit configurations, including double, triple, and quadruple circuits, highlights the trend towards optimizing transmission capacity.
Power Transmission Tower Market Market Size (In Billion)
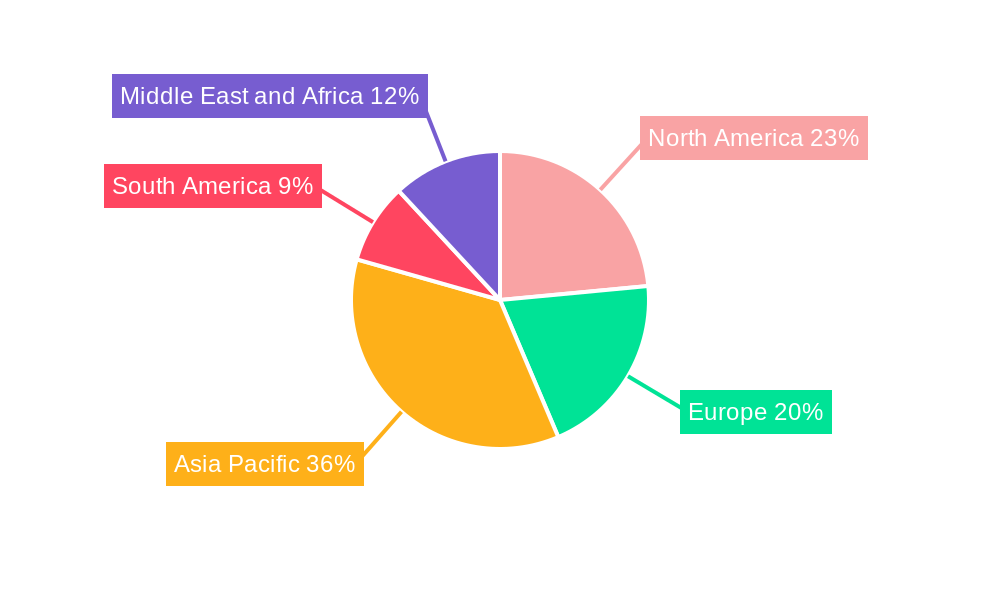
Emerging trends such as the integration of smart grid technologies, the deployment of high-voltage direct current (HVDC) transmission lines, and the growing emphasis on sustainable and eco-friendly tower designs are shaping the market landscape. The industry is witnessing a surge in demand for advanced materials and innovative construction techniques to improve tower durability and reduce environmental impact. While opportunities abound, the market faces certain restraints, including high initial capital expenditure for new transmission projects, complex regulatory frameworks and land acquisition challenges, and potential supply chain disruptions for critical raw materials. Geographically, the Asia Pacific region, particularly China and India, is expected to lead the market due to massive infrastructure development initiatives and a rapidly growing energy demand. North America and Europe also represent significant markets, driven by grid modernization efforts and the transition to cleaner energy. Prominent companies like KEC International Ltd., Nanjing Daji Iron Tower Manufacturing Co. Ltd., and SAE Tower Holdings LLC are at the forefront of innovation and market expansion, competing through technological advancements and strategic partnerships.
Power Transmission Tower Market Company Market Share
This in-depth report provides a definitive analysis of the global Power Transmission Tower Market, offering critical insights into market dynamics, growth trends, regional dominance, product landscape, and key players from 2019 to 2033. With a base year of 2025 and a forecast period extending to 2033, this study meticulously examines the evolution and future trajectory of this vital infrastructure sector. We project significant growth driven by the global push for renewable energy integration, grid modernization, and enhanced transmission capacity. The report details market size in Million units, providing a clear quantitative understanding of the opportunities.
Power Transmission Tower Market Market Dynamics & Structure
The Power Transmission Tower Market exhibits a moderate to high concentration, with leading manufacturers investing heavily in R&D and strategic partnerships to maintain competitive advantage. Technological innovation drivers are primarily focused on developing more robust, cost-effective, and environmentally sustainable tower designs, including advanced materials and modular construction techniques. Regulatory frameworks, particularly those promoting grid reliability, renewable energy mandates, and cybersecurity for critical infrastructure, significantly influence market growth. Competitive product substitutes are limited within the core transmission tower segment, but innovations in underground cabling for certain applications and advanced conductor technologies can indirectly impact demand. End-user demographics are predominantly utility companies, independent power producers (IPPs), and government infrastructure agencies. Mergers and acquisitions (M&A) trends are indicative of consolidation and strategic expansion, with recent deal volumes showing an upward trend as larger players acquire specialized capabilities or expand geographical reach.
- Market Concentration: Dominated by a few key global players, with increasing participation from regional specialists.
- Technological Innovation Drivers: Focus on high-strength steel alloys, pre-fabricated components, corrosion resistance, and smart monitoring integration.
- Regulatory Frameworks: Stringent safety standards, environmental impact assessments, and grid modernization initiatives are key influences.
- Competitive Product Substitutes: Limited direct substitutes, but advancements in energy transmission alternatives may present indirect competition.
- End-User Demographics: Primarily driven by national grid operators, renewable energy project developers, and large industrial consumers.
- M&A Trends: Driven by the need for market consolidation, access to new technologies, and geographic expansion.
Power Transmission Tower Market Growth Trends & Insights
The Power Transmission Tower Market is poised for robust expansion, fueled by escalating global electricity demand, the imperative to integrate intermittent renewable energy sources, and the continuous need for grid modernization and expansion. The market size is projected to evolve from approximately $xx,xxx Million units in 2025 to an estimated $xx,xxx Million units by 2033, reflecting a Compound Annual Growth Rate (CAGR) of approximately xx.x% during the forecast period. Adoption rates of advanced transmission tower designs are accelerating, driven by the demand for higher voltage capacities and enhanced resilience against extreme weather events. Technological disruptions, such as the development of self-healing materials and drone-based inspection and maintenance technologies, are emerging and expected to reshape the industry landscape. Consumer behavior shifts, particularly among utilities and governments, are increasingly prioritizing sustainable and reliable power infrastructure, leading to greater investment in high-performance transmission solutions. Market penetration of specialized towers for renewable energy integration, such as those supporting offshore wind farms, is a key growth area.
- Market Size Evolution: Significant year-over-year growth projected, driven by infrastructure development worldwide.
- Adoption Rates: Increasing adoption of advanced materials and design methodologies for improved efficiency and durability.
- Technological Disruptions: Innovations in smart towers, advanced composite materials, and automation in manufacturing and installation.
- Consumer Behavior Shifts: Growing preference for green energy infrastructure and resilient power grids.
- Market Penetration: Deeper penetration of high-capacity transmission towers for super-grid initiatives and renewable energy integration.
Dominant Regions, Countries, or Segments in Power Transmission Tower Market
North America and Asia Pacific are identified as dominant regions within the Power Transmission Tower Market, with their market share projected to be around xx% and xx% respectively by 2033. This dominance is largely attributed to substantial investments in grid modernization, the rapid expansion of renewable energy portfolios, and the increasing demand for electricity to support growing populations and industrialization. Within the Structure Type segment, Tubular Steel Poles and Waist Type Towers are expected to witness significant growth, driven by their versatility and cost-effectiveness in a wide range of applications, from urban distribution networks to long-distance high-voltage transmission lines. The Number of Circuits segment is increasingly leaning towards Double-Circuit and 3-Circuit configurations to maximize transmission capacity and grid reliability, particularly in densely populated or strategically important corridors. The Angle of Deviation segment, with A-Type and B-Type towers remaining crucial for straight-line transmission, sees increasing demand for C-Type and D-Type towers to accommodate complex terrain and frequent line deviations, essential for expansive infrastructure projects.
- Dominant Regions: North America and Asia Pacific, driven by extensive grid expansion and renewable energy integration projects.
- Key Country Drivers:
- United States: Significant investments in grid modernization and renewable energy infrastructure expansion.
- China: Massive scale of power grid development and upgrades to meet surging energy demands.
- India: Rapid infrastructure development and ambitious renewable energy targets.
- Canada: Extensive transmission projects for hydroelectric and wind power.
- Dominant Structure Types:
- Tubular Steel Poles: Widely adopted for their aesthetic appeal, durability, and ease of installation in urban and suburban areas.
- Waist Type Tower: Essential for high-voltage transmission lines, offering robust support and stability.
- Dominant Number of Circuits:
- Double-Circuit: Favored for enhanced reliability and increased power transfer capacity.
- 3-Circuit: Increasingly deployed in critical transmission corridors to maximize power throughput.
- Dominant Angle of Deviation:
- A-Type & B-Type: For straight-line transmission paths.
- C-Type & D-Type: Crucial for complex terrains and route optimization.
Power Transmission Tower Market Product Landscape
The Power Transmission Tower Market product landscape is characterized by continuous innovation focused on enhancing structural integrity, optimizing material usage, and incorporating smart technologies. Manufacturers are developing advanced tower designs utilizing high-strength steel alloys and composite materials to withstand extreme environmental conditions and reduce foundation requirements. Applications span ultra-high voltage (UHV) transmission lines, renewable energy grid connections, and robust infrastructure for remote and challenging terrains. Performance metrics are increasingly focused on load-bearing capacity, wind resistance, seismic stability, and longevity. Unique selling propositions include modular designs for faster installation, advanced corrosion protection systems, and the integration of sensor technology for real-time structural health monitoring. Technological advancements are geared towards reducing the environmental footprint of tower manufacturing and installation.
Key Drivers, Barriers & Challenges in Power Transmission Tower Market
Key Drivers: The Power Transmission Tower Market is propelled by the global imperative for grid modernization and expansion to meet growing energy demands. The surge in renewable energy integration, requiring extensive transmission infrastructure to connect remote generation sites to consumption centers, is a major catalyst. Government initiatives, such as infrastructure spending bills and clean energy mandates, provide significant impetus. Technological advancements leading to stronger, lighter, and more durable tower designs also contribute to market growth.
- Technological Drivers: Development of high-strength, lightweight materials; advanced corrosion resistance; modular designs.
- Economic Drivers: Increased government spending on infrastructure; growing demand for electricity; renewable energy investment.
- Policy-Driven Factors: Clean energy mandates; grid reliability regulations; smart grid initiatives.
Barriers & Challenges: Significant capital investment required for manufacturing facilities and large-scale projects can act as a barrier. Complex and lengthy permitting processes, especially for transmission lines traversing sensitive environmental areas or private land, pose considerable challenges. Supply chain disruptions for raw materials like steel and specialized components can impact production timelines and costs. Intense competition among established players and emerging manufacturers can lead to price pressures.
- Supply Chain Issues: Volatility in steel prices; availability of specialized components.
- Regulatory Hurdles: Stringent environmental regulations; lengthy land acquisition and permitting processes.
- Competitive Pressures: Intense competition among domestic and international manufacturers.
- Geopolitical Factors: Trade policies and international relations can impact material sourcing and market access.
Emerging Opportunities in Power Transmission Tower Market
Emerging opportunities in the Power Transmission Tower Market lie in the development of towers specifically designed for the integration of distributed energy resources and microgrids. The growing trend towards smart cities and the electrification of transportation necessitate robust and flexible transmission infrastructure. Furthermore, the demand for towers capable of supporting advanced technologies like high-voltage direct current (HVDC) transmission lines for efficient long-distance power transfer presents a significant growth avenue. The replacement and upgrading of aging transmission infrastructure in developed economies also offers a consistent market opportunity.
Growth Accelerators in the Power Transmission Tower Market Industry
Several key growth accelerators are shaping the long-term trajectory of the Power Transmission Tower Market. Technological breakthroughs in materials science, such as the adoption of advanced composites and high-performance alloys, are enabling the construction of taller, stronger, and more resilient towers. Strategic partnerships between tower manufacturers and renewable energy developers are crucial for ensuring timely project execution and optimizing transmission solutions. Market expansion strategies, including the penetration into emerging economies with rapidly developing power grids and the development of specialized tower solutions for offshore wind farms and other offshore renewable energy projects, are vital for sustained growth.
Key Players Shaping the Power Transmission Tower Market Market
- SAE Tower Holdings LLC
- Nanjing Daji Iron Tower Manufacturing Co Ltd
- Skipper Limited
- Evergreen Metals Enterprise Ltd
- Kalpatru Power Transmission Ltd
- AG & SCIMT Co Ltd
- Ramboll Group A/S
- Tata Power Company Limited
- Shah Infra Towers Ltd
- KEC International Ltd
Notable Milestones in Power Transmission Tower Market Sector
- September 2022: UGL Limited completed the construction of three transmission towers for Neoen's Kaban Green Power Hub in Queensland, Australia, connecting it to the main electricity grid and a 257kV switching station.
- November 2021: The United States House of Representatives passed the USD 1.2 trillion Infrastructure Investment and Jobs Act, including significant plans for building new, resilient power transmission lines to support renewable energy expansion.
In-Depth Power Transmission Tower Market Market Outlook
The outlook for the Power Transmission Tower Market remains exceptionally positive, driven by an unwavering global commitment to decarbonization and grid resilience. Growth accelerators, including advancements in smart grid technologies and the increasing adoption of ultra-high voltage (UHV) transmission systems, will continue to fuel demand. Strategic opportunities lie in catering to the evolving needs of the renewable energy sector, particularly offshore wind and large-scale solar projects. The ongoing necessity to upgrade and expand aging electrical grids in developed nations, coupled with the rapid infrastructure development in emerging markets, ensures sustained market expansion. This report provides a comprehensive roadmap to navigate the dynamic landscape of the power transmission tower industry and capitalize on future growth potential.
Power Transmission Tower Market Segmentation
-
1. Structure Type
- 1.1. Waist Type Tower
- 1.2. Guyed-V-Tower
- 1.3. Tubular Steel Pole
- 1.4. Guyed Cross-Rope Suspension Tower
- 1.5. Crossings
-
2. Number of Circuits
- 2.1. Double-Circuit
- 2.2. 3-Circuit
- 2.3. 4-Circuit
-
3. Angle of Deviation
- 3.1. A-Type
- 3.2. B-Type
- 3.3. C-Type
- 3.4. D-Type
Power Transmission Tower Market Segmentation By Geography
-
1. North America
- 1.1. United States
- 1.2. Canada
- 1.3. Rest of North America
-
2. Europe
- 2.1. Germany
- 2.2. Italy
- 2.3. France
- 2.4. United Kingdom
- 2.5. Russian Federation
- 2.6. Rest of Europe
-
3. Asia Pacific
- 3.1. China
- 3.2. India
- 3.3. Japan
- 3.4. South Korea
- 3.5. Rest of Asia Pacific
-
4. South America
- 4.1. Brazil
- 4.2. Argentina
- 4.3. Rest of South America
-
5. Middle East and Africa
- 5.1. Saudi Arabia
- 5.2. United Arab Emirates
- 5.3. South Africa
- 5.4. Rest of Middle East and Africa
Power Transmission Tower Market Regional Market Share
Geographic Coverage of Power Transmission Tower Market
Power Transmission Tower Market REPORT HIGHLIGHTS
| Aspects | Details |
|---|---|
| Study Period | 2020-2034 |
| Base Year | 2025 |
| Estimated Year | 2026 |
| Forecast Period | 2026-2034 |
| Historical Period | 2020-2025 |
| Growth Rate | CAGR of > 6.00% from 2020-2034 |
| Segmentation |
|
Table of Contents
- 1. Introduction
- 1.1. Research Scope
- 1.2. Market Segmentation
- 1.3. Research Objective
- 1.4. Definitions and Assumptions
- 2. Executive Summary
- 2.1. Market Snapshot
- 3. Market Dynamics
- 3.1. Market Drivers
- 3.2. Market Restrains
- 3.3. Market Trends
- 3.4. Market Opportunities
- 4. Market Factor Analysis
- 4.1. Porters Five Forces
- 4.1.1. Bargaining Power of Suppliers
- 4.1.2. Bargaining Power of Buyers
- 4.1.3. Threat of New Entrants
- 4.1.4. Threat of Substitutes
- 4.1.5. Competitive Rivalry
- 4.2. PESTEL analysis
- 4.3. BCG Analysis
- 4.3.1. Stars (High Growth, High Market Share)
- 4.3.2. Cash Cows (Low Growth, High Market Share)
- 4.3.3. Question Mark (High Growth, Low Market Share)
- 4.3.4. Dogs (Low Growth, Low Market Share)
- 4.4. Ansoff Matrix Analysis
- 4.5. Supply Chain Analysis
- 4.6. Regulatory Landscape
- 4.7. Current Market Potential and Opportunity Assessment (TAM–SAM–SOM Framework)
- 4.8. VDR Analyst Note
- 4.1. Porters Five Forces
- 5. Market Analysis, Insights and Forecast 2021-2033
- 5.1. Market Analysis, Insights and Forecast - by Structure Type
- 5.1.1. Waist Type Tower
- 5.1.2. Guyed-V-Tower
- 5.1.3. Tubular Steel Pole
- 5.1.4. Guyed Cross-Rope Suspension Tower
- 5.1.5. Crossings
- 5.2. Market Analysis, Insights and Forecast - by Number of Circuits
- 5.2.1. Double-Circuit
- 5.2.2. 3-Circuit
- 5.2.3. 4-Circuit
- 5.3. Market Analysis, Insights and Forecast - by Angle of Deviation
- 5.3.1. A-Type
- 5.3.2. B-Type
- 5.3.3. C-Type
- 5.3.4. D-Type
- 5.4. Market Analysis, Insights and Forecast - by Region
- 5.4.1. North America
- 5.4.2. Europe
- 5.4.3. Asia Pacific
- 5.4.4. South America
- 5.4.5. Middle East and Africa
- 5.1. Market Analysis, Insights and Forecast - by Structure Type
- 6. Global Power Transmission Tower Market Analysis, Insights and Forecast, 2021-2033
- 6.1. Market Analysis, Insights and Forecast - by Structure Type
- 6.1.1. Waist Type Tower
- 6.1.2. Guyed-V-Tower
- 6.1.3. Tubular Steel Pole
- 6.1.4. Guyed Cross-Rope Suspension Tower
- 6.1.5. Crossings
- 6.2. Market Analysis, Insights and Forecast - by Number of Circuits
- 6.2.1. Double-Circuit
- 6.2.2. 3-Circuit
- 6.2.3. 4-Circuit
- 6.3. Market Analysis, Insights and Forecast - by Angle of Deviation
- 6.3.1. A-Type
- 6.3.2. B-Type
- 6.3.3. C-Type
- 6.3.4. D-Type
- 6.1. Market Analysis, Insights and Forecast - by Structure Type
- 7. North America Power Transmission Tower Market Analysis, Insights and Forecast, 2021-2033
- 7.1. Market Analysis, Insights and Forecast - by Structure Type
- 7.1.1. Waist Type Tower
- 7.1.2. Guyed-V-Tower
- 7.1.3. Tubular Steel Pole
- 7.1.4. Guyed Cross-Rope Suspension Tower
- 7.1.5. Crossings
- 7.2. Market Analysis, Insights and Forecast - by Number of Circuits
- 7.2.1. Double-Circuit
- 7.2.2. 3-Circuit
- 7.2.3. 4-Circuit
- 7.3. Market Analysis, Insights and Forecast - by Angle of Deviation
- 7.3.1. A-Type
- 7.3.2. B-Type
- 7.3.3. C-Type
- 7.3.4. D-Type
- 7.1. Market Analysis, Insights and Forecast - by Structure Type
- 8. Europe Power Transmission Tower Market Analysis, Insights and Forecast, 2021-2033
- 8.1. Market Analysis, Insights and Forecast - by Structure Type
- 8.1.1. Waist Type Tower
- 8.1.2. Guyed-V-Tower
- 8.1.3. Tubular Steel Pole
- 8.1.4. Guyed Cross-Rope Suspension Tower
- 8.1.5. Crossings
- 8.2. Market Analysis, Insights and Forecast - by Number of Circuits
- 8.2.1. Double-Circuit
- 8.2.2. 3-Circuit
- 8.2.3. 4-Circuit
- 8.3. Market Analysis, Insights and Forecast - by Angle of Deviation
- 8.3.1. A-Type
- 8.3.2. B-Type
- 8.3.3. C-Type
- 8.3.4. D-Type
- 8.1. Market Analysis, Insights and Forecast - by Structure Type
- 9. Asia Pacific Power Transmission Tower Market Analysis, Insights and Forecast, 2021-2033
- 9.1. Market Analysis, Insights and Forecast - by Structure Type
- 9.1.1. Waist Type Tower
- 9.1.2. Guyed-V-Tower
- 9.1.3. Tubular Steel Pole
- 9.1.4. Guyed Cross-Rope Suspension Tower
- 9.1.5. Crossings
- 9.2. Market Analysis, Insights and Forecast - by Number of Circuits
- 9.2.1. Double-Circuit
- 9.2.2. 3-Circuit
- 9.2.3. 4-Circuit
- 9.3. Market Analysis, Insights and Forecast - by Angle of Deviation
- 9.3.1. A-Type
- 9.3.2. B-Type
- 9.3.3. C-Type
- 9.3.4. D-Type
- 9.1. Market Analysis, Insights and Forecast - by Structure Type
- 10. South America Power Transmission Tower Market Analysis, Insights and Forecast, 2021-2033
- 10.1. Market Analysis, Insights and Forecast - by Structure Type
- 10.1.1. Waist Type Tower
- 10.1.2. Guyed-V-Tower
- 10.1.3. Tubular Steel Pole
- 10.1.4. Guyed Cross-Rope Suspension Tower
- 10.1.5. Crossings
- 10.2. Market Analysis, Insights and Forecast - by Number of Circuits
- 10.2.1. Double-Circuit
- 10.2.2. 3-Circuit
- 10.2.3. 4-Circuit
- 10.3. Market Analysis, Insights and Forecast - by Angle of Deviation
- 10.3.1. A-Type
- 10.3.2. B-Type
- 10.3.3. C-Type
- 10.3.4. D-Type
- 10.1. Market Analysis, Insights and Forecast - by Structure Type
- 11. Middle East and Africa Power Transmission Tower Market Analysis, Insights and Forecast, 2021-2033
- 11.1. Market Analysis, Insights and Forecast - by Structure Type
- 11.1.1. Waist Type Tower
- 11.1.2. Guyed-V-Tower
- 11.1.3. Tubular Steel Pole
- 11.1.4. Guyed Cross-Rope Suspension Tower
- 11.1.5. Crossings
- 11.2. Market Analysis, Insights and Forecast - by Number of Circuits
- 11.2.1. Double-Circuit
- 11.2.2. 3-Circuit
- 11.2.3. 4-Circuit
- 11.3. Market Analysis, Insights and Forecast - by Angle of Deviation
- 11.3.1. A-Type
- 11.3.2. B-Type
- 11.3.3. C-Type
- 11.3.4. D-Type
- 11.1. Market Analysis, Insights and Forecast - by Structure Type
- 12. Competitive Analysis
- 12.1. Company Profiles
- 12.1.1 SAE Tower Holdings LLC
- 12.1.1.1. Company Overview
- 12.1.1.2. Products
- 12.1.1.3. Company Financials
- 12.1.1.4. SWOT Analysis
- 12.1.2 Nanjing Daji Iron Tower Manufacturing Co Ltd
- 12.1.2.1. Company Overview
- 12.1.2.2. Products
- 12.1.2.3. Company Financials
- 12.1.2.4. SWOT Analysis
- 12.1.3 Skipper Limited
- 12.1.3.1. Company Overview
- 12.1.3.2. Products
- 12.1.3.3. Company Financials
- 12.1.3.4. SWOT Analysis
- 12.1.4 Evergreen Metals Enterprise Ltd *List Not Exhaustive
- 12.1.4.1. Company Overview
- 12.1.4.2. Products
- 12.1.4.3. Company Financials
- 12.1.4.4. SWOT Analysis
- 12.1.5 Kalpatru Power Transmission Ltd
- 12.1.5.1. Company Overview
- 12.1.5.2. Products
- 12.1.5.3. Company Financials
- 12.1.5.4. SWOT Analysis
- 12.1.6 AG & SCIMT Co Ltd
- 12.1.6.1. Company Overview
- 12.1.6.2. Products
- 12.1.6.3. Company Financials
- 12.1.6.4. SWOT Analysis
- 12.1.7 Ramboll Group A/S
- 12.1.7.1. Company Overview
- 12.1.7.2. Products
- 12.1.7.3. Company Financials
- 12.1.7.4. SWOT Analysis
- 12.1.8 Tata Power Company Limited
- 12.1.8.1. Company Overview
- 12.1.8.2. Products
- 12.1.8.3. Company Financials
- 12.1.8.4. SWOT Analysis
- 12.1.9 Shah Infra Towers Ltd
- 12.1.9.1. Company Overview
- 12.1.9.2. Products
- 12.1.9.3. Company Financials
- 12.1.9.4. SWOT Analysis
- 12.1.10 KEC International Ltd
- 12.1.10.1. Company Overview
- 12.1.10.2. Products
- 12.1.10.3. Company Financials
- 12.1.10.4. SWOT Analysis
- 12.1.1 SAE Tower Holdings LLC
- 12.2. Market Entropy
- 12.2.1 Company's Key Areas Served
- 12.2.2 Recent Developments
- 12.3. Company Market Share Analysis 2025
- 12.3.1 Top 5 Companies Market Share Analysis
- 12.3.2 Top 3 Companies Market Share Analysis
- 12.4. List of Potential Customers
- 13. Research Methodology
List of Figures
- Figure 1: Global Power Transmission Tower Market Revenue Breakdown (Million, %) by Region 2025 & 2033
- Figure 2: Global Power Transmission Tower Market Volume Breakdown (K Units, %) by Region 2025 & 2033
- Figure 3: North America Power Transmission Tower Market Revenue (Million), by Structure Type 2025 & 2033
- Figure 4: North America Power Transmission Tower Market Volume (K Units), by Structure Type 2025 & 2033
- Figure 5: North America Power Transmission Tower Market Revenue Share (%), by Structure Type 2025 & 2033
- Figure 6: North America Power Transmission Tower Market Volume Share (%), by Structure Type 2025 & 2033
- Figure 7: North America Power Transmission Tower Market Revenue (Million), by Number of Circuits 2025 & 2033
- Figure 8: North America Power Transmission Tower Market Volume (K Units), by Number of Circuits 2025 & 2033
- Figure 9: North America Power Transmission Tower Market Revenue Share (%), by Number of Circuits 2025 & 2033
- Figure 10: North America Power Transmission Tower Market Volume Share (%), by Number of Circuits 2025 & 2033
- Figure 11: North America Power Transmission Tower Market Revenue (Million), by Angle of Deviation 2025 & 2033
- Figure 12: North America Power Transmission Tower Market Volume (K Units), by Angle of Deviation 2025 & 2033
- Figure 13: North America Power Transmission Tower Market Revenue Share (%), by Angle of Deviation 2025 & 2033
- Figure 14: North America Power Transmission Tower Market Volume Share (%), by Angle of Deviation 2025 & 2033
- Figure 15: North America Power Transmission Tower Market Revenue (Million), by Country 2025 & 2033
- Figure 16: North America Power Transmission Tower Market Volume (K Units), by Country 2025 & 2033
- Figure 17: North America Power Transmission Tower Market Revenue Share (%), by Country 2025 & 2033
- Figure 18: North America Power Transmission Tower Market Volume Share (%), by Country 2025 & 2033
- Figure 19: Europe Power Transmission Tower Market Revenue (Million), by Structure Type 2025 & 2033
- Figure 20: Europe Power Transmission Tower Market Volume (K Units), by Structure Type 2025 & 2033
- Figure 21: Europe Power Transmission Tower Market Revenue Share (%), by Structure Type 2025 & 2033
- Figure 22: Europe Power Transmission Tower Market Volume Share (%), by Structure Type 2025 & 2033
- Figure 23: Europe Power Transmission Tower Market Revenue (Million), by Number of Circuits 2025 & 2033
- Figure 24: Europe Power Transmission Tower Market Volume (K Units), by Number of Circuits 2025 & 2033
- Figure 25: Europe Power Transmission Tower Market Revenue Share (%), by Number of Circuits 2025 & 2033
- Figure 26: Europe Power Transmission Tower Market Volume Share (%), by Number of Circuits 2025 & 2033
- Figure 27: Europe Power Transmission Tower Market Revenue (Million), by Angle of Deviation 2025 & 2033
- Figure 28: Europe Power Transmission Tower Market Volume (K Units), by Angle of Deviation 2025 & 2033
- Figure 29: Europe Power Transmission Tower Market Revenue Share (%), by Angle of Deviation 2025 & 2033
- Figure 30: Europe Power Transmission Tower Market Volume Share (%), by Angle of Deviation 2025 & 2033
- Figure 31: Europe Power Transmission Tower Market Revenue (Million), by Country 2025 & 2033
- Figure 32: Europe Power Transmission Tower Market Volume (K Units), by Country 2025 & 2033
- Figure 33: Europe Power Transmission Tower Market Revenue Share (%), by Country 2025 & 2033
- Figure 34: Europe Power Transmission Tower Market Volume Share (%), by Country 2025 & 2033
- Figure 35: Asia Pacific Power Transmission Tower Market Revenue (Million), by Structure Type 2025 & 2033
- Figure 36: Asia Pacific Power Transmission Tower Market Volume (K Units), by Structure Type 2025 & 2033
- Figure 37: Asia Pacific Power Transmission Tower Market Revenue Share (%), by Structure Type 2025 & 2033
- Figure 38: Asia Pacific Power Transmission Tower Market Volume Share (%), by Structure Type 2025 & 2033
- Figure 39: Asia Pacific Power Transmission Tower Market Revenue (Million), by Number of Circuits 2025 & 2033
- Figure 40: Asia Pacific Power Transmission Tower Market Volume (K Units), by Number of Circuits 2025 & 2033
- Figure 41: Asia Pacific Power Transmission Tower Market Revenue Share (%), by Number of Circuits 2025 & 2033
- Figure 42: Asia Pacific Power Transmission Tower Market Volume Share (%), by Number of Circuits 2025 & 2033
- Figure 43: Asia Pacific Power Transmission Tower Market Revenue (Million), by Angle of Deviation 2025 & 2033
- Figure 44: Asia Pacific Power Transmission Tower Market Volume (K Units), by Angle of Deviation 2025 & 2033
- Figure 45: Asia Pacific Power Transmission Tower Market Revenue Share (%), by Angle of Deviation 2025 & 2033
- Figure 46: Asia Pacific Power Transmission Tower Market Volume Share (%), by Angle of Deviation 2025 & 2033
- Figure 47: Asia Pacific Power Transmission Tower Market Revenue (Million), by Country 2025 & 2033
- Figure 48: Asia Pacific Power Transmission Tower Market Volume (K Units), by Country 2025 & 2033
- Figure 49: Asia Pacific Power Transmission Tower Market Revenue Share (%), by Country 2025 & 2033
- Figure 50: Asia Pacific Power Transmission Tower Market Volume Share (%), by Country 2025 & 2033
- Figure 51: South America Power Transmission Tower Market Revenue (Million), by Structure Type 2025 & 2033
- Figure 52: South America Power Transmission Tower Market Volume (K Units), by Structure Type 2025 & 2033
- Figure 53: South America Power Transmission Tower Market Revenue Share (%), by Structure Type 2025 & 2033
- Figure 54: South America Power Transmission Tower Market Volume Share (%), by Structure Type 2025 & 2033
- Figure 55: South America Power Transmission Tower Market Revenue (Million), by Number of Circuits 2025 & 2033
- Figure 56: South America Power Transmission Tower Market Volume (K Units), by Number of Circuits 2025 & 2033
- Figure 57: South America Power Transmission Tower Market Revenue Share (%), by Number of Circuits 2025 & 2033
- Figure 58: South America Power Transmission Tower Market Volume Share (%), by Number of Circuits 2025 & 2033
- Figure 59: South America Power Transmission Tower Market Revenue (Million), by Angle of Deviation 2025 & 2033
- Figure 60: South America Power Transmission Tower Market Volume (K Units), by Angle of Deviation 2025 & 2033
- Figure 61: South America Power Transmission Tower Market Revenue Share (%), by Angle of Deviation 2025 & 2033
- Figure 62: South America Power Transmission Tower Market Volume Share (%), by Angle of Deviation 2025 & 2033
- Figure 63: South America Power Transmission Tower Market Revenue (Million), by Country 2025 & 2033
- Figure 64: South America Power Transmission Tower Market Volume (K Units), by Country 2025 & 2033
- Figure 65: South America Power Transmission Tower Market Revenue Share (%), by Country 2025 & 2033
- Figure 66: South America Power Transmission Tower Market Volume Share (%), by Country 2025 & 2033
- Figure 67: Middle East and Africa Power Transmission Tower Market Revenue (Million), by Structure Type 2025 & 2033
- Figure 68: Middle East and Africa Power Transmission Tower Market Volume (K Units), by Structure Type 2025 & 2033
- Figure 69: Middle East and Africa Power Transmission Tower Market Revenue Share (%), by Structure Type 2025 & 2033
- Figure 70: Middle East and Africa Power Transmission Tower Market Volume Share (%), by Structure Type 2025 & 2033
- Figure 71: Middle East and Africa Power Transmission Tower Market Revenue (Million), by Number of Circuits 2025 & 2033
- Figure 72: Middle East and Africa Power Transmission Tower Market Volume (K Units), by Number of Circuits 2025 & 2033
- Figure 73: Middle East and Africa Power Transmission Tower Market Revenue Share (%), by Number of Circuits 2025 & 2033
- Figure 74: Middle East and Africa Power Transmission Tower Market Volume Share (%), by Number of Circuits 2025 & 2033
- Figure 75: Middle East and Africa Power Transmission Tower Market Revenue (Million), by Angle of Deviation 2025 & 2033
- Figure 76: Middle East and Africa Power Transmission Tower Market Volume (K Units), by Angle of Deviation 2025 & 2033
- Figure 77: Middle East and Africa Power Transmission Tower Market Revenue Share (%), by Angle of Deviation 2025 & 2033
- Figure 78: Middle East and Africa Power Transmission Tower Market Volume Share (%), by Angle of Deviation 2025 & 2033
- Figure 79: Middle East and Africa Power Transmission Tower Market Revenue (Million), by Country 2025 & 2033
- Figure 80: Middle East and Africa Power Transmission Tower Market Volume (K Units), by Country 2025 & 2033
- Figure 81: Middle East and Africa Power Transmission Tower Market Revenue Share (%), by Country 2025 & 2033
- Figure 82: Middle East and Africa Power Transmission Tower Market Volume Share (%), by Country 2025 & 2033
List of Tables
- Table 1: Global Power Transmission Tower Market Revenue Million Forecast, by Structure Type 2020 & 2033
- Table 2: Global Power Transmission Tower Market Volume K Units Forecast, by Structure Type 2020 & 2033
- Table 3: Global Power Transmission Tower Market Revenue Million Forecast, by Number of Circuits 2020 & 2033
- Table 4: Global Power Transmission Tower Market Volume K Units Forecast, by Number of Circuits 2020 & 2033
- Table 5: Global Power Transmission Tower Market Revenue Million Forecast, by Angle of Deviation 2020 & 2033
- Table 6: Global Power Transmission Tower Market Volume K Units Forecast, by Angle of Deviation 2020 & 2033
- Table 7: Global Power Transmission Tower Market Revenue Million Forecast, by Region 2020 & 2033
- Table 8: Global Power Transmission Tower Market Volume K Units Forecast, by Region 2020 & 2033
- Table 9: Global Power Transmission Tower Market Revenue Million Forecast, by Structure Type 2020 & 2033
- Table 10: Global Power Transmission Tower Market Volume K Units Forecast, by Structure Type 2020 & 2033
- Table 11: Global Power Transmission Tower Market Revenue Million Forecast, by Number of Circuits 2020 & 2033
- Table 12: Global Power Transmission Tower Market Volume K Units Forecast, by Number of Circuits 2020 & 2033
- Table 13: Global Power Transmission Tower Market Revenue Million Forecast, by Angle of Deviation 2020 & 2033
- Table 14: Global Power Transmission Tower Market Volume K Units Forecast, by Angle of Deviation 2020 & 2033
- Table 15: Global Power Transmission Tower Market Revenue Million Forecast, by Country 2020 & 2033
- Table 16: Global Power Transmission Tower Market Volume K Units Forecast, by Country 2020 & 2033
- Table 17: United States Power Transmission Tower Market Revenue (Million) Forecast, by Application 2020 & 2033
- Table 18: United States Power Transmission Tower Market Volume (K Units) Forecast, by Application 2020 & 2033
- Table 19: Canada Power Transmission Tower Market Revenue (Million) Forecast, by Application 2020 & 2033
- Table 20: Canada Power Transmission Tower Market Volume (K Units) Forecast, by Application 2020 & 2033
- Table 21: Rest of North America Power Transmission Tower Market Revenue (Million) Forecast, by Application 2020 & 2033
- Table 22: Rest of North America Power Transmission Tower Market Volume (K Units) Forecast, by Application 2020 & 2033
- Table 23: Global Power Transmission Tower Market Revenue Million Forecast, by Structure Type 2020 & 2033
- Table 24: Global Power Transmission Tower Market Volume K Units Forecast, by Structure Type 2020 & 2033
- Table 25: Global Power Transmission Tower Market Revenue Million Forecast, by Number of Circuits 2020 & 2033
- Table 26: Global Power Transmission Tower Market Volume K Units Forecast, by Number of Circuits 2020 & 2033
- Table 27: Global Power Transmission Tower Market Revenue Million Forecast, by Angle of Deviation 2020 & 2033
- Table 28: Global Power Transmission Tower Market Volume K Units Forecast, by Angle of Deviation 2020 & 2033
- Table 29: Global Power Transmission Tower Market Revenue Million Forecast, by Country 2020 & 2033
- Table 30: Global Power Transmission Tower Market Volume K Units Forecast, by Country 2020 & 2033
- Table 31: Germany Power Transmission Tower Market Revenue (Million) Forecast, by Application 2020 & 2033
- Table 32: Germany Power Transmission Tower Market Volume (K Units) Forecast, by Application 2020 & 2033
- Table 33: Italy Power Transmission Tower Market Revenue (Million) Forecast, by Application 2020 & 2033
- Table 34: Italy Power Transmission Tower Market Volume (K Units) Forecast, by Application 2020 & 2033
- Table 35: France Power Transmission Tower Market Revenue (Million) Forecast, by Application 2020 & 2033
- Table 36: France Power Transmission Tower Market Volume (K Units) Forecast, by Application 2020 & 2033
- Table 37: United Kingdom Power Transmission Tower Market Revenue (Million) Forecast, by Application 2020 & 2033
- Table 38: United Kingdom Power Transmission Tower Market Volume (K Units) Forecast, by Application 2020 & 2033
- Table 39: Russian Federation Power Transmission Tower Market Revenue (Million) Forecast, by Application 2020 & 2033
- Table 40: Russian Federation Power Transmission Tower Market Volume (K Units) Forecast, by Application 2020 & 2033
- Table 41: Rest of Europe Power Transmission Tower Market Revenue (Million) Forecast, by Application 2020 & 2033
- Table 42: Rest of Europe Power Transmission Tower Market Volume (K Units) Forecast, by Application 2020 & 2033
- Table 43: Global Power Transmission Tower Market Revenue Million Forecast, by Structure Type 2020 & 2033
- Table 44: Global Power Transmission Tower Market Volume K Units Forecast, by Structure Type 2020 & 2033
- Table 45: Global Power Transmission Tower Market Revenue Million Forecast, by Number of Circuits 2020 & 2033
- Table 46: Global Power Transmission Tower Market Volume K Units Forecast, by Number of Circuits 2020 & 2033
- Table 47: Global Power Transmission Tower Market Revenue Million Forecast, by Angle of Deviation 2020 & 2033
- Table 48: Global Power Transmission Tower Market Volume K Units Forecast, by Angle of Deviation 2020 & 2033
- Table 49: Global Power Transmission Tower Market Revenue Million Forecast, by Country 2020 & 2033
- Table 50: Global Power Transmission Tower Market Volume K Units Forecast, by Country 2020 & 2033
- Table 51: China Power Transmission Tower Market Revenue (Million) Forecast, by Application 2020 & 2033
- Table 52: China Power Transmission Tower Market Volume (K Units) Forecast, by Application 2020 & 2033
- Table 53: India Power Transmission Tower Market Revenue (Million) Forecast, by Application 2020 & 2033
- Table 54: India Power Transmission Tower Market Volume (K Units) Forecast, by Application 2020 & 2033
- Table 55: Japan Power Transmission Tower Market Revenue (Million) Forecast, by Application 2020 & 2033
- Table 56: Japan Power Transmission Tower Market Volume (K Units) Forecast, by Application 2020 & 2033
- Table 57: South Korea Power Transmission Tower Market Revenue (Million) Forecast, by Application 2020 & 2033
- Table 58: South Korea Power Transmission Tower Market Volume (K Units) Forecast, by Application 2020 & 2033
- Table 59: Rest of Asia Pacific Power Transmission Tower Market Revenue (Million) Forecast, by Application 2020 & 2033
- Table 60: Rest of Asia Pacific Power Transmission Tower Market Volume (K Units) Forecast, by Application 2020 & 2033
- Table 61: Global Power Transmission Tower Market Revenue Million Forecast, by Structure Type 2020 & 2033
- Table 62: Global Power Transmission Tower Market Volume K Units Forecast, by Structure Type 2020 & 2033
- Table 63: Global Power Transmission Tower Market Revenue Million Forecast, by Number of Circuits 2020 & 2033
- Table 64: Global Power Transmission Tower Market Volume K Units Forecast, by Number of Circuits 2020 & 2033
- Table 65: Global Power Transmission Tower Market Revenue Million Forecast, by Angle of Deviation 2020 & 2033
- Table 66: Global Power Transmission Tower Market Volume K Units Forecast, by Angle of Deviation 2020 & 2033
- Table 67: Global Power Transmission Tower Market Revenue Million Forecast, by Country 2020 & 2033
- Table 68: Global Power Transmission Tower Market Volume K Units Forecast, by Country 2020 & 2033
- Table 69: Brazil Power Transmission Tower Market Revenue (Million) Forecast, by Application 2020 & 2033
- Table 70: Brazil Power Transmission Tower Market Volume (K Units) Forecast, by Application 2020 & 2033
- Table 71: Argentina Power Transmission Tower Market Revenue (Million) Forecast, by Application 2020 & 2033
- Table 72: Argentina Power Transmission Tower Market Volume (K Units) Forecast, by Application 2020 & 2033
- Table 73: Rest of South America Power Transmission Tower Market Revenue (Million) Forecast, by Application 2020 & 2033
- Table 74: Rest of South America Power Transmission Tower Market Volume (K Units) Forecast, by Application 2020 & 2033
- Table 75: Global Power Transmission Tower Market Revenue Million Forecast, by Structure Type 2020 & 2033
- Table 76: Global Power Transmission Tower Market Volume K Units Forecast, by Structure Type 2020 & 2033
- Table 77: Global Power Transmission Tower Market Revenue Million Forecast, by Number of Circuits 2020 & 2033
- Table 78: Global Power Transmission Tower Market Volume K Units Forecast, by Number of Circuits 2020 & 2033
- Table 79: Global Power Transmission Tower Market Revenue Million Forecast, by Angle of Deviation 2020 & 2033
- Table 80: Global Power Transmission Tower Market Volume K Units Forecast, by Angle of Deviation 2020 & 2033
- Table 81: Global Power Transmission Tower Market Revenue Million Forecast, by Country 2020 & 2033
- Table 82: Global Power Transmission Tower Market Volume K Units Forecast, by Country 2020 & 2033
- Table 83: Saudi Arabia Power Transmission Tower Market Revenue (Million) Forecast, by Application 2020 & 2033
- Table 84: Saudi Arabia Power Transmission Tower Market Volume (K Units) Forecast, by Application 2020 & 2033
- Table 85: United Arab Emirates Power Transmission Tower Market Revenue (Million) Forecast, by Application 2020 & 2033
- Table 86: United Arab Emirates Power Transmission Tower Market Volume (K Units) Forecast, by Application 2020 & 2033
- Table 87: South Africa Power Transmission Tower Market Revenue (Million) Forecast, by Application 2020 & 2033
- Table 88: South Africa Power Transmission Tower Market Volume (K Units) Forecast, by Application 2020 & 2033
- Table 89: Rest of Middle East and Africa Power Transmission Tower Market Revenue (Million) Forecast, by Application 2020 & 2033
- Table 90: Rest of Middle East and Africa Power Transmission Tower Market Volume (K Units) Forecast, by Application 2020 & 2033
Frequently Asked Questions
1. What is the projected Compound Annual Growth Rate (CAGR) of the Power Transmission Tower Market?
The projected CAGR is approximately > 6.00%.
2. Which companies are prominent players in the Power Transmission Tower Market?
Key companies in the market include SAE Tower Holdings LLC, Nanjing Daji Iron Tower Manufacturing Co Ltd, Skipper Limited, Evergreen Metals Enterprise Ltd *List Not Exhaustive, Kalpatru Power Transmission Ltd, AG & SCIMT Co Ltd, Ramboll Group A/S, Tata Power Company Limited, Shah Infra Towers Ltd, KEC International Ltd.
3. What are the main segments of the Power Transmission Tower Market?
The market segments include Structure Type, Number of Circuits, Angle of Deviation.
4. Can you provide details about the market size?
The market size is estimated to be USD XX Million as of 2022.
5. What are some drivers contributing to market growth?
4.; Demand for Cleaner Energy4.; Supportive Government Policies.
6. What are the notable trends driving market growth?
Double-Circuit Expected to Witness Significant Growth.
7. Are there any restraints impacting market growth?
4.; Underdeveloped Power Grid.
8. Can you provide examples of recent developments in the market?
In September 2022, UGL Limited completed the construction of three transmission towers which were a part of the project to connect Neoen's Kaban Green Power Hub to the main electricity grid in Queensland, Australia. The company had been working to construct a 257kV switching station that connects the Hub to Powerlink Queensland's network.
9. What pricing options are available for accessing the report?
Pricing options include single-user, multi-user, and enterprise licenses priced at USD 4750, USD 5250, and USD 8750 respectively.
10. Is the market size provided in terms of value or volume?
The market size is provided in terms of value, measured in Million and volume, measured in K Units.
11. Are there any specific market keywords associated with the report?
Yes, the market keyword associated with the report is "Power Transmission Tower Market," which aids in identifying and referencing the specific market segment covered.
12. How do I determine which pricing option suits my needs best?
The pricing options vary based on user requirements and access needs. Individual users may opt for single-user licenses, while businesses requiring broader access may choose multi-user or enterprise licenses for cost-effective access to the report.
13. Are there any additional resources or data provided in the Power Transmission Tower Market report?
While the report offers comprehensive insights, it's advisable to review the specific contents or supplementary materials provided to ascertain if additional resources or data are available.
14. How can I stay updated on further developments or reports in the Power Transmission Tower Market?
To stay informed about further developments, trends, and reports in the Power Transmission Tower Market, consider subscribing to industry newsletters, following relevant companies and organizations, or regularly checking reputable industry news sources and publications.
Methodology
Step 1 - Identification of Relevant Samples Size from Population Database


Step 2 - Approaches for Defining Global Market Size (Value, Volume* & Price*)

Note*: In applicable scenarios
Step 3 - Data Sources
Primary Research
- Web Analytics
- Survey Reports
- Research Institute
- Latest Research Reports
- Opinion Leaders
Secondary Research
- Annual Reports
- White Paper
- Latest Press Release
- Industry Association
- Paid Database
- Investor Presentations

Step 4 - Data Triangulation
Involves using different sources of information in order to increase the validity of a study
These sources are likely to be stakeholders in a program - participants, other researchers, program staff, other community members, and so on.
Then we put all data in single framework & apply various statistical tools to find out the dynamic on the market.
During the analysis stage, feedback from the stakeholder groups would be compared to determine areas of agreement as well as areas of divergence