

Key Insights
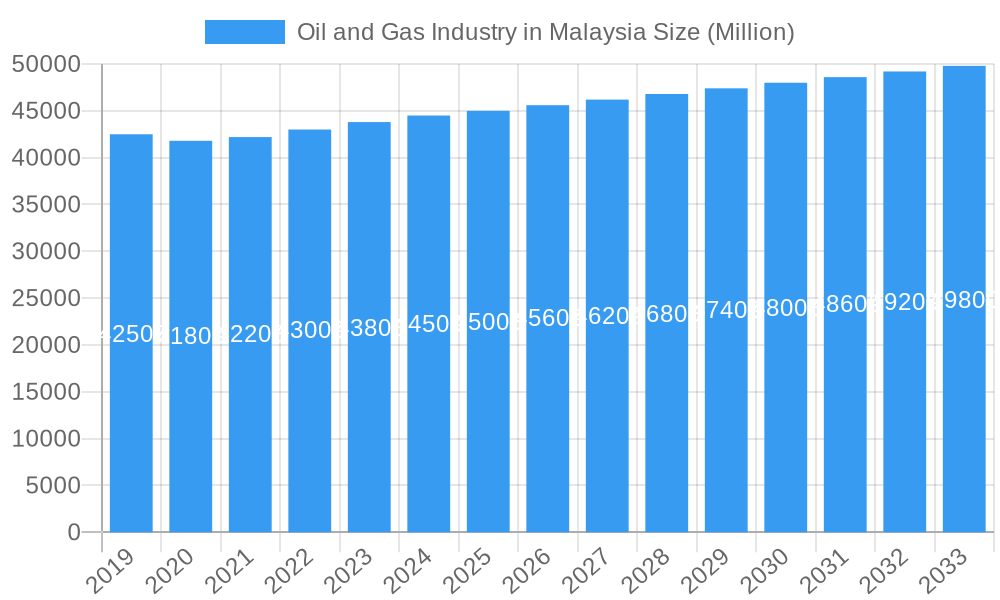
Malaysia's Oil and Gas Industry is projected for robust expansion, with an estimated market size of $11.44 billion in 2024. This growth is driven by a Compound Annual Growth Rate (CAGR) of 3.8% throughout the forecast period. Key catalysts include advanced downstream processing, sustained demand for refined products and petrochemicals, and substantial investments in LNG infrastructure. Malaysia's strategic Asia Pacific location enhances its trade and consumption hub status. Ongoing efforts in energy efficiency, deepwater exploration, and digital technology integration support market resilience and operational optimization, alongside a measured transition towards cleaner energy.
Oil and Gas Industry in Malaysia Market Size (In Billion)
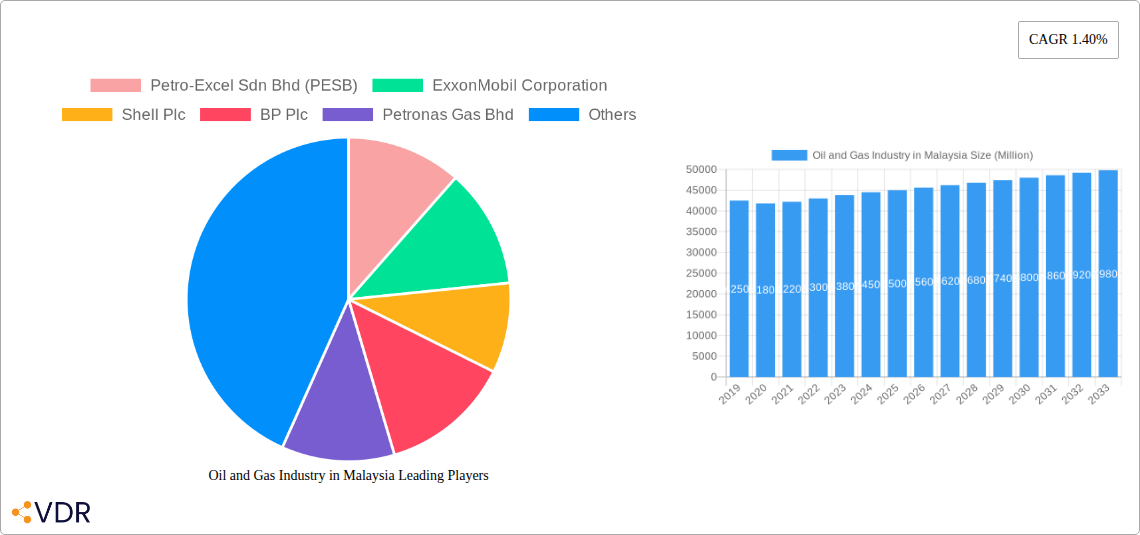
The industry features a competitive landscape with major players like ExxonMobil, Shell, and Petronas Gas Bhd. The upstream segment, while facing challenges with mature fields, is offset by advanced technology investments. The midstream sector leverages existing infrastructure and strategic ports. The downstream segment remains vital, meeting domestic and international demand for refined products and petrochemicals. While global price volatility, environmental regulations, and the renewable energy shift present considerations, Malaysia's commitment to energy security and technological innovation ensures continued, moderate growth.
Oil and Gas Industry in Malaysia Company Market Share
Gain critical insights into Malaysia's oil and gas sector with this comprehensive report. Covering 2019-2033, with a base year of 2024 and a forecast period of 2024–2033, this analysis explores upstream, midstream, and downstream segments. Understand market size evolution, technological advancements, and key stakeholders. This report is essential for industry professionals, investors, and policymakers navigating the evolving Malaysian energy landscape.
Oil and Gas Industry in Malaysia Market Dynamics & Structure
The Malaysian oil and gas industry is characterized by a moderate to high market concentration, predominantly influenced by the national oil company, Petronas, and major international players. Technological innovation is a key driver, particularly in areas like Enhanced Oil Recovery (EOR) and digital oilfield solutions aimed at optimizing production from mature fields. Regulatory frameworks, primarily governed by Petronas' Production Sharing Contracts (PSCs) and national energy policies, shape investment and operational landscapes. Competitive product substitutes are emerging, especially in the power generation sector, with a growing emphasis on renewables, though oil and gas remain crucial for economic development. End-user demographics are shifting, with increasing demand for cleaner fuels and energy efficiency. Mergers and acquisitions (M&A) trends are moderate, often driven by consolidation and portfolio optimization among established entities.
- Market Concentration: Dominated by Petronas and major IOCs, with a growing presence of independent players.
- Technological Innovation: Focus on EOR, digitalization, and carbon capture technologies.
- Regulatory Frameworks: Governed by PSCs, national energy policies, and environmental regulations.
- Product Substitutes: Growing adoption of renewable energy sources impacting long-term demand.
- End-User Demographics: Increasing demand for LNG, petrochemicals, and lower-carbon energy solutions.
- M&A Trends: Strategic partnerships and divestments for portfolio enhancement.
Oil and Gas Industry in Malaysia Growth Trends & Insights
The Malaysian oil and gas industry is projected to experience steady growth driven by consistent demand for energy and petrochemical products, alongside strategic national initiatives to enhance domestic production and processing capabilities. The market size is anticipated to expand significantly, fueled by continued investments in both upstream exploration and development, and downstream refining and petrochemical complex expansions. Adoption rates for advanced technologies, such as AI-driven exploration and predictive maintenance, are increasing, leading to improved operational efficiency and reduced costs. Technological disruptions are manifesting in the form of digitalization across the value chain, from exploration to distribution, and the exploration of alternative energy sources and carbon capture technologies to meet sustainability goals. Consumer behavior shifts are evident in the growing preference for cleaner fuels, such as natural gas and hydrogen, and a greater demand for energy efficiency in industrial and transportation sectors. The Compound Annual Growth Rate (CAGR) for the oil and gas industry in Malaysia is estimated to be around 3.5% during the forecast period. Market penetration for advanced digital solutions is projected to reach 60% by 2030.
Dominant Regions, Countries, or Segments in Oil and Gas Industry in Malaysia
The Upstream segment is the dominant driver of growth and revenue within the Malaysian oil and gas industry. This dominance is underpinned by Malaysia's significant offshore hydrocarbon reserves, particularly in the Malay Basin and offshore Sabah and Sarawak. The Midstream segment, encompassing transportation, storage, and processing of crude oil and natural gas, plays a crucial role in supporting upstream activities and facilitating the export of liquefied natural gas (LNG) and refined products. The Downstream segment, encompassing refining, petrochemical production, and marketing, is also a significant contributor, leveraging Malaysia's strategic location and robust infrastructure to serve both domestic and international markets.
- Upstream Dominance:
- Key Drivers: Substantial offshore reserves, strategic exploration efforts, and advancements in EOR techniques.
- Market Share: Estimated to contribute over 55% of the total oil and gas industry revenue.
- Growth Potential: Driven by new field developments and optimization of existing assets.
- Midstream Significance:
- Key Drivers: Extensive pipeline networks, world-class LNG facilities (e.g., PFLNG), and strategic port infrastructure.
- Market Share: Accounts for approximately 25% of the industry's value chain.
- Growth Potential: Expansion of LNG export capacity and development of new gas processing plants.
- Downstream Contribution:
- Key Drivers: Integrated refinery and petrochemical complexes, strong demand for petrochemical derivatives, and a developed retail network.
- Market Share: Represents around 20% of the industry's revenue.
- Growth Potential: Focus on value-added petrochemical products and expansion of refining capacity.
Oil and Gas Industry in Malaysia Product Landscape
The Malaysian oil and gas industry offers a diverse product landscape, from crude oil and natural gas to a wide array of refined fuels and petrochemical derivatives. Key innovations focus on producing higher-grade fuels and specialty chemicals, meeting stringent environmental standards. Applications span transportation, power generation, industrial manufacturing, and consumer goods. Performance metrics are increasingly driven by efficiency, purity, and reduced environmental impact. Advancements in petrochemical synthesis are yielding novel polymers and advanced materials, enhancing the sector's contribution to the manufacturing economy.
Key Drivers, Barriers & Challenges in Oil and Gas Industry in Malaysia
Key Drivers:
- Robust Domestic Demand: Continued need for energy in power generation, transportation, and industry.
- Government Support & Policies: Favorable investment policies and national energy security objectives.
- Technological Advancements: Innovations in EOR, digitalization, and offshore exploration.
- Strategic Location: Proximity to key Asian markets for export of LNG and refined products.
Barriers & Challenges:
- Mature Fields & Declining Reserves: Challenges in maintaining production levels from existing assets.
- Volatile Global Oil Prices: Impact on investment decisions and profitability.
- Environmental Regulations & Sustainability Pressures: Increasing focus on decarbonization and emissions reduction.
- Talent Acquisition & Development: Need for skilled workforce in specialized areas.
- Supply Chain Disruptions: Geopolitical factors and logistical challenges can impact operations.
Emerging Opportunities in Oil and Gas Industry in Malaysia
Emerging opportunities lie in the development of carbon capture, utilization, and storage (CCUS) technologies to decarbonize existing operations and contribute to climate goals. The expansion of the hydrogen economy, leveraging Malaysia's natural gas infrastructure, presents a significant avenue for future growth. Furthermore, advancements in floating LNG technology, as evidenced by the new nearshore facility, open up possibilities for more flexible and cost-effective gas monetization. The petrochemical sector also offers opportunities for producing high-value specialty chemicals and advanced materials to cater to evolving industrial demands.
Growth Accelerators in the Oil and Gas Industry in Malaysia Industry
Growth in Malaysia's oil and gas sector is accelerated by strategic investments in deepwater exploration and production, coupled with the adoption of digital technologies for enhanced efficiency and cost reduction. The development of integrated petrochemical complexes to further process hydrocarbon resources into higher-value products is a key catalyst. Furthermore, strategic partnerships and joint ventures with international energy companies bring technological expertise and capital, fostering innovation and market expansion. The government's continued commitment to energy security and economic diversification through the oil and gas sector provides a stable foundation for sustained growth.
Key Players Shaping the Oil and Gas Industry in Malaysia Market
- Petro-Excel Sdn Bhd (PESB)
- ExxonMobil Corporation
- Shell Plc
- BP Plc
- Petronas Gas Bhd
- Chevron Corporation
- Altus Oil & Gas Malaysia Sdn Bhd
- Malaysiaian General Petroleum Corporation
- Malaysiaian Natural Gas Holding Company
- Petro Teguh (M) Sdn Bhd
Notable Milestones in Oil and Gas Industry in Malaysia Sector
- January 2023: JGC Corporation and Samsung Heavy Industries (SHI) secured an EPCC contract with Petronas for Malaysia's first nearshore floating LNG facility project, set to be the world's first, with a minimum annual production capacity of 2 million tonnes of LNG, completion scheduled for 2027.
- December 2022: Petronas announced an oil and gas discovery at the Nahara well in Block SK 306, with Petronas Carigali as the operator holding 100% participating interest.
In-Depth Oil and Gas Industry in Malaysia Market Outlook
The future outlook for Malaysia's oil and gas industry is marked by a strategic transition towards sustainability and value-added products. Growth accelerators will include the continued expansion of LNG capabilities, the development of CCUS technologies, and increased investment in advanced petrochemicals. The industry is poised to benefit from its strategic location in Asia, a region with sustained energy demand. Leveraging technological innovation and fostering strong international collaborations will be crucial for navigating the evolving energy landscape and ensuring long-term market relevance and profitability, with an estimated market value of over USD 80,000 Million by 2030.
Oil and Gas Industry in Malaysia Segmentation
- 1. Upstream
- 2. Midstream
- 3. Downstream
Oil and Gas Industry in Malaysia Segmentation By Geography
-
1. North America
- 1.1. United States
- 1.2. Canada
- 1.3. Mexico
-
2. South America
- 2.1. Brazil
- 2.2. Argentina
- 2.3. Rest of South America
-
3. Europe
- 3.1. United Kingdom
- 3.2. Germany
- 3.3. France
- 3.4. Italy
- 3.5. Spain
- 3.6. Russia
- 3.7. Benelux
- 3.8. Nordics
- 3.9. Rest of Europe
-
4. Middle East & Africa
- 4.1. Turkey
- 4.2. Israel
- 4.3. GCC
- 4.4. North Africa
- 4.5. South Africa
- 4.6. Rest of Middle East & Africa
-
5. Asia Pacific
- 5.1. China
- 5.2. India
- 5.3. Japan
- 5.4. South Korea
- 5.5. ASEAN
- 5.6. Oceania
- 5.7. Rest of Asia Pacific
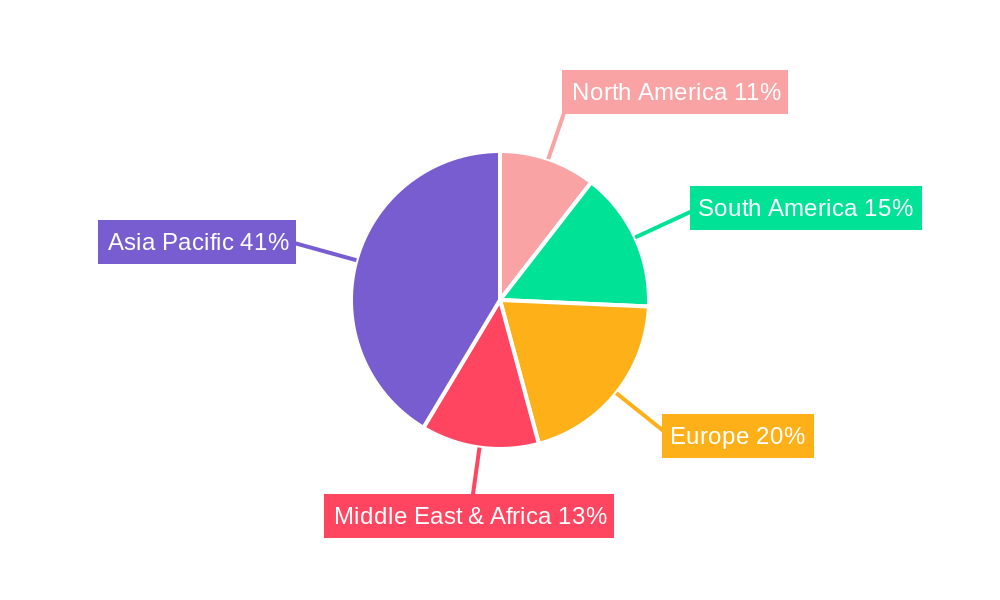
Oil and Gas Industry in Malaysia Regional Market Share
Geographic Coverage of Oil and Gas Industry in Malaysia
Oil and Gas Industry in Malaysia REPORT HIGHLIGHTS
| Aspects | Details |
|---|---|
| Study Period | 2020-2034 |
| Base Year | 2025 |
| Estimated Year | 2026 |
| Forecast Period | 2026-2034 |
| Historical Period | 2020-2025 |
| Growth Rate | CAGR of 3.8% from 2020-2034 |
| Segmentation |
|
Table of Contents
- 1. Introduction
- 1.1. Research Scope
- 1.2. Market Segmentation
- 1.3. Research Objective
- 1.4. Definitions and Assumptions
- 2. Executive Summary
- 2.1. Market Snapshot
- 3. Market Dynamics
- 3.1. Market Drivers
- 3.2. Market Restrains
- 3.3. Market Trends
- 3.4. Market Opportunities
- 4. Market Factor Analysis
- 4.1. Porters Five Forces
- 4.1.1. Bargaining Power of Suppliers
- 4.1.2. Bargaining Power of Buyers
- 4.1.3. Threat of New Entrants
- 4.1.4. Threat of Substitutes
- 4.1.5. Competitive Rivalry
- 4.2. PESTEL analysis
- 4.3. BCG Analysis
- 4.3.1. Stars (High Growth, High Market Share)
- 4.3.2. Cash Cows (Low Growth, High Market Share)
- 4.3.3. Question Mark (High Growth, Low Market Share)
- 4.3.4. Dogs (Low Growth, Low Market Share)
- 4.4. Ansoff Matrix Analysis
- 4.5. Supply Chain Analysis
- 4.6. Regulatory Landscape
- 4.7. Current Market Potential and Opportunity Assessment (TAM–SAM–SOM Framework)
- 4.8. VDR Analyst Note
- 4.1. Porters Five Forces
- 5. Market Analysis, Insights and Forecast 2021-2033
- 5.1. Market Analysis, Insights and Forecast - by Upstream
- 5.2. Market Analysis, Insights and Forecast - by Midstream
- 5.3. Market Analysis, Insights and Forecast - by Downstream
- 5.4. Market Analysis, Insights and Forecast - by Region
- 5.4.1. North America
- 5.4.2. South America
- 5.4.3. Europe
- 5.4.4. Middle East & Africa
- 5.4.5. Asia Pacific
- 6. Global Oil and Gas Industry in Malaysia Analysis, Insights and Forecast, 2021-2033
- 6.1. Market Analysis, Insights and Forecast - by Upstream
- 6.2. Market Analysis, Insights and Forecast - by Midstream
- 6.3. Market Analysis, Insights and Forecast - by Downstream
- 7. North America Oil and Gas Industry in Malaysia Analysis, Insights and Forecast, 2021-2033
- 7.1. Market Analysis, Insights and Forecast - by Upstream
- 7.2. Market Analysis, Insights and Forecast - by Midstream
- 7.3. Market Analysis, Insights and Forecast - by Downstream
- 8. South America Oil and Gas Industry in Malaysia Analysis, Insights and Forecast, 2021-2033
- 8.1. Market Analysis, Insights and Forecast - by Upstream
- 8.2. Market Analysis, Insights and Forecast - by Midstream
- 8.3. Market Analysis, Insights and Forecast - by Downstream
- 9. Europe Oil and Gas Industry in Malaysia Analysis, Insights and Forecast, 2021-2033
- 9.1. Market Analysis, Insights and Forecast - by Upstream
- 9.2. Market Analysis, Insights and Forecast - by Midstream
- 9.3. Market Analysis, Insights and Forecast - by Downstream
- 10. Middle East & Africa Oil and Gas Industry in Malaysia Analysis, Insights and Forecast, 2021-2033
- 10.1. Market Analysis, Insights and Forecast - by Upstream
- 10.2. Market Analysis, Insights and Forecast - by Midstream
- 10.3. Market Analysis, Insights and Forecast - by Downstream
- 11. Asia Pacific Oil and Gas Industry in Malaysia Analysis, Insights and Forecast, 2021-2033
- 11.1. Market Analysis, Insights and Forecast - by Upstream
- 11.2. Market Analysis, Insights and Forecast - by Midstream
- 11.3. Market Analysis, Insights and Forecast - by Downstream
- 12. Competitive Analysis
- 12.1. Company Profiles
- 12.1.1 Petro-Excel Sdn Bhd (PESB)
- 12.1.1.1. Company Overview
- 12.1.1.2. Products
- 12.1.1.3. Company Financials
- 12.1.1.4. SWOT Analysis
- 12.1.2 ExxonMobil Corporation
- 12.1.2.1. Company Overview
- 12.1.2.2. Products
- 12.1.2.3. Company Financials
- 12.1.2.4. SWOT Analysis
- 12.1.3 Shell Plc
- 12.1.3.1. Company Overview
- 12.1.3.2. Products
- 12.1.3.3. Company Financials
- 12.1.3.4. SWOT Analysis
- 12.1.4 BP Plc
- 12.1.4.1. Company Overview
- 12.1.4.2. Products
- 12.1.4.3. Company Financials
- 12.1.4.4. SWOT Analysis
- 12.1.5 Petronas Gas Bhd
- 12.1.5.1. Company Overview
- 12.1.5.2. Products
- 12.1.5.3. Company Financials
- 12.1.5.4. SWOT Analysis
- 12.1.6 Chevron Corporation
- 12.1.6.1. Company Overview
- 12.1.6.2. Products
- 12.1.6.3. Company Financials
- 12.1.6.4. SWOT Analysis
- 12.1.7 Altus Oil & Gas Malaysia Sdn Bhd
- 12.1.7.1. Company Overview
- 12.1.7.2. Products
- 12.1.7.3. Company Financials
- 12.1.7.4. SWOT Analysis
- 12.1.8 Malaysiaian General Petroleum Corporation
- 12.1.8.1. Company Overview
- 12.1.8.2. Products
- 12.1.8.3. Company Financials
- 12.1.8.4. SWOT Analysis
- 12.1.9 Malaysiaian Natural Gas Holding Company*List Not Exhaustive
- 12.1.9.1. Company Overview
- 12.1.9.2. Products
- 12.1.9.3. Company Financials
- 12.1.9.4. SWOT Analysis
- 12.1.10 Petro Teguh (M) Sdn Bhd
- 12.1.10.1. Company Overview
- 12.1.10.2. Products
- 12.1.10.3. Company Financials
- 12.1.10.4. SWOT Analysis
- 12.1.1 Petro-Excel Sdn Bhd (PESB)
- 12.2. Market Entropy
- 12.2.1 Company's Key Areas Served
- 12.2.2 Recent Developments
- 12.3. Company Market Share Analysis 2025
- 12.3.1 Top 5 Companies Market Share Analysis
- 12.3.2 Top 3 Companies Market Share Analysis
- 12.4. List of Potential Customers
- 13. Research Methodology
List of Figures
- Figure 1: Global Oil and Gas Industry in Malaysia Revenue Breakdown (billion, %) by Region 2025 & 2033
- Figure 2: Global Oil and Gas Industry in Malaysia Volume Breakdown (Thousand, %) by Region 2025 & 2033
- Figure 3: North America Oil and Gas Industry in Malaysia Revenue (billion), by Upstream 2025 & 2033
- Figure 4: North America Oil and Gas Industry in Malaysia Volume (Thousand), by Upstream 2025 & 2033
- Figure 5: North America Oil and Gas Industry in Malaysia Revenue Share (%), by Upstream 2025 & 2033
- Figure 6: North America Oil and Gas Industry in Malaysia Volume Share (%), by Upstream 2025 & 2033
- Figure 7: North America Oil and Gas Industry in Malaysia Revenue (billion), by Midstream 2025 & 2033
- Figure 8: North America Oil and Gas Industry in Malaysia Volume (Thousand), by Midstream 2025 & 2033
- Figure 9: North America Oil and Gas Industry in Malaysia Revenue Share (%), by Midstream 2025 & 2033
- Figure 10: North America Oil and Gas Industry in Malaysia Volume Share (%), by Midstream 2025 & 2033
- Figure 11: North America Oil and Gas Industry in Malaysia Revenue (billion), by Downstream 2025 & 2033
- Figure 12: North America Oil and Gas Industry in Malaysia Volume (Thousand), by Downstream 2025 & 2033
- Figure 13: North America Oil and Gas Industry in Malaysia Revenue Share (%), by Downstream 2025 & 2033
- Figure 14: North America Oil and Gas Industry in Malaysia Volume Share (%), by Downstream 2025 & 2033
- Figure 15: North America Oil and Gas Industry in Malaysia Revenue (billion), by Country 2025 & 2033
- Figure 16: North America Oil and Gas Industry in Malaysia Volume (Thousand), by Country 2025 & 2033
- Figure 17: North America Oil and Gas Industry in Malaysia Revenue Share (%), by Country 2025 & 2033
- Figure 18: North America Oil and Gas Industry in Malaysia Volume Share (%), by Country 2025 & 2033
- Figure 19: South America Oil and Gas Industry in Malaysia Revenue (billion), by Upstream 2025 & 2033
- Figure 20: South America Oil and Gas Industry in Malaysia Volume (Thousand), by Upstream 2025 & 2033
- Figure 21: South America Oil and Gas Industry in Malaysia Revenue Share (%), by Upstream 2025 & 2033
- Figure 22: South America Oil and Gas Industry in Malaysia Volume Share (%), by Upstream 2025 & 2033
- Figure 23: South America Oil and Gas Industry in Malaysia Revenue (billion), by Midstream 2025 & 2033
- Figure 24: South America Oil and Gas Industry in Malaysia Volume (Thousand), by Midstream 2025 & 2033
- Figure 25: South America Oil and Gas Industry in Malaysia Revenue Share (%), by Midstream 2025 & 2033
- Figure 26: South America Oil and Gas Industry in Malaysia Volume Share (%), by Midstream 2025 & 2033
- Figure 27: South America Oil and Gas Industry in Malaysia Revenue (billion), by Downstream 2025 & 2033
- Figure 28: South America Oil and Gas Industry in Malaysia Volume (Thousand), by Downstream 2025 & 2033
- Figure 29: South America Oil and Gas Industry in Malaysia Revenue Share (%), by Downstream 2025 & 2033
- Figure 30: South America Oil and Gas Industry in Malaysia Volume Share (%), by Downstream 2025 & 2033
- Figure 31: South America Oil and Gas Industry in Malaysia Revenue (billion), by Country 2025 & 2033
- Figure 32: South America Oil and Gas Industry in Malaysia Volume (Thousand), by Country 2025 & 2033
- Figure 33: South America Oil and Gas Industry in Malaysia Revenue Share (%), by Country 2025 & 2033
- Figure 34: South America Oil and Gas Industry in Malaysia Volume Share (%), by Country 2025 & 2033
- Figure 35: Europe Oil and Gas Industry in Malaysia Revenue (billion), by Upstream 2025 & 2033
- Figure 36: Europe Oil and Gas Industry in Malaysia Volume (Thousand), by Upstream 2025 & 2033
- Figure 37: Europe Oil and Gas Industry in Malaysia Revenue Share (%), by Upstream 2025 & 2033
- Figure 38: Europe Oil and Gas Industry in Malaysia Volume Share (%), by Upstream 2025 & 2033
- Figure 39: Europe Oil and Gas Industry in Malaysia Revenue (billion), by Midstream 2025 & 2033
- Figure 40: Europe Oil and Gas Industry in Malaysia Volume (Thousand), by Midstream 2025 & 2033
- Figure 41: Europe Oil and Gas Industry in Malaysia Revenue Share (%), by Midstream 2025 & 2033
- Figure 42: Europe Oil and Gas Industry in Malaysia Volume Share (%), by Midstream 2025 & 2033
- Figure 43: Europe Oil and Gas Industry in Malaysia Revenue (billion), by Downstream 2025 & 2033
- Figure 44: Europe Oil and Gas Industry in Malaysia Volume (Thousand), by Downstream 2025 & 2033
- Figure 45: Europe Oil and Gas Industry in Malaysia Revenue Share (%), by Downstream 2025 & 2033
- Figure 46: Europe Oil and Gas Industry in Malaysia Volume Share (%), by Downstream 2025 & 2033
- Figure 47: Europe Oil and Gas Industry in Malaysia Revenue (billion), by Country 2025 & 2033
- Figure 48: Europe Oil and Gas Industry in Malaysia Volume (Thousand), by Country 2025 & 2033
- Figure 49: Europe Oil and Gas Industry in Malaysia Revenue Share (%), by Country 2025 & 2033
- Figure 50: Europe Oil and Gas Industry in Malaysia Volume Share (%), by Country 2025 & 2033
- Figure 51: Middle East & Africa Oil and Gas Industry in Malaysia Revenue (billion), by Upstream 2025 & 2033
- Figure 52: Middle East & Africa Oil and Gas Industry in Malaysia Volume (Thousand), by Upstream 2025 & 2033
- Figure 53: Middle East & Africa Oil and Gas Industry in Malaysia Revenue Share (%), by Upstream 2025 & 2033
- Figure 54: Middle East & Africa Oil and Gas Industry in Malaysia Volume Share (%), by Upstream 2025 & 2033
- Figure 55: Middle East & Africa Oil and Gas Industry in Malaysia Revenue (billion), by Midstream 2025 & 2033
- Figure 56: Middle East & Africa Oil and Gas Industry in Malaysia Volume (Thousand), by Midstream 2025 & 2033
- Figure 57: Middle East & Africa Oil and Gas Industry in Malaysia Revenue Share (%), by Midstream 2025 & 2033
- Figure 58: Middle East & Africa Oil and Gas Industry in Malaysia Volume Share (%), by Midstream 2025 & 2033
- Figure 59: Middle East & Africa Oil and Gas Industry in Malaysia Revenue (billion), by Downstream 2025 & 2033
- Figure 60: Middle East & Africa Oil and Gas Industry in Malaysia Volume (Thousand), by Downstream 2025 & 2033
- Figure 61: Middle East & Africa Oil and Gas Industry in Malaysia Revenue Share (%), by Downstream 2025 & 2033
- Figure 62: Middle East & Africa Oil and Gas Industry in Malaysia Volume Share (%), by Downstream 2025 & 2033
- Figure 63: Middle East & Africa Oil and Gas Industry in Malaysia Revenue (billion), by Country 2025 & 2033
- Figure 64: Middle East & Africa Oil and Gas Industry in Malaysia Volume (Thousand), by Country 2025 & 2033
- Figure 65: Middle East & Africa Oil and Gas Industry in Malaysia Revenue Share (%), by Country 2025 & 2033
- Figure 66: Middle East & Africa Oil and Gas Industry in Malaysia Volume Share (%), by Country 2025 & 2033
- Figure 67: Asia Pacific Oil and Gas Industry in Malaysia Revenue (billion), by Upstream 2025 & 2033
- Figure 68: Asia Pacific Oil and Gas Industry in Malaysia Volume (Thousand), by Upstream 2025 & 2033
- Figure 69: Asia Pacific Oil and Gas Industry in Malaysia Revenue Share (%), by Upstream 2025 & 2033
- Figure 70: Asia Pacific Oil and Gas Industry in Malaysia Volume Share (%), by Upstream 2025 & 2033
- Figure 71: Asia Pacific Oil and Gas Industry in Malaysia Revenue (billion), by Midstream 2025 & 2033
- Figure 72: Asia Pacific Oil and Gas Industry in Malaysia Volume (Thousand), by Midstream 2025 & 2033
- Figure 73: Asia Pacific Oil and Gas Industry in Malaysia Revenue Share (%), by Midstream 2025 & 2033
- Figure 74: Asia Pacific Oil and Gas Industry in Malaysia Volume Share (%), by Midstream 2025 & 2033
- Figure 75: Asia Pacific Oil and Gas Industry in Malaysia Revenue (billion), by Downstream 2025 & 2033
- Figure 76: Asia Pacific Oil and Gas Industry in Malaysia Volume (Thousand), by Downstream 2025 & 2033
- Figure 77: Asia Pacific Oil and Gas Industry in Malaysia Revenue Share (%), by Downstream 2025 & 2033
- Figure 78: Asia Pacific Oil and Gas Industry in Malaysia Volume Share (%), by Downstream 2025 & 2033
- Figure 79: Asia Pacific Oil and Gas Industry in Malaysia Revenue (billion), by Country 2025 & 2033
- Figure 80: Asia Pacific Oil and Gas Industry in Malaysia Volume (Thousand), by Country 2025 & 2033
- Figure 81: Asia Pacific Oil and Gas Industry in Malaysia Revenue Share (%), by Country 2025 & 2033
- Figure 82: Asia Pacific Oil and Gas Industry in Malaysia Volume Share (%), by Country 2025 & 2033
List of Tables
- Table 1: Global Oil and Gas Industry in Malaysia Revenue billion Forecast, by Upstream 2020 & 2033
- Table 2: Global Oil and Gas Industry in Malaysia Volume Thousand Forecast, by Upstream 2020 & 2033
- Table 3: Global Oil and Gas Industry in Malaysia Revenue billion Forecast, by Midstream 2020 & 2033
- Table 4: Global Oil and Gas Industry in Malaysia Volume Thousand Forecast, by Midstream 2020 & 2033
- Table 5: Global Oil and Gas Industry in Malaysia Revenue billion Forecast, by Downstream 2020 & 2033
- Table 6: Global Oil and Gas Industry in Malaysia Volume Thousand Forecast, by Downstream 2020 & 2033
- Table 7: Global Oil and Gas Industry in Malaysia Revenue billion Forecast, by Region 2020 & 2033
- Table 8: Global Oil and Gas Industry in Malaysia Volume Thousand Forecast, by Region 2020 & 2033
- Table 9: Global Oil and Gas Industry in Malaysia Revenue billion Forecast, by Upstream 2020 & 2033
- Table 10: Global Oil and Gas Industry in Malaysia Volume Thousand Forecast, by Upstream 2020 & 2033
- Table 11: Global Oil and Gas Industry in Malaysia Revenue billion Forecast, by Midstream 2020 & 2033
- Table 12: Global Oil and Gas Industry in Malaysia Volume Thousand Forecast, by Midstream 2020 & 2033
- Table 13: Global Oil and Gas Industry in Malaysia Revenue billion Forecast, by Downstream 2020 & 2033
- Table 14: Global Oil and Gas Industry in Malaysia Volume Thousand Forecast, by Downstream 2020 & 2033
- Table 15: Global Oil and Gas Industry in Malaysia Revenue billion Forecast, by Country 2020 & 2033
- Table 16: Global Oil and Gas Industry in Malaysia Volume Thousand Forecast, by Country 2020 & 2033
- Table 17: United States Oil and Gas Industry in Malaysia Revenue (billion) Forecast, by Application 2020 & 2033
- Table 18: United States Oil and Gas Industry in Malaysia Volume (Thousand) Forecast, by Application 2020 & 2033
- Table 19: Canada Oil and Gas Industry in Malaysia Revenue (billion) Forecast, by Application 2020 & 2033
- Table 20: Canada Oil and Gas Industry in Malaysia Volume (Thousand) Forecast, by Application 2020 & 2033
- Table 21: Mexico Oil and Gas Industry in Malaysia Revenue (billion) Forecast, by Application 2020 & 2033
- Table 22: Mexico Oil and Gas Industry in Malaysia Volume (Thousand) Forecast, by Application 2020 & 2033
- Table 23: Global Oil and Gas Industry in Malaysia Revenue billion Forecast, by Upstream 2020 & 2033
- Table 24: Global Oil and Gas Industry in Malaysia Volume Thousand Forecast, by Upstream 2020 & 2033
- Table 25: Global Oil and Gas Industry in Malaysia Revenue billion Forecast, by Midstream 2020 & 2033
- Table 26: Global Oil and Gas Industry in Malaysia Volume Thousand Forecast, by Midstream 2020 & 2033
- Table 27: Global Oil and Gas Industry in Malaysia Revenue billion Forecast, by Downstream 2020 & 2033
- Table 28: Global Oil and Gas Industry in Malaysia Volume Thousand Forecast, by Downstream 2020 & 2033
- Table 29: Global Oil and Gas Industry in Malaysia Revenue billion Forecast, by Country 2020 & 2033
- Table 30: Global Oil and Gas Industry in Malaysia Volume Thousand Forecast, by Country 2020 & 2033
- Table 31: Brazil Oil and Gas Industry in Malaysia Revenue (billion) Forecast, by Application 2020 & 2033
- Table 32: Brazil Oil and Gas Industry in Malaysia Volume (Thousand) Forecast, by Application 2020 & 2033
- Table 33: Argentina Oil and Gas Industry in Malaysia Revenue (billion) Forecast, by Application 2020 & 2033
- Table 34: Argentina Oil and Gas Industry in Malaysia Volume (Thousand) Forecast, by Application 2020 & 2033
- Table 35: Rest of South America Oil and Gas Industry in Malaysia Revenue (billion) Forecast, by Application 2020 & 2033
- Table 36: Rest of South America Oil and Gas Industry in Malaysia Volume (Thousand) Forecast, by Application 2020 & 2033
- Table 37: Global Oil and Gas Industry in Malaysia Revenue billion Forecast, by Upstream 2020 & 2033
- Table 38: Global Oil and Gas Industry in Malaysia Volume Thousand Forecast, by Upstream 2020 & 2033
- Table 39: Global Oil and Gas Industry in Malaysia Revenue billion Forecast, by Midstream 2020 & 2033
- Table 40: Global Oil and Gas Industry in Malaysia Volume Thousand Forecast, by Midstream 2020 & 2033
- Table 41: Global Oil and Gas Industry in Malaysia Revenue billion Forecast, by Downstream 2020 & 2033
- Table 42: Global Oil and Gas Industry in Malaysia Volume Thousand Forecast, by Downstream 2020 & 2033
- Table 43: Global Oil and Gas Industry in Malaysia Revenue billion Forecast, by Country 2020 & 2033
- Table 44: Global Oil and Gas Industry in Malaysia Volume Thousand Forecast, by Country 2020 & 2033
- Table 45: United Kingdom Oil and Gas Industry in Malaysia Revenue (billion) Forecast, by Application 2020 & 2033
- Table 46: United Kingdom Oil and Gas Industry in Malaysia Volume (Thousand) Forecast, by Application 2020 & 2033
- Table 47: Germany Oil and Gas Industry in Malaysia Revenue (billion) Forecast, by Application 2020 & 2033
- Table 48: Germany Oil and Gas Industry in Malaysia Volume (Thousand) Forecast, by Application 2020 & 2033
- Table 49: France Oil and Gas Industry in Malaysia Revenue (billion) Forecast, by Application 2020 & 2033
- Table 50: France Oil and Gas Industry in Malaysia Volume (Thousand) Forecast, by Application 2020 & 2033
- Table 51: Italy Oil and Gas Industry in Malaysia Revenue (billion) Forecast, by Application 2020 & 2033
- Table 52: Italy Oil and Gas Industry in Malaysia Volume (Thousand) Forecast, by Application 2020 & 2033
- Table 53: Spain Oil and Gas Industry in Malaysia Revenue (billion) Forecast, by Application 2020 & 2033
- Table 54: Spain Oil and Gas Industry in Malaysia Volume (Thousand) Forecast, by Application 2020 & 2033
- Table 55: Russia Oil and Gas Industry in Malaysia Revenue (billion) Forecast, by Application 2020 & 2033
- Table 56: Russia Oil and Gas Industry in Malaysia Volume (Thousand) Forecast, by Application 2020 & 2033
- Table 57: Benelux Oil and Gas Industry in Malaysia Revenue (billion) Forecast, by Application 2020 & 2033
- Table 58: Benelux Oil and Gas Industry in Malaysia Volume (Thousand) Forecast, by Application 2020 & 2033
- Table 59: Nordics Oil and Gas Industry in Malaysia Revenue (billion) Forecast, by Application 2020 & 2033
- Table 60: Nordics Oil and Gas Industry in Malaysia Volume (Thousand) Forecast, by Application 2020 & 2033
- Table 61: Rest of Europe Oil and Gas Industry in Malaysia Revenue (billion) Forecast, by Application 2020 & 2033
- Table 62: Rest of Europe Oil and Gas Industry in Malaysia Volume (Thousand) Forecast, by Application 2020 & 2033
- Table 63: Global Oil and Gas Industry in Malaysia Revenue billion Forecast, by Upstream 2020 & 2033
- Table 64: Global Oil and Gas Industry in Malaysia Volume Thousand Forecast, by Upstream 2020 & 2033
- Table 65: Global Oil and Gas Industry in Malaysia Revenue billion Forecast, by Midstream 2020 & 2033
- Table 66: Global Oil and Gas Industry in Malaysia Volume Thousand Forecast, by Midstream 2020 & 2033
- Table 67: Global Oil and Gas Industry in Malaysia Revenue billion Forecast, by Downstream 2020 & 2033
- Table 68: Global Oil and Gas Industry in Malaysia Volume Thousand Forecast, by Downstream 2020 & 2033
- Table 69: Global Oil and Gas Industry in Malaysia Revenue billion Forecast, by Country 2020 & 2033
- Table 70: Global Oil and Gas Industry in Malaysia Volume Thousand Forecast, by Country 2020 & 2033
- Table 71: Turkey Oil and Gas Industry in Malaysia Revenue (billion) Forecast, by Application 2020 & 2033
- Table 72: Turkey Oil and Gas Industry in Malaysia Volume (Thousand) Forecast, by Application 2020 & 2033
- Table 73: Israel Oil and Gas Industry in Malaysia Revenue (billion) Forecast, by Application 2020 & 2033
- Table 74: Israel Oil and Gas Industry in Malaysia Volume (Thousand) Forecast, by Application 2020 & 2033
- Table 75: GCC Oil and Gas Industry in Malaysia Revenue (billion) Forecast, by Application 2020 & 2033
- Table 76: GCC Oil and Gas Industry in Malaysia Volume (Thousand) Forecast, by Application 2020 & 2033
- Table 77: North Africa Oil and Gas Industry in Malaysia Revenue (billion) Forecast, by Application 2020 & 2033
- Table 78: North Africa Oil and Gas Industry in Malaysia Volume (Thousand) Forecast, by Application 2020 & 2033
- Table 79: South Africa Oil and Gas Industry in Malaysia Revenue (billion) Forecast, by Application 2020 & 2033
- Table 80: South Africa Oil and Gas Industry in Malaysia Volume (Thousand) Forecast, by Application 2020 & 2033
- Table 81: Rest of Middle East & Africa Oil and Gas Industry in Malaysia Revenue (billion) Forecast, by Application 2020 & 2033
- Table 82: Rest of Middle East & Africa Oil and Gas Industry in Malaysia Volume (Thousand) Forecast, by Application 2020 & 2033
- Table 83: Global Oil and Gas Industry in Malaysia Revenue billion Forecast, by Upstream 2020 & 2033
- Table 84: Global Oil and Gas Industry in Malaysia Volume Thousand Forecast, by Upstream 2020 & 2033
- Table 85: Global Oil and Gas Industry in Malaysia Revenue billion Forecast, by Midstream 2020 & 2033
- Table 86: Global Oil and Gas Industry in Malaysia Volume Thousand Forecast, by Midstream 2020 & 2033
- Table 87: Global Oil and Gas Industry in Malaysia Revenue billion Forecast, by Downstream 2020 & 2033
- Table 88: Global Oil and Gas Industry in Malaysia Volume Thousand Forecast, by Downstream 2020 & 2033
- Table 89: Global Oil and Gas Industry in Malaysia Revenue billion Forecast, by Country 2020 & 2033
- Table 90: Global Oil and Gas Industry in Malaysia Volume Thousand Forecast, by Country 2020 & 2033
- Table 91: China Oil and Gas Industry in Malaysia Revenue (billion) Forecast, by Application 2020 & 2033
- Table 92: China Oil and Gas Industry in Malaysia Volume (Thousand) Forecast, by Application 2020 & 2033
- Table 93: India Oil and Gas Industry in Malaysia Revenue (billion) Forecast, by Application 2020 & 2033
- Table 94: India Oil and Gas Industry in Malaysia Volume (Thousand) Forecast, by Application 2020 & 2033
- Table 95: Japan Oil and Gas Industry in Malaysia Revenue (billion) Forecast, by Application 2020 & 2033
- Table 96: Japan Oil and Gas Industry in Malaysia Volume (Thousand) Forecast, by Application 2020 & 2033
- Table 97: South Korea Oil and Gas Industry in Malaysia Revenue (billion) Forecast, by Application 2020 & 2033
- Table 98: South Korea Oil and Gas Industry in Malaysia Volume (Thousand) Forecast, by Application 2020 & 2033
- Table 99: ASEAN Oil and Gas Industry in Malaysia Revenue (billion) Forecast, by Application 2020 & 2033
- Table 100: ASEAN Oil and Gas Industry in Malaysia Volume (Thousand) Forecast, by Application 2020 & 2033
- Table 101: Oceania Oil and Gas Industry in Malaysia Revenue (billion) Forecast, by Application 2020 & 2033
- Table 102: Oceania Oil and Gas Industry in Malaysia Volume (Thousand) Forecast, by Application 2020 & 2033
- Table 103: Rest of Asia Pacific Oil and Gas Industry in Malaysia Revenue (billion) Forecast, by Application 2020 & 2033
- Table 104: Rest of Asia Pacific Oil and Gas Industry in Malaysia Volume (Thousand) Forecast, by Application 2020 & 2033
Frequently Asked Questions
1. What is the projected Compound Annual Growth Rate (CAGR) of the Oil and Gas Industry in Malaysia?
The projected CAGR is approximately 3.8%.
2. Which companies are prominent players in the Oil and Gas Industry in Malaysia?
Key companies in the market include Petro-Excel Sdn Bhd (PESB), ExxonMobil Corporation, Shell Plc, BP Plc, Petronas Gas Bhd, Chevron Corporation, Altus Oil & Gas Malaysia Sdn Bhd, Malaysiaian General Petroleum Corporation, Malaysiaian Natural Gas Holding Company*List Not Exhaustive, Petro Teguh (M) Sdn Bhd.
3. What are the main segments of the Oil and Gas Industry in Malaysia?
The market segments include Upstream, Midstream, Downstream.
4. Can you provide details about the market size?
The market size is estimated to be USD 11.44 billion as of 2022.
5. What are some drivers contributing to market growth?
4.; Surging Demand For Refined Petroleum Products4.; Significant Untapped Petroleum Reserves in the Sedimentary Basins.
6. What are the notable trends driving market growth?
Midstream Sector is Expected to Have Significant Market Share.
7. Are there any restraints impacting market growth?
4.; High Volatility of Crude Oil Prices.
8. Can you provide examples of recent developments in the market?
January 2023: A consortium of JGC Corporation and Samsung Heavy Industries (SHI) secured an engineering, procurement, construction, and commissioning (EPCC) contract with Petronas for Malaysia's first nearshore floating LNG facility project. The planned facility is set to become the world's first nearshore floating LNG facility. It has a minimum production capacity of 2 million tonnes of LNG annually and is scheduled for completion in 2027.
9. What pricing options are available for accessing the report?
Pricing options include single-user, multi-user, and enterprise licenses priced at USD 3800, USD 4500, and USD 5800 respectively.
10. Is the market size provided in terms of value or volume?
The market size is provided in terms of value, measured in billion and volume, measured in Thousand.
11. Are there any specific market keywords associated with the report?
Yes, the market keyword associated with the report is "Oil and Gas Industry in Malaysia," which aids in identifying and referencing the specific market segment covered.
12. How do I determine which pricing option suits my needs best?
The pricing options vary based on user requirements and access needs. Individual users may opt for single-user licenses, while businesses requiring broader access may choose multi-user or enterprise licenses for cost-effective access to the report.
13. Are there any additional resources or data provided in the Oil and Gas Industry in Malaysia report?
While the report offers comprehensive insights, it's advisable to review the specific contents or supplementary materials provided to ascertain if additional resources or data are available.
14. How can I stay updated on further developments or reports in the Oil and Gas Industry in Malaysia?
To stay informed about further developments, trends, and reports in the Oil and Gas Industry in Malaysia, consider subscribing to industry newsletters, following relevant companies and organizations, or regularly checking reputable industry news sources and publications.
Methodology
Step 1 - Identification of Relevant Samples Size from Population Database


Step 2 - Approaches for Defining Global Market Size (Value, Volume* & Price*)

Note*: In applicable scenarios
Step 3 - Data Sources
Primary Research
- Web Analytics
- Survey Reports
- Research Institute
- Latest Research Reports
- Opinion Leaders
Secondary Research
- Annual Reports
- White Paper
- Latest Press Release
- Industry Association
- Paid Database
- Investor Presentations

Step 4 - Data Triangulation
Involves using different sources of information in order to increase the validity of a study
These sources are likely to be stakeholders in a program - participants, other researchers, program staff, other community members, and so on.
Then we put all data in single framework & apply various statistical tools to find out the dynamic on the market.
During the analysis stage, feedback from the stakeholder groups would be compared to determine areas of agreement as well as areas of divergence