

Key Insights
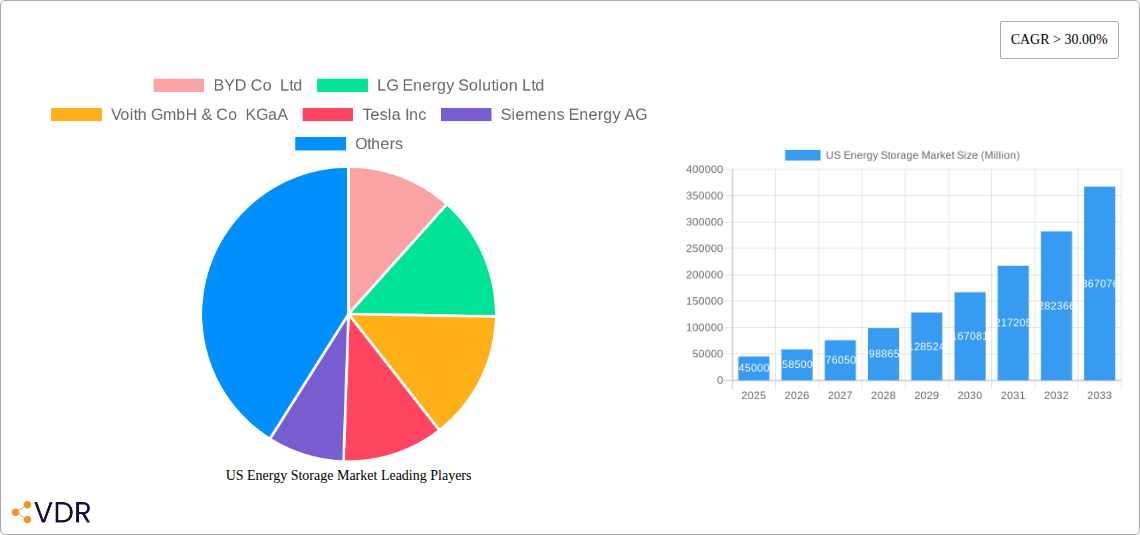
The US energy storage market is projected for significant expansion, driven by increasing grid stability needs, renewable energy integration, and supportive decarbonization policies. Battery storage is leading this growth, with falling costs and enhanced performance. Alternative technologies like flywheels and compressed air energy storage are also gaining traction. The market anticipates a Compound Annual Growth Rate (CAGR) of 29.1%, reaching a market size of 106.7 billion by 2033, with 2024 as the base year.
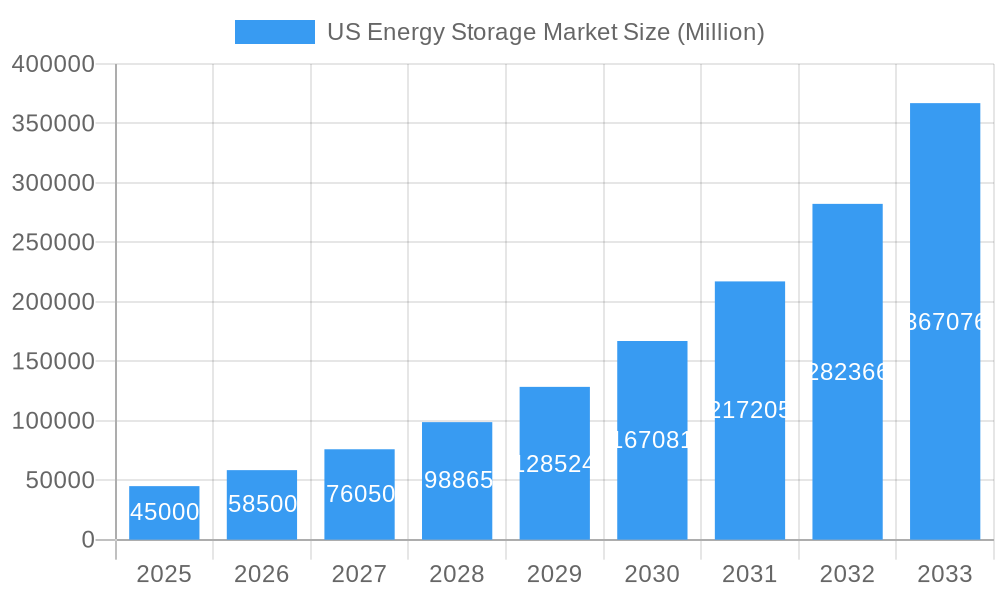
US Energy Storage Market Market Size (In Billion)
Residential and Commercial & Industrial (C&I) sectors are key adoption drivers. Homeowners are investing in battery systems for backup power and solar self-consumption, while C&I clients utilize storage for peak shaving and demand charge management. Leading companies are investing in R&D to meet this escalating demand. North America, especially the US, leads due to substantial investments and favorable clean energy regulations.
US Energy Storage Market Company Market Share
US Energy Storage Market Report: Trends, Dynamics, and Future Outlook (2019-2033)
This comprehensive report delivers an in-depth analysis of the US Energy Storage Market, covering market dynamics, growth trends, regional dominance, product landscape, key drivers, barriers, opportunities, and a detailed player and milestone analysis. With robust data spanning the historical period of 2019-2024, a base year of 2025, and an extensive forecast period up to 2033, this report provides actionable insights for stakeholders. The US energy storage market, encompassing both parent and child markets, is experiencing unprecedented growth driven by renewable energy integration, grid modernization efforts, and supportive government policies. This report will present all values in Million units for clarity and consistency.
US Energy Storage Market Market Dynamics & Structure
The US energy storage market is characterized by dynamic evolution, driven by a confluence of technological advancements, evolving regulatory landscapes, and shifting end-user demands. Market concentration varies across segments, with battery technology dominating the parent market while other energy storage system technologies carve out niche applications. Key innovation drivers include the escalating need for grid stability amidst increasing renewable energy penetration, the pursuit of energy independence, and advancements in battery chemistries and system integration. Regulatory frameworks, such as federal tax credits and state-level mandates, play a crucial role in shaping market adoption. Competitive product substitutes, primarily traditional grid infrastructure and backup generators, are increasingly being challenged by the cost-effectiveness and flexibility of energy storage solutions. End-user demographics are diversifying, with significant growth observed in residential, commercial, and industrial sectors, each with distinct energy storage requirements. Mergers and acquisitions (M&A) trends indicate a consolidation phase, with larger entities acquiring innovative startups to expand their technological portfolios and market reach. For instance, the past few years have seen a notable increase in M&A activities aimed at securing intellectual property and scaling production capabilities. Barriers to innovation, such as high upfront costs and the need for standardization, continue to be addressed through ongoing research and development and policy support.
- Market Concentration: Highly fragmented in nascent segments, consolidating in mature battery technologies.
- Technological Innovation Drivers: Renewable integration, grid reliability, cost reduction, energy density improvements.
- Regulatory Frameworks: Federal Investment Tax Credits (ITC), state renewable portfolio standards, grid modernization initiatives.
- Competitive Product Substitutes: Conventional power plants, diesel generators, demand response programs.
- End-User Demographics: Diversifying from utility-scale to residential and C&I adoption.
- M&A Trends: Strategic acquisitions by large utilities and technology providers to gain market share and technological edge.
US Energy Storage Market Growth Trends & Insights
The US energy storage market is on an upward trajectory, projected to experience robust growth over the forecast period. The market size evolution is intrinsically linked to the accelerating adoption of renewable energy sources like solar and wind, which necessitate energy storage for grid stability and reliability. We estimate the market size in the base year 2025 to be XXX Million units. Adoption rates are surging across all end-user segments, propelled by decreasing battery costs, enhanced performance metrics, and a growing awareness of the benefits of energy independence and resilience. Technological disruptions, particularly in battery chemistries (e.g., solid-state batteries) and advanced power electronics, are continuously pushing the boundaries of efficiency and capacity. Consumer behavior shifts are evident, with a growing preference for smart home solutions, electric vehicle (EV) integration, and a desire to reduce reliance on the grid. The market penetration of energy storage systems, particularly in the residential and commercial sectors, is expected to witness a Compound Annual Growth Rate (CAGR) of XX.XX% from 2025 to 2033. This growth is further fueled by the increasing electrification of transportation and the demand for microgrids to enhance energy security. The interplay between these factors creates a fertile ground for sustained market expansion, as evident in the significant increase in deployment projects and utility-scale storage installations. The transition towards a decarbonized energy future underpins the long-term growth potential, making energy storage a critical component of the modern energy landscape. The increasing emphasis on grid modernization and the need to manage the intermittency of renewables are primary catalysts.
Dominant Regions, Countries, or Segments in US Energy Storage Market
Within the expansive US energy storage market, several regions, countries (at a national level within the US), and specific segments are demonstrating exceptional growth and dominance. The Battery Technology segment, a crucial part of the parent market, is currently the primary driver of overall market expansion. Its dominance stems from the widespread application of lithium-ion batteries in utility-scale projects, residential systems, and electric vehicles. Within the US, states with ambitious renewable energy targets and supportive regulatory environments are leading the charge. California, for instance, has consistently been at the forefront, driven by its clean energy mandates, high solar penetration, and significant investments in grid modernization projects.
Technology Dominance:
- Batteries: Lithium-ion batteries are the cornerstone, powering a vast majority of installations due to their energy density, cost-effectiveness, and established supply chains. This segment alone is projected to capture XX% of the total market value by 2033.
- Other Energy Storage System Technologies: While smaller, technologies like pumped hydro, compressed air energy storage (CAES), and flywheels are crucial for grid-scale, long-duration storage applications and are seeing renewed interest.
Phase Dominance:
- Three Phase: Dominates utility-scale and large commercial and industrial (C&I) applications, providing crucial grid services and power management for heavy loads. This segment is expected to account for XX% of the market by 2033.
- Single Phase: Primarily caters to the residential sector, offering backup power, peak shaving, and seamless integration with rooftop solar PV systems.
End User Dominance:
- Commercial and Industrial (C&I): This segment is experiencing rapid growth, driven by the desire for cost savings through peak shaving, backup power to ensure business continuity, and the increasing adoption of on-site renewables. C&I installations are projected to represent XX% of the market by 2033.
- Residential: Fueled by falling costs, increasing electricity prices, and a growing demand for energy independence and resilience against grid outages, the residential segment is also a significant growth engine.
Regional Leadership:
- California: Leads due to its robust renewable energy policies, significant solar deployment, and progressive grid modernization initiatives, making it a prime market for both utility-scale and distributed energy storage.
- Texas: With its vast renewable energy potential (especially wind) and a deregulated electricity market, Texas is emerging as a major hub for energy storage development, particularly for grid services.
- Northeastern States: States like New York and Massachusetts are actively investing in energy storage to meet renewable energy goals and enhance grid resilience.
US Energy Storage Market Product Landscape
The US energy storage market's product landscape is a dynamic arena of innovation, showcasing advancements in battery chemistries, system integration, and intelligent control software. Lithium-ion batteries continue to lead, with ongoing improvements in energy density, cycle life, and safety features. Products range from compact residential battery systems offering backup power and solar integration to massive grid-scale installations providing ancillary services and grid stabilization. Other energy storage system technologies are also seeing refinement, with advancements in molten salt thermal energy storage and compressed air energy storage for longer-duration applications. Unique selling propositions often lie in modular designs for scalability, advanced thermal management systems for optimal performance, and sophisticated energy management software that maximizes economic benefits through intelligent charging and discharging strategies. Technological advancements are focused on reducing upfront costs, enhancing round-trip efficiency, and extending the operational lifespan of storage assets.
Key Drivers, Barriers & Challenges in US Energy Storage Market
The US energy storage market is propelled by several key drivers, including the increasing integration of intermittent renewable energy sources like solar and wind power, which necessitates reliable backup and grid stabilization. Government incentives, such as federal tax credits and state-level mandates for energy storage deployment, are crucial accelerators. Furthermore, the growing demand for grid resilience against extreme weather events and the pursuit of energy independence among consumers and businesses are significant motivators. The declining cost of battery technology, coupled with advancements in system efficiency, makes energy storage increasingly economically viable.
However, significant barriers and challenges persist. High upfront capital costs for large-scale installations remain a hurdle, despite falling prices. Regulatory complexities and permitting processes can lead to project delays. Supply chain vulnerabilities, particularly for critical battery materials, pose a risk to consistent production and pricing. The lack of standardized interconnection rules across different utility territories can complicate project deployment. Moreover, competition from established grid infrastructure and the need for robust cybersecurity measures for connected energy storage systems present ongoing challenges.
Emerging Opportunities in US Energy Storage Market
Emerging opportunities in the US energy storage market are abundant, driven by evolving energy needs and technological advancements. The burgeoning electric vehicle (EV) market presents a significant opportunity for vehicle-to-grid (V2G) technology, allowing EVs to act as distributed energy storage assets. The development of long-duration energy storage solutions (beyond 4-10 hours) is crucial for ensuring grid reliability with higher penetrations of renewables, opening avenues for new technologies like flow batteries and advanced thermal storage. Furthermore, microgrid development for critical infrastructure, commercial campuses, and even entire communities offers substantial growth potential, enhancing resilience and energy security. The increasing focus on decarbonization and the electrification of the grid are creating demand for integrated solutions that combine energy storage with renewable generation and smart grid technologies. The expansion into underserved markets and the development of innovative financing models are also key to unlocking future growth.
Growth Accelerators in the US Energy Storage Market Industry
Several catalysts are accelerating long-term growth in the US energy storage market. Technological breakthroughs, such as the development of more cost-effective and sustainable battery chemistries and improvements in power electronics for efficient energy conversion, are fundamental. Strategic partnerships between utilities, technology providers, and project developers are fostering innovation and streamlining project deployment. Market expansion strategies, including the development of new business models like energy-as-a-service, are making energy storage more accessible to a wider range of customers. Increased federal and state government support, through extended tax credits and ambitious renewable energy targets, provides a stable policy environment that encourages investment. The growing demand for grid services, such as frequency regulation and voltage support, is creating new revenue streams for energy storage projects, further driving their economic viability and deployment.
Key Players Shaping the US Energy Storage Market Market
- BYD Co Ltd
- LG Energy Solution Ltd
- Voith GmbH & Co KGaA
- Tesla Inc
- Siemens Energy AG
- Sungrow Power Supply Co Ltd
- Fluence Energy
- Andritz AG
- Enphase Energy
- Sonnen GmbH
Notable Milestones in US Energy Storage Market Sector
- March 2021: Apple's commitment to powering its California headquarters and manufacturing park with renewable energy, including a new energy storage project, underscored the corporate adoption of sustainable power solutions.
- November 2021: The agreement between Apparent, California Energy Commission, and Los Angeles Department of Transportation to power electric buses with a solar plus storage microgrid system highlighted the potential for integrated renewable solutions in transportation infrastructure.
In-Depth US Energy Storage Market Market Outlook
The future outlook for the US energy storage market is exceptionally bright, fueled by a robust combination of technological innovation, supportive policies, and escalating demand for reliable, clean energy. Growth accelerators, including continuous improvements in battery technology, strategic investments in grid modernization, and the rapid expansion of the electric vehicle ecosystem, will continue to drive market expansion. The increasing focus on grid resilience in the face of climate change and the imperative to decarbonize the energy sector will further solidify energy storage's role as a critical infrastructure component. Strategic opportunities lie in the development of long-duration energy storage solutions, the widespread adoption of V2G technology, and the expansion of microgrid deployment across diverse applications. The market is poised for sustained growth, transforming the nation's energy landscape towards a more sustainable and resilient future.
US Energy Storage Market Segmentation
-
1. Technology
- 1.1. Batteries
- 1.2. Other Energy Storage System Technologies
-
2. Phase
- 2.1. Single Phase
- 2.2. Three Phase
-
3. End User
- 3.1. Residential
- 3.2. Commercial and Industrial
US Energy Storage Market Segmentation By Geography
-
1. North America
- 1.1. United States
- 1.2. Canada
- 1.3. Mexico
-
2. South America
- 2.1. Brazil
- 2.2. Argentina
- 2.3. Rest of South America
-
3. Europe
- 3.1. United Kingdom
- 3.2. Germany
- 3.3. France
- 3.4. Italy
- 3.5. Spain
- 3.6. Russia
- 3.7. Benelux
- 3.8. Nordics
- 3.9. Rest of Europe
-
4. Middle East & Africa
- 4.1. Turkey
- 4.2. Israel
- 4.3. GCC
- 4.4. North Africa
- 4.5. South Africa
- 4.6. Rest of Middle East & Africa
-
5. Asia Pacific
- 5.1. China
- 5.2. India
- 5.3. Japan
- 5.4. South Korea
- 5.5. ASEAN
- 5.6. Oceania
- 5.7. Rest of Asia Pacific
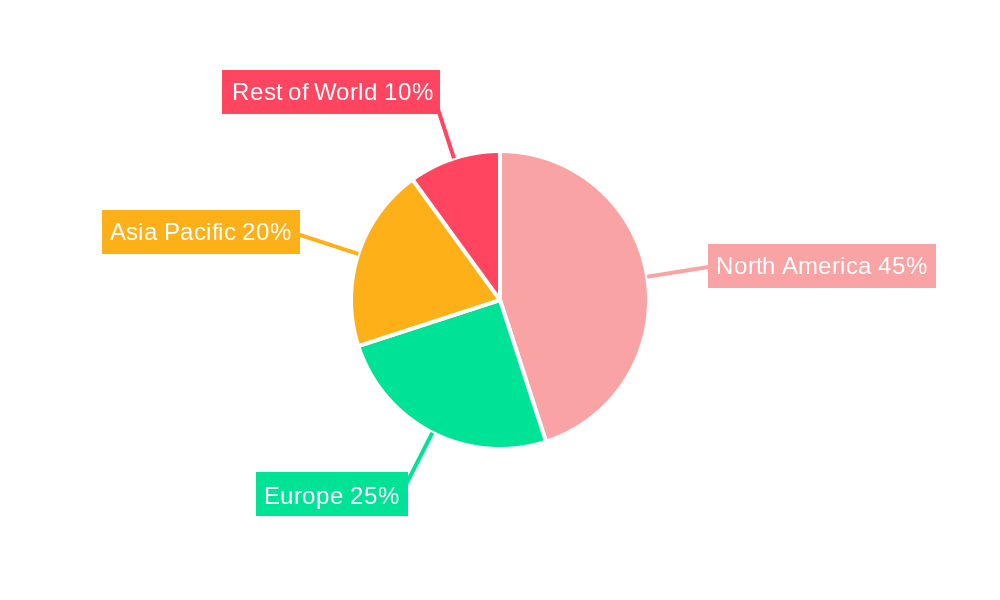
US Energy Storage Market Regional Market Share
Geographic Coverage of US Energy Storage Market
US Energy Storage Market REPORT HIGHLIGHTS
| Aspects | Details |
|---|---|
| Study Period | 2020-2034 |
| Base Year | 2025 |
| Estimated Year | 2026 |
| Forecast Period | 2026-2034 |
| Historical Period | 2020-2025 |
| Growth Rate | CAGR of 29.1% from 2020-2034 |
| Segmentation |
|
Table of Contents
- 1. Introduction
- 1.1. Research Scope
- 1.2. Market Segmentation
- 1.3. Research Objective
- 1.4. Definitions and Assumptions
- 2. Executive Summary
- 2.1. Market Snapshot
- 3. Market Dynamics
- 3.1. Market Drivers
- 3.2. Market Restrains
- 3.3. Market Trends
- 3.4. Market Opportunities
- 4. Market Factor Analysis
- 4.1. Porters Five Forces
- 4.1.1. Bargaining Power of Suppliers
- 4.1.2. Bargaining Power of Buyers
- 4.1.3. Threat of New Entrants
- 4.1.4. Threat of Substitutes
- 4.1.5. Competitive Rivalry
- 4.2. PESTEL analysis
- 4.3. BCG Analysis
- 4.3.1. Stars (High Growth, High Market Share)
- 4.3.2. Cash Cows (Low Growth, High Market Share)
- 4.3.3. Question Mark (High Growth, Low Market Share)
- 4.3.4. Dogs (Low Growth, Low Market Share)
- 4.4. Ansoff Matrix Analysis
- 4.5. Supply Chain Analysis
- 4.6. Regulatory Landscape
- 4.7. Current Market Potential and Opportunity Assessment (TAM–SAM–SOM Framework)
- 4.8. VDR Analyst Note
- 4.1. Porters Five Forces
- 5. Market Analysis, Insights and Forecast 2021-2033
- 5.1. Market Analysis, Insights and Forecast - by Technology
- 5.1.1. Batteries
- 5.1.2. Other Energy Storage System Technologies
- 5.2. Market Analysis, Insights and Forecast - by Phase
- 5.2.1. Single Phase
- 5.2.2. Three Phase
- 5.3. Market Analysis, Insights and Forecast - by End User
- 5.3.1. Residential
- 5.3.2. Commercial and Industrial
- 5.4. Market Analysis, Insights and Forecast - by Region
- 5.4.1. North America
- 5.4.2. South America
- 5.4.3. Europe
- 5.4.4. Middle East & Africa
- 5.4.5. Asia Pacific
- 5.1. Market Analysis, Insights and Forecast - by Technology
- 6. Global US Energy Storage Market Analysis, Insights and Forecast, 2021-2033
- 6.1. Market Analysis, Insights and Forecast - by Technology
- 6.1.1. Batteries
- 6.1.2. Other Energy Storage System Technologies
- 6.2. Market Analysis, Insights and Forecast - by Phase
- 6.2.1. Single Phase
- 6.2.2. Three Phase
- 6.3. Market Analysis, Insights and Forecast - by End User
- 6.3.1. Residential
- 6.3.2. Commercial and Industrial
- 6.1. Market Analysis, Insights and Forecast - by Technology
- 7. North America US Energy Storage Market Analysis, Insights and Forecast, 2021-2033
- 7.1. Market Analysis, Insights and Forecast - by Technology
- 7.1.1. Batteries
- 7.1.2. Other Energy Storage System Technologies
- 7.2. Market Analysis, Insights and Forecast - by Phase
- 7.2.1. Single Phase
- 7.2.2. Three Phase
- 7.3. Market Analysis, Insights and Forecast - by End User
- 7.3.1. Residential
- 7.3.2. Commercial and Industrial
- 7.1. Market Analysis, Insights and Forecast - by Technology
- 8. South America US Energy Storage Market Analysis, Insights and Forecast, 2021-2033
- 8.1. Market Analysis, Insights and Forecast - by Technology
- 8.1.1. Batteries
- 8.1.2. Other Energy Storage System Technologies
- 8.2. Market Analysis, Insights and Forecast - by Phase
- 8.2.1. Single Phase
- 8.2.2. Three Phase
- 8.3. Market Analysis, Insights and Forecast - by End User
- 8.3.1. Residential
- 8.3.2. Commercial and Industrial
- 8.1. Market Analysis, Insights and Forecast - by Technology
- 9. Europe US Energy Storage Market Analysis, Insights and Forecast, 2021-2033
- 9.1. Market Analysis, Insights and Forecast - by Technology
- 9.1.1. Batteries
- 9.1.2. Other Energy Storage System Technologies
- 9.2. Market Analysis, Insights and Forecast - by Phase
- 9.2.1. Single Phase
- 9.2.2. Three Phase
- 9.3. Market Analysis, Insights and Forecast - by End User
- 9.3.1. Residential
- 9.3.2. Commercial and Industrial
- 9.1. Market Analysis, Insights and Forecast - by Technology
- 10. Middle East & Africa US Energy Storage Market Analysis, Insights and Forecast, 2021-2033
- 10.1. Market Analysis, Insights and Forecast - by Technology
- 10.1.1. Batteries
- 10.1.2. Other Energy Storage System Technologies
- 10.2. Market Analysis, Insights and Forecast - by Phase
- 10.2.1. Single Phase
- 10.2.2. Three Phase
- 10.3. Market Analysis, Insights and Forecast - by End User
- 10.3.1. Residential
- 10.3.2. Commercial and Industrial
- 10.1. Market Analysis, Insights and Forecast - by Technology
- 11. Asia Pacific US Energy Storage Market Analysis, Insights and Forecast, 2021-2033
- 11.1. Market Analysis, Insights and Forecast - by Technology
- 11.1.1. Batteries
- 11.1.2. Other Energy Storage System Technologies
- 11.2. Market Analysis, Insights and Forecast - by Phase
- 11.2.1. Single Phase
- 11.2.2. Three Phase
- 11.3. Market Analysis, Insights and Forecast - by End User
- 11.3.1. Residential
- 11.3.2. Commercial and Industrial
- 11.1. Market Analysis, Insights and Forecast - by Technology
- 12. Competitive Analysis
- 12.1. Company Profiles
- 12.1.1 BYD Co Ltd
- 12.1.1.1. Company Overview
- 12.1.1.2. Products
- 12.1.1.3. Company Financials
- 12.1.1.4. SWOT Analysis
- 12.1.2 LG Energy Solution Ltd
- 12.1.2.1. Company Overview
- 12.1.2.2. Products
- 12.1.2.3. Company Financials
- 12.1.2.4. SWOT Analysis
- 12.1.3 Voith GmbH & Co KGaA
- 12.1.3.1. Company Overview
- 12.1.3.2. Products
- 12.1.3.3. Company Financials
- 12.1.3.4. SWOT Analysis
- 12.1.4 Tesla Inc
- 12.1.4.1. Company Overview
- 12.1.4.2. Products
- 12.1.4.3. Company Financials
- 12.1.4.4. SWOT Analysis
- 12.1.5 Siemens Energy AG
- 12.1.5.1. Company Overview
- 12.1.5.2. Products
- 12.1.5.3. Company Financials
- 12.1.5.4. SWOT Analysis
- 12.1.6 Sungrow Power Supply Co Ltd
- 12.1.6.1. Company Overview
- 12.1.6.2. Products
- 12.1.6.3. Company Financials
- 12.1.6.4. SWOT Analysis
- 12.1.7 Fluence Energy*List Not Exhaustive
- 12.1.7.1. Company Overview
- 12.1.7.2. Products
- 12.1.7.3. Company Financials
- 12.1.7.4. SWOT Analysis
- 12.1.8 Andritz AG
- 12.1.8.1. Company Overview
- 12.1.8.2. Products
- 12.1.8.3. Company Financials
- 12.1.8.4. SWOT Analysis
- 12.1.9 Enphase Energy
- 12.1.9.1. Company Overview
- 12.1.9.2. Products
- 12.1.9.3. Company Financials
- 12.1.9.4. SWOT Analysis
- 12.1.10 Sonnen GmbH
- 12.1.10.1. Company Overview
- 12.1.10.2. Products
- 12.1.10.3. Company Financials
- 12.1.10.4. SWOT Analysis
- 12.1.1 BYD Co Ltd
- 12.2. Market Entropy
- 12.2.1 Company's Key Areas Served
- 12.2.2 Recent Developments
- 12.3. Company Market Share Analysis 2025
- 12.3.1 Top 5 Companies Market Share Analysis
- 12.3.2 Top 3 Companies Market Share Analysis
- 12.4. List of Potential Customers
- 13. Research Methodology
List of Figures
- Figure 1: Global US Energy Storage Market Revenue Breakdown (billion, %) by Region 2025 & 2033
- Figure 2: North America US Energy Storage Market Revenue (billion), by Technology 2025 & 2033
- Figure 3: North America US Energy Storage Market Revenue Share (%), by Technology 2025 & 2033
- Figure 4: North America US Energy Storage Market Revenue (billion), by Phase 2025 & 2033
- Figure 5: North America US Energy Storage Market Revenue Share (%), by Phase 2025 & 2033
- Figure 6: North America US Energy Storage Market Revenue (billion), by End User 2025 & 2033
- Figure 7: North America US Energy Storage Market Revenue Share (%), by End User 2025 & 2033
- Figure 8: North America US Energy Storage Market Revenue (billion), by Country 2025 & 2033
- Figure 9: North America US Energy Storage Market Revenue Share (%), by Country 2025 & 2033
- Figure 10: South America US Energy Storage Market Revenue (billion), by Technology 2025 & 2033
- Figure 11: South America US Energy Storage Market Revenue Share (%), by Technology 2025 & 2033
- Figure 12: South America US Energy Storage Market Revenue (billion), by Phase 2025 & 2033
- Figure 13: South America US Energy Storage Market Revenue Share (%), by Phase 2025 & 2033
- Figure 14: South America US Energy Storage Market Revenue (billion), by End User 2025 & 2033
- Figure 15: South America US Energy Storage Market Revenue Share (%), by End User 2025 & 2033
- Figure 16: South America US Energy Storage Market Revenue (billion), by Country 2025 & 2033
- Figure 17: South America US Energy Storage Market Revenue Share (%), by Country 2025 & 2033
- Figure 18: Europe US Energy Storage Market Revenue (billion), by Technology 2025 & 2033
- Figure 19: Europe US Energy Storage Market Revenue Share (%), by Technology 2025 & 2033
- Figure 20: Europe US Energy Storage Market Revenue (billion), by Phase 2025 & 2033
- Figure 21: Europe US Energy Storage Market Revenue Share (%), by Phase 2025 & 2033
- Figure 22: Europe US Energy Storage Market Revenue (billion), by End User 2025 & 2033
- Figure 23: Europe US Energy Storage Market Revenue Share (%), by End User 2025 & 2033
- Figure 24: Europe US Energy Storage Market Revenue (billion), by Country 2025 & 2033
- Figure 25: Europe US Energy Storage Market Revenue Share (%), by Country 2025 & 2033
- Figure 26: Middle East & Africa US Energy Storage Market Revenue (billion), by Technology 2025 & 2033
- Figure 27: Middle East & Africa US Energy Storage Market Revenue Share (%), by Technology 2025 & 2033
- Figure 28: Middle East & Africa US Energy Storage Market Revenue (billion), by Phase 2025 & 2033
- Figure 29: Middle East & Africa US Energy Storage Market Revenue Share (%), by Phase 2025 & 2033
- Figure 30: Middle East & Africa US Energy Storage Market Revenue (billion), by End User 2025 & 2033
- Figure 31: Middle East & Africa US Energy Storage Market Revenue Share (%), by End User 2025 & 2033
- Figure 32: Middle East & Africa US Energy Storage Market Revenue (billion), by Country 2025 & 2033
- Figure 33: Middle East & Africa US Energy Storage Market Revenue Share (%), by Country 2025 & 2033
- Figure 34: Asia Pacific US Energy Storage Market Revenue (billion), by Technology 2025 & 2033
- Figure 35: Asia Pacific US Energy Storage Market Revenue Share (%), by Technology 2025 & 2033
- Figure 36: Asia Pacific US Energy Storage Market Revenue (billion), by Phase 2025 & 2033
- Figure 37: Asia Pacific US Energy Storage Market Revenue Share (%), by Phase 2025 & 2033
- Figure 38: Asia Pacific US Energy Storage Market Revenue (billion), by End User 2025 & 2033
- Figure 39: Asia Pacific US Energy Storage Market Revenue Share (%), by End User 2025 & 2033
- Figure 40: Asia Pacific US Energy Storage Market Revenue (billion), by Country 2025 & 2033
- Figure 41: Asia Pacific US Energy Storage Market Revenue Share (%), by Country 2025 & 2033
List of Tables
- Table 1: Global US Energy Storage Market Revenue billion Forecast, by Technology 2020 & 2033
- Table 2: Global US Energy Storage Market Revenue billion Forecast, by Phase 2020 & 2033
- Table 3: Global US Energy Storage Market Revenue billion Forecast, by End User 2020 & 2033
- Table 4: Global US Energy Storage Market Revenue billion Forecast, by Region 2020 & 2033
- Table 5: Global US Energy Storage Market Revenue billion Forecast, by Technology 2020 & 2033
- Table 6: Global US Energy Storage Market Revenue billion Forecast, by Phase 2020 & 2033
- Table 7: Global US Energy Storage Market Revenue billion Forecast, by End User 2020 & 2033
- Table 8: Global US Energy Storage Market Revenue billion Forecast, by Country 2020 & 2033
- Table 9: United States US Energy Storage Market Revenue (billion) Forecast, by Application 2020 & 2033
- Table 10: Canada US Energy Storage Market Revenue (billion) Forecast, by Application 2020 & 2033
- Table 11: Mexico US Energy Storage Market Revenue (billion) Forecast, by Application 2020 & 2033
- Table 12: Global US Energy Storage Market Revenue billion Forecast, by Technology 2020 & 2033
- Table 13: Global US Energy Storage Market Revenue billion Forecast, by Phase 2020 & 2033
- Table 14: Global US Energy Storage Market Revenue billion Forecast, by End User 2020 & 2033
- Table 15: Global US Energy Storage Market Revenue billion Forecast, by Country 2020 & 2033
- Table 16: Brazil US Energy Storage Market Revenue (billion) Forecast, by Application 2020 & 2033
- Table 17: Argentina US Energy Storage Market Revenue (billion) Forecast, by Application 2020 & 2033
- Table 18: Rest of South America US Energy Storage Market Revenue (billion) Forecast, by Application 2020 & 2033
- Table 19: Global US Energy Storage Market Revenue billion Forecast, by Technology 2020 & 2033
- Table 20: Global US Energy Storage Market Revenue billion Forecast, by Phase 2020 & 2033
- Table 21: Global US Energy Storage Market Revenue billion Forecast, by End User 2020 & 2033
- Table 22: Global US Energy Storage Market Revenue billion Forecast, by Country 2020 & 2033
- Table 23: United Kingdom US Energy Storage Market Revenue (billion) Forecast, by Application 2020 & 2033
- Table 24: Germany US Energy Storage Market Revenue (billion) Forecast, by Application 2020 & 2033
- Table 25: France US Energy Storage Market Revenue (billion) Forecast, by Application 2020 & 2033
- Table 26: Italy US Energy Storage Market Revenue (billion) Forecast, by Application 2020 & 2033
- Table 27: Spain US Energy Storage Market Revenue (billion) Forecast, by Application 2020 & 2033
- Table 28: Russia US Energy Storage Market Revenue (billion) Forecast, by Application 2020 & 2033
- Table 29: Benelux US Energy Storage Market Revenue (billion) Forecast, by Application 2020 & 2033
- Table 30: Nordics US Energy Storage Market Revenue (billion) Forecast, by Application 2020 & 2033
- Table 31: Rest of Europe US Energy Storage Market Revenue (billion) Forecast, by Application 2020 & 2033
- Table 32: Global US Energy Storage Market Revenue billion Forecast, by Technology 2020 & 2033
- Table 33: Global US Energy Storage Market Revenue billion Forecast, by Phase 2020 & 2033
- Table 34: Global US Energy Storage Market Revenue billion Forecast, by End User 2020 & 2033
- Table 35: Global US Energy Storage Market Revenue billion Forecast, by Country 2020 & 2033
- Table 36: Turkey US Energy Storage Market Revenue (billion) Forecast, by Application 2020 & 2033
- Table 37: Israel US Energy Storage Market Revenue (billion) Forecast, by Application 2020 & 2033
- Table 38: GCC US Energy Storage Market Revenue (billion) Forecast, by Application 2020 & 2033
- Table 39: North Africa US Energy Storage Market Revenue (billion) Forecast, by Application 2020 & 2033
- Table 40: South Africa US Energy Storage Market Revenue (billion) Forecast, by Application 2020 & 2033
- Table 41: Rest of Middle East & Africa US Energy Storage Market Revenue (billion) Forecast, by Application 2020 & 2033
- Table 42: Global US Energy Storage Market Revenue billion Forecast, by Technology 2020 & 2033
- Table 43: Global US Energy Storage Market Revenue billion Forecast, by Phase 2020 & 2033
- Table 44: Global US Energy Storage Market Revenue billion Forecast, by End User 2020 & 2033
- Table 45: Global US Energy Storage Market Revenue billion Forecast, by Country 2020 & 2033
- Table 46: China US Energy Storage Market Revenue (billion) Forecast, by Application 2020 & 2033
- Table 47: India US Energy Storage Market Revenue (billion) Forecast, by Application 2020 & 2033
- Table 48: Japan US Energy Storage Market Revenue (billion) Forecast, by Application 2020 & 2033
- Table 49: South Korea US Energy Storage Market Revenue (billion) Forecast, by Application 2020 & 2033
- Table 50: ASEAN US Energy Storage Market Revenue (billion) Forecast, by Application 2020 & 2033
- Table 51: Oceania US Energy Storage Market Revenue (billion) Forecast, by Application 2020 & 2033
- Table 52: Rest of Asia Pacific US Energy Storage Market Revenue (billion) Forecast, by Application 2020 & 2033
Frequently Asked Questions
1. What is the projected Compound Annual Growth Rate (CAGR) of the US Energy Storage Market?
The projected CAGR is approximately 29.1%.
2. Which companies are prominent players in the US Energy Storage Market?
Key companies in the market include BYD Co Ltd, LG Energy Solution Ltd, Voith GmbH & Co KGaA, Tesla Inc, Siemens Energy AG, Sungrow Power Supply Co Ltd, Fluence Energy*List Not Exhaustive, Andritz AG, Enphase Energy, Sonnen GmbH.
3. What are the main segments of the US Energy Storage Market?
The market segments include Technology, Phase, End User.
4. Can you provide details about the market size?
The market size is estimated to be USD 106.7 billion as of 2022.
5. What are some drivers contributing to market growth?
4.; The High Amount of Waste Generation in the Country4.; The growing Focus on Non-Fossil Fuel Sources.
6. What are the notable trends driving market growth?
Residential Segment Expected to Dominate the Market.
7. Are there any restraints impacting market growth?
4.; The Recycling Rate of Waste in Germany.
8. Can you provide examples of recent developments in the market?
In March 2021, Apple inspired the entire corporate world by setting up a solar farm to power its headquarters in California, the United States, and installing rooftop solar panels for its manufacturing park in the city. The company announced that the initiative has been taken by not only one arm, but its 110 manufacturing partners around the globe, which are switching to renewable options to power their infrastructure. It has also implemented a new energy storage project in California to pilot new solutions for renewable infrastructure.
9. What pricing options are available for accessing the report?
Pricing options include single-user, multi-user, and enterprise licenses priced at USD 3800, USD 4500, and USD 5800 respectively.
10. Is the market size provided in terms of value or volume?
The market size is provided in terms of value, measured in billion.
11. Are there any specific market keywords associated with the report?
Yes, the market keyword associated with the report is "US Energy Storage Market," which aids in identifying and referencing the specific market segment covered.
12. How do I determine which pricing option suits my needs best?
The pricing options vary based on user requirements and access needs. Individual users may opt for single-user licenses, while businesses requiring broader access may choose multi-user or enterprise licenses for cost-effective access to the report.
13. Are there any additional resources or data provided in the US Energy Storage Market report?
While the report offers comprehensive insights, it's advisable to review the specific contents or supplementary materials provided to ascertain if additional resources or data are available.
14. How can I stay updated on further developments or reports in the US Energy Storage Market?
To stay informed about further developments, trends, and reports in the US Energy Storage Market, consider subscribing to industry newsletters, following relevant companies and organizations, or regularly checking reputable industry news sources and publications.
Methodology
Step 1 - Identification of Relevant Samples Size from Population Database


Step 2 - Approaches for Defining Global Market Size (Value, Volume* & Price*)

Note*: In applicable scenarios
Step 3 - Data Sources
Primary Research
- Web Analytics
- Survey Reports
- Research Institute
- Latest Research Reports
- Opinion Leaders
Secondary Research
- Annual Reports
- White Paper
- Latest Press Release
- Industry Association
- Paid Database
- Investor Presentations

Step 4 - Data Triangulation
Involves using different sources of information in order to increase the validity of a study
These sources are likely to be stakeholders in a program - participants, other researchers, program staff, other community members, and so on.
Then we put all data in single framework & apply various statistical tools to find out the dynamic on the market.
During the analysis stage, feedback from the stakeholder groups would be compared to determine areas of agreement as well as areas of divergence