

Key Insights
The global Floating Production Storage and Offloading (FPSO) market is experiencing robust growth, projected to reach a significant valuation in 2025, driven by increasing offshore oil and gas exploration activities and the demand for efficient production solutions in challenging environments. With a Compound Annual Growth Rate (CAGR) of 8.50%, the market is set to expand substantially throughout the forecast period. Key drivers include the development of deepwater and ultra-deepwater fields, where FPSOs offer a cost-effective and flexible alternative to fixed platforms. Furthermore, technological advancements in FPSO design, such as enhanced processing capabilities and increased storage capacities, are bolstering market expansion. The ongoing need to tap into previously uneconomical reserves, coupled with favorable government policies encouraging offshore resource development, will continue to fuel demand. Major players like Shell PLC, BP PLC, Saipem SpA, and Bluewater Holding BV are heavily investing in new projects and innovative technologies to maintain their competitive edge.
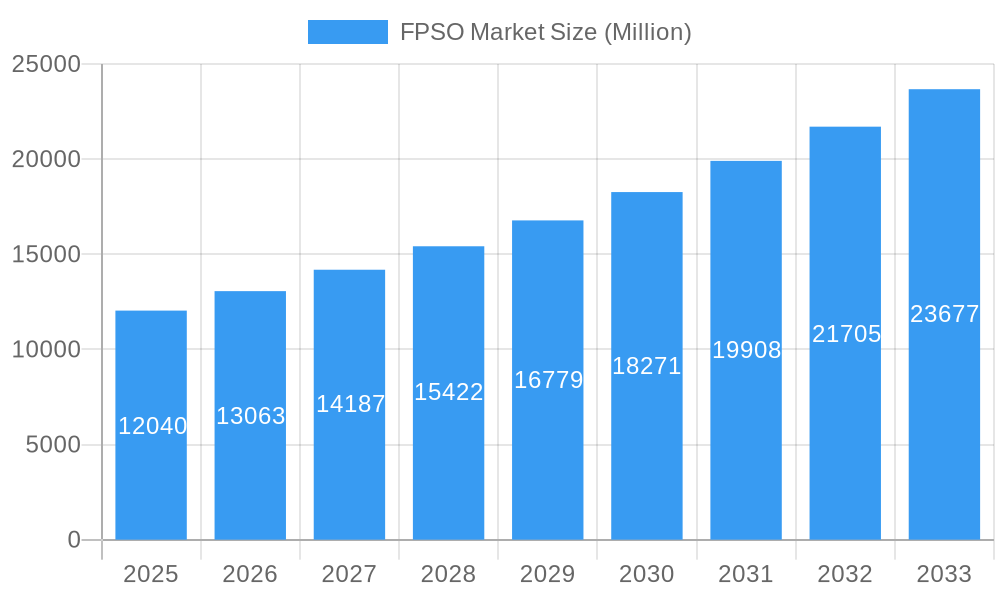
FPSO Market Market Size (In Billion)
The FPSO market is segmented by ownership, with operator-owned and contractor-owned segments playing crucial roles, each catering to different operational models. Water depth is another significant segmentation, with substantial growth anticipated in deepwater and ultra-deepwater applications as companies push the boundaries of exploration. Geographically, North America, particularly the United States, and Europe, with its established offshore infrastructure and ongoing projects in regions like Norway and the UK, are leading the market. The Asia Pacific region is also emerging as a significant growth hub, driven by China and Southeast Asian nations' increasing investments in offshore energy. While the market presents considerable opportunities, potential restraints include volatile oil prices, stringent environmental regulations, and the high initial capital expenditure required for FPSO deployment. However, the inherent flexibility and operational efficiency of FPSOs are expected to outweigh these challenges, ensuring sustained market expansion.
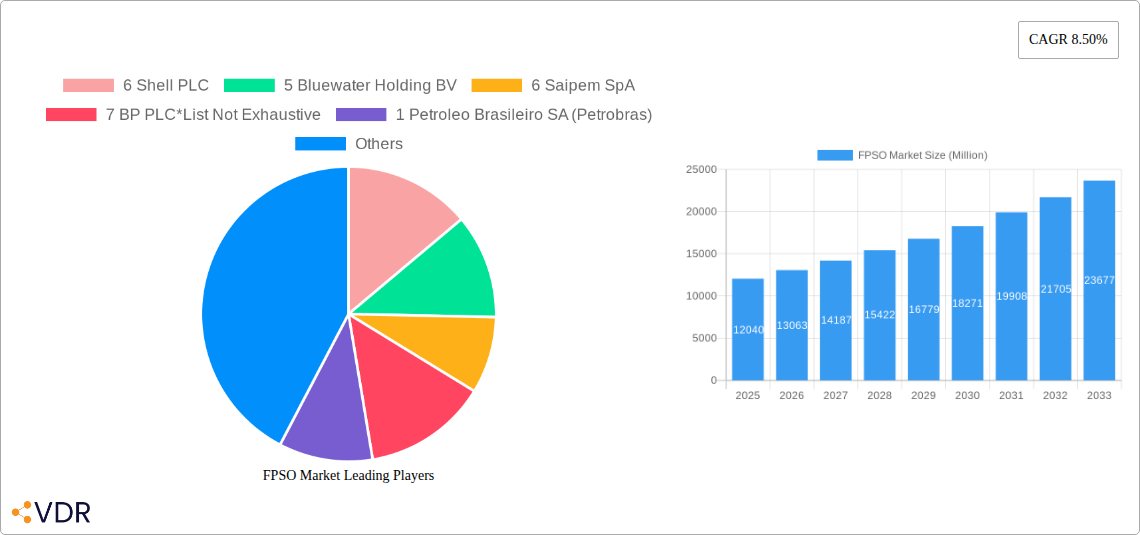
FPSO Market Company Market Share
This comprehensive report delves into the dynamic global Floating Production, Storage, and Offloading (FPSO) market, providing an in-depth analysis of its structure, growth trajectories, regional dominance, and future outlook. Spanning the study period of 2019–2033, with a base year of 2025, this report offers critical insights for industry stakeholders, investors, and decision-makers navigating the evolving offshore oil and gas sector. We meticulously examine parent and child market segments, including Ownership (Operator-owned, Contractor-owned) and Water Depth (Shallow Water, Deep Water, Ultra-deep Water), to deliver a granular understanding of market dynamics.
FPSO Market Market Dynamics & Structure
The global FPSO market is characterized by a moderately concentrated competitive landscape, with key players investing heavily in technological advancements and strategic partnerships to secure market share. Technological innovation is a primary driver, particularly in developing solutions for increasingly complex offshore environments, including ultra-deep water operations and harsh weather conditions. Regulatory frameworks governing offshore exploration and production significantly influence market accessibility and operational standards, with stringent environmental and safety regulations shaping project development. Competitive product substitutes, such as fixed platforms and subsea tie-backs, exist but are often limited by specific field characteristics and economic viability compared to the flexibility and cost-effectiveness of FPSOs in certain scenarios. End-user demographics are primarily dominated by major international oil companies (IOCs) and national oil companies (NOCs) undertaking large-scale offshore projects. Merger and acquisition (M&A) trends are active, driven by the pursuit of enhanced capabilities, broader geographical reach, and the consolidation of expertise. For instance, recent M&A activities are expected to bolster market concentration, with estimated M&A deal volumes in the range of 5,000 – 7,000 Million units during the historical period. Innovation barriers include the substantial capital investment required for R&D and the long lead times associated with FPSO development and deployment.
- Market Concentration: Moderate, with a few dominant players and a significant number of specialized service providers.
- Technological Innovation Drivers: Advancements in mooring systems, subsea processing, digitalization, and enhanced oil recovery (EOR) techniques.
- Regulatory Frameworks: Impact of environmental protection policies, safety standards, and local content requirements.
- Competitive Product Substitutes: Fixed platforms, subsea processing systems, and Floating LNG (FLNG) units.
- End-User Demographics: Predominantly IOCs and NOCs with extensive offshore portfolios.
- M&A Trends: Driven by consolidation, capability enhancement, and market expansion.
- Innovation Barriers: High capital expenditure, long project cycles, and complex technological integration.
FPSO Market Growth Trends & Insights
The global FPSO market is projected for robust growth, driven by increasing investments in offshore oil and gas exploration and production, particularly in frontier basins and deep-water reserves. The market size evolution is expected to witness a Compound Annual Growth Rate (CAGR) of approximately 6.5% between 2025 and 2033, reaching an estimated market valuation of 150,000 - 180,000 Million units by the end of the forecast period. Adoption rates for FPSO technology are escalating as the industry seeks more efficient and flexible solutions for marginal field development and stranded reserves. Technological disruptions, such as the integration of artificial intelligence (AI) for predictive maintenance and enhanced operational efficiency, alongside advancements in subsea technologies, are reshaping the market. Consumer behavior shifts are evident, with a growing preference for lifecycle solutions that encompass design, fabrication, operation, and decommissioning, favoring integrated service providers. Market penetration is expanding into regions with significant untapped deep-water and ultra-deep-water hydrocarbon potential. The demand for floating production solutions is further fueled by the increasing maturity of some onshore fields, prompting a strategic shift towards offshore exploration for new revenue streams.
Dominant Regions, Countries, or Segments in FPSO Market
The Deep Water segment, particularly within the Asia Pacific region, is currently the most dominant driver of growth in the global FPSO market. This dominance is fueled by substantial investments in offshore exploration and production by major national oil companies and international players, particularly in countries like China and Southeast Asian nations with vast untapped deep-water reserves. The increasing complexity of offshore projects in these regions necessitates advanced solutions like FPSOs, which offer greater flexibility and cost-effectiveness for developing challenging fields.
Asia Pacific's dominance is further bolstered by favorable economic policies that encourage offshore development, significant government support for the energy sector, and the ongoing expansion of domestic energy production capacities. The region's extensive coastline and vast Exclusive Economic Zones (EEZs) provide ample opportunities for offshore exploration. Market share in the Deep Water segment within Asia Pacific is estimated to be around 35-40% of the global total.
- Key Drivers in Deep Water (Asia Pacific):
- Discovery and development of large deep-water oil and gas fields.
- Government incentives and policies promoting offshore E&P.
- Technological advancements enabling operations in extreme depths.
- Growing energy demand necessitating diversified supply sources.
- Presence of major FPSO contractors and operators with regional expertise.
The Operator-owned segment also plays a crucial role, as major operators often prefer to own and manage their FPSO assets to maintain greater control over operations and long-term strategic planning. This segment's growth is intrinsically linked to the overall expansion of offshore E&P activities.
- Dominance Factors in Deep Water:
- Market Share: Deep water accounts for an estimated 60-65% of the global FPSO market in terms of value.
- Growth Potential: Significant untapped hydrocarbon reserves in ultra-deep and deep-water regions worldwide, especially in Asia Pacific, Africa, and the Americas.
- Technological Advancements: Continuous innovation in mooring systems, risers, and subsea infrastructure tailored for deep-water environments.
- Economic Viability: FPSOs are increasingly cost-competitive for developing marginal or stranded deep-water fields compared to traditional fixed platforms.
FPSO Market Product Landscape
The FPSO market product landscape is characterized by continuous innovation in vessel design, processing capabilities, and integration with subsea technologies. Modern FPSOs are increasingly modular, allowing for tailored configurations to meet specific field requirements and enhanced recovery targets. Innovations focus on improving topside processing efficiency, extending vessel lifespan, and incorporating advanced safety and environmental control systems. Unique selling propositions revolve around the ability to operate in remote and harsh environments, accommodate a wide range of production capacities, and offer extended operational periods with minimal downtime. Technological advancements include the development of larger hull capacities, sophisticated turret and mooring systems for extreme weather resilience, and the integration of digital twin technology for real-time monitoring and predictive maintenance. The performance metrics are constantly being optimized for higher production uptime, reduced environmental footprint, and improved safety standards.
Key Drivers, Barriers & Challenges in FPSO Market
Key Drivers:
- Technological Advancements: Innovations in subsea technology, digitalization, and floating production systems enhance efficiency and enable development of previously uneconomical fields.
- Growing Offshore Exploration: Increasing discoveries of oil and gas reserves in deep and ultra-deep water regions globally.
- Energy Security Demands: Nations are seeking to diversify energy sources and increase domestic production, driving offshore investment.
- Economic Viability of FPSOs: FPSOs offer cost-effective solutions for marginal fields and remote locations compared to fixed infrastructure.
Barriers & Challenges:
- High Capital Expenditure: The substantial upfront investment required for FPSO design, fabrication, and deployment poses a significant financial hurdle.
- Complex Project Execution: Long project lead times, intricate engineering, and global supply chain dependencies create execution complexities.
- Regulatory Hurdles: Evolving environmental regulations and safety standards can lead to project delays and increased compliance costs.
- Geopolitical Instability & Oil Price Volatility: Fluctuations in crude oil prices and geopolitical uncertainties can impact investment decisions and project timelines.
- Skilled Workforce Shortage: A global shortage of experienced engineers and skilled labor in the offshore sector can impede project execution.
- Supply Chain Disruptions: The global nature of FPSO projects makes them susceptible to disruptions in material sourcing and logistics, estimated to add 5-10% to project costs during periods of significant disruption.
Emerging Opportunities in FPSO Market
Emerging opportunities in the FPSO market lie in the development of FPSOs for emerging energy transition applications, such as carbon capture, utilization, and storage (CCUS) offshore facilities, and potentially for offshore hydrogen production. Untapped markets in regions with unexplored deep-water potential, such as parts of Africa and South America, present significant growth avenues. Evolving consumer preferences are pushing for more sustainable offshore operations, creating opportunities for FPSOs with reduced environmental footprints and enhanced energy efficiency. Furthermore, the increasing demand for FPSOs in smaller, marginal fields, which were previously uneconomical, represents a growing niche. The integration of advanced automation and remote monitoring systems is also creating opportunities for service providers offering specialized operational and maintenance solutions.
Growth Accelerators in the FPSO Market Industry
Several key catalysts are accelerating long-term growth in the FPSO market. Technological breakthroughs, such as the development of more resilient hull designs for extreme weather conditions and advancements in subsea processing capabilities, are expanding the operational envelope for FPSOs. Strategic partnerships between FPSO manufacturers, engineering, procurement, and construction (EPC) companies, and oil and gas operators are streamlining project execution and fostering innovation. Market expansion strategies, including the development of standardized FPSO designs for quicker deployment and the exploration of new geographical frontiers, are also significant growth drivers. The increasing focus on lifecycle asset management and the provision of integrated services from fabrication to decommissioning are further bolstering the market's growth trajectory.
Key Players Shaping the FPSO Market Market
- SBM Offshore NV
- Modec Inc
- BW Offshore Limited
- Bluewater Holding BV
- Teekay Offshore Partners LP
- Saipem SpA
- Petrofac Limited
- Shell PLC
- BP PLC
- Chevron Corporation
- TotalEnergies SE
- ExxonMobil Corp
- Petroleo Brasileiro SA (Petrobras)
- CNOOC Ltd
Notable Milestones in FPSO Market Sector
- May 2023: SBM Offshore and Esso Exploration & Production Guyana entered a 10-year Operations and Maintenance Enabling Agreement, tasking SBM Offshore with the operations and maintenance of four FPSOs: Liza Destiny, Liza Unity, Prosperity, and ONE GUYANA. This significant agreement underscores the growing trend of long-term operational partnerships and the critical role of FPSO operators in ensuring project success.
- April 2023: Shell resumed operations at the Pierce field in the United Kingdom Central North Sea following a major upgrade of the Haewene Brim FPSO. This upgrade enabled gas production, highlighting the adaptability and life-extension capabilities of existing FPSO assets through significant modifications and integration of new subsea infrastructure.
- April 2023: KBR secured an engineering contract for Equinor's Bay du Nord project in offshore Canada, valued at USD 9.4 billion. This contract, potentially covering detailed design and procurement management for the FPSO unit, signifies the robust pipeline of new FPSO projects and the significant value associated with their development.
In-Depth FPSO Market Market Outlook
The future outlook for the FPSO market remains exceptionally positive, driven by sustained global demand for oil and gas and the increasing necessity to tap into complex offshore reserves. Growth accelerators include ongoing technological advancements that enhance efficiency and safety, coupled with a strategic shift towards more sustainable offshore operations. The market is poised for expansion as companies increasingly adopt lifecycle asset management approaches and forge strategic partnerships to de-risk and optimize project execution. Exploration into new geographical frontiers and the development of standardized FPSO designs will further fuel market penetration and growth. The FPSO sector is set to play a pivotal role in meeting global energy needs while adapting to evolving environmental considerations and operational demands.
FPSO Market Segmentation
-
1. Ownership
- 1.1. Operator-owned
- 1.2. Contractor-owned
-
2. Water Depth
- 2.1. Shallow Water
- 2.2. Deep Water
- 2.3. Ultra-deep Water
FPSO Market Segmentation By Geography
-
1. North America
- 1.1. United States
- 1.2. Canada
- 1.3. Mexico
- 1.4. Rest of North America
-
2. Europe
- 2.1. Norway
- 2.2. United Kingdom
- 2.3. Russia
- 2.4. Netherland
- 2.5. France
- 2.6. Italy
- 2.7. NORDIC
- 2.8. Germany
- 2.9. Spain
- 2.10. Rest of Europe
-
3. Asia Pacific
- 3.1. China
- 3.2. India
- 3.3. Australia
- 3.4. Indonesia
- 3.5. Malaysia
- 3.6. Thailand
- 3.7. Japan
- 3.8. Vietnam
- 3.9. Rest of Asia Pacific
-
4. South America
- 4.1. Brazil
- 4.2. Argentina
- 4.3. Venezuela
- 4.4. Colombia
- 4.5. Rest of South America
-
5. Middle East and Africa
- 5.1. Saudi Arabia
- 5.2. United Arab Emirates
- 5.3. Nigeria
- 5.4. Algeria
- 5.5. Qatar
- 5.6. South Africa
- 5.7. Egypt
- 5.8. Rest of Middle East and Africa
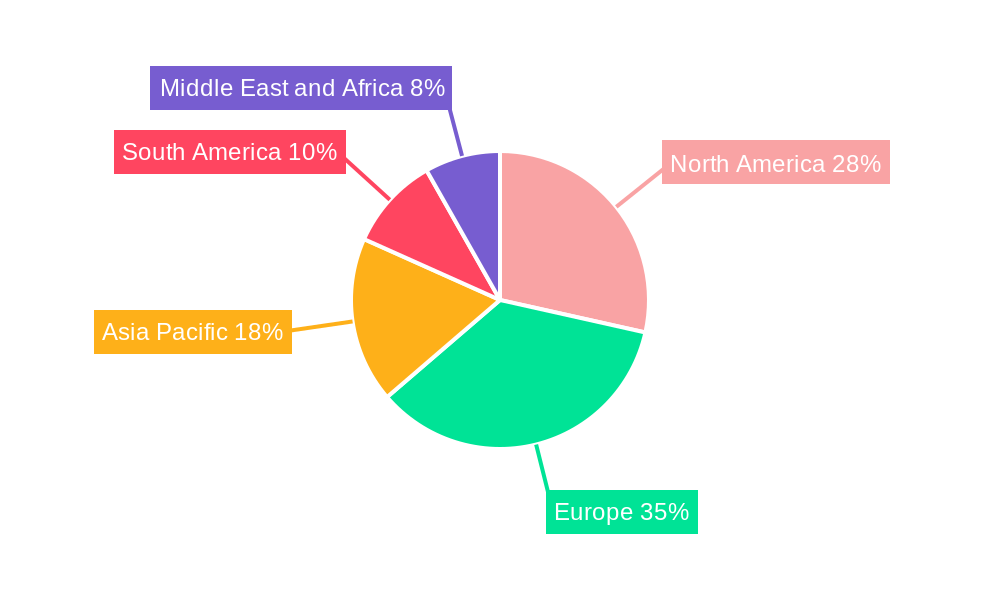
FPSO Market Regional Market Share
Geographic Coverage of FPSO Market
FPSO Market REPORT HIGHLIGHTS
| Aspects | Details |
|---|---|
| Study Period | 2020-2034 |
| Base Year | 2025 |
| Estimated Year | 2026 |
| Forecast Period | 2026-2034 |
| Historical Period | 2020-2025 |
| Growth Rate | CAGR of 8.50% from 2020-2034 |
| Segmentation |
|
Table of Contents
- 1. Introduction
- 1.1. Research Scope
- 1.2. Market Segmentation
- 1.3. Research Objective
- 1.4. Definitions and Assumptions
- 2. Executive Summary
- 2.1. Market Snapshot
- 3. Market Dynamics
- 3.1. Market Drivers
- 3.2. Market Restrains
- 3.3. Market Trends
- 3.4. Market Opportunities
- 4. Market Factor Analysis
- 4.1. Porters Five Forces
- 4.1.1. Bargaining Power of Suppliers
- 4.1.2. Bargaining Power of Buyers
- 4.1.3. Threat of New Entrants
- 4.1.4. Threat of Substitutes
- 4.1.5. Competitive Rivalry
- 4.2. PESTEL analysis
- 4.3. BCG Analysis
- 4.3.1. Stars (High Growth, High Market Share)
- 4.3.2. Cash Cows (Low Growth, High Market Share)
- 4.3.3. Question Mark (High Growth, Low Market Share)
- 4.3.4. Dogs (Low Growth, Low Market Share)
- 4.4. Ansoff Matrix Analysis
- 4.5. Supply Chain Analysis
- 4.6. Regulatory Landscape
- 4.7. Current Market Potential and Opportunity Assessment (TAM–SAM–SOM Framework)
- 4.8. VDR Analyst Note
- 4.1. Porters Five Forces
- 5. Market Analysis, Insights and Forecast 2021-2033
- 5.1. Market Analysis, Insights and Forecast - by Ownership
- 5.1.1. Operator-owned
- 5.1.2. Contractor-owned
- 5.2. Market Analysis, Insights and Forecast - by Water Depth
- 5.2.1. Shallow Water
- 5.2.2. Deep Water
- 5.2.3. Ultra-deep Water
- 5.3. Market Analysis, Insights and Forecast - by Region
- 5.3.1. North America
- 5.3.2. Europe
- 5.3.3. Asia Pacific
- 5.3.4. South America
- 5.3.5. Middle East and Africa
- 5.1. Market Analysis, Insights and Forecast - by Ownership
- 6. Global FPSO Market Analysis, Insights and Forecast, 2021-2033
- 6.1. Market Analysis, Insights and Forecast - by Ownership
- 6.1.1. Operator-owned
- 6.1.2. Contractor-owned
- 6.2. Market Analysis, Insights and Forecast - by Water Depth
- 6.2.1. Shallow Water
- 6.2.2. Deep Water
- 6.2.3. Ultra-deep Water
- 6.1. Market Analysis, Insights and Forecast - by Ownership
- 7. North America FPSO Market Analysis, Insights and Forecast, 2021-2033
- 7.1. Market Analysis, Insights and Forecast - by Ownership
- 7.1.1. Operator-owned
- 7.1.2. Contractor-owned
- 7.2. Market Analysis, Insights and Forecast - by Water Depth
- 7.2.1. Shallow Water
- 7.2.2. Deep Water
- 7.2.3. Ultra-deep Water
- 7.1. Market Analysis, Insights and Forecast - by Ownership
- 8. Europe FPSO Market Analysis, Insights and Forecast, 2021-2033
- 8.1. Market Analysis, Insights and Forecast - by Ownership
- 8.1.1. Operator-owned
- 8.1.2. Contractor-owned
- 8.2. Market Analysis, Insights and Forecast - by Water Depth
- 8.2.1. Shallow Water
- 8.2.2. Deep Water
- 8.2.3. Ultra-deep Water
- 8.1. Market Analysis, Insights and Forecast - by Ownership
- 9. Asia Pacific FPSO Market Analysis, Insights and Forecast, 2021-2033
- 9.1. Market Analysis, Insights and Forecast - by Ownership
- 9.1.1. Operator-owned
- 9.1.2. Contractor-owned
- 9.2. Market Analysis, Insights and Forecast - by Water Depth
- 9.2.1. Shallow Water
- 9.2.2. Deep Water
- 9.2.3. Ultra-deep Water
- 9.1. Market Analysis, Insights and Forecast - by Ownership
- 10. South America FPSO Market Analysis, Insights and Forecast, 2021-2033
- 10.1. Market Analysis, Insights and Forecast - by Ownership
- 10.1.1. Operator-owned
- 10.1.2. Contractor-owned
- 10.2. Market Analysis, Insights and Forecast - by Water Depth
- 10.2.1. Shallow Water
- 10.2.2. Deep Water
- 10.2.3. Ultra-deep Water
- 10.1. Market Analysis, Insights and Forecast - by Ownership
- 11. Middle East and Africa FPSO Market Analysis, Insights and Forecast, 2021-2033
- 11.1. Market Analysis, Insights and Forecast - by Ownership
- 11.1.1. Operator-owned
- 11.1.2. Contractor-owned
- 11.2. Market Analysis, Insights and Forecast - by Water Depth
- 11.2.1. Shallow Water
- 11.2.2. Deep Water
- 11.2.3. Ultra-deep Water
- 11.1. Market Analysis, Insights and Forecast - by Ownership
- 12. Competitive Analysis
- 12.1. Company Profiles
- 12.1.1 6 Shell PLC
- 12.1.1.1. Company Overview
- 12.1.1.2. Products
- 12.1.1.3. Company Financials
- 12.1.1.4. SWOT Analysis
- 12.1.2 5 Bluewater Holding BV
- 12.1.2.1. Company Overview
- 12.1.2.2. Products
- 12.1.2.3. Company Financials
- 12.1.2.4. SWOT Analysis
- 12.1.3 6 Saipem SpA
- 12.1.3.1. Company Overview
- 12.1.3.2. Products
- 12.1.3.3. Company Financials
- 12.1.3.4. SWOT Analysis
- 12.1.4 7 BP PLC*List Not Exhaustive
- 12.1.4.1. Company Overview
- 12.1.4.2. Products
- 12.1.4.3. Company Financials
- 12.1.4.4. SWOT Analysis
- 12.1.5 1 Petroleo Brasileiro SA (Petrobras)
- 12.1.5.1. Company Overview
- 12.1.5.2. Products
- 12.1.5.3. Company Financials
- 12.1.5.4. SWOT Analysis
- 12.1.6 4 Teekay Offshore Partners LP
- 12.1.6.1. Company Overview
- 12.1.6.2. Products
- 12.1.6.3. Company Financials
- 12.1.6.4. SWOT Analysis
- 12.1.7 5 Chevron Corporation
- 12.1.7.1. Company Overview
- 12.1.7.2. Products
- 12.1.7.3. Company Financials
- 12.1.7.4. SWOT Analysis
- 12.1.8 3 TotalEnergies SE
- 12.1.8.1. Company Overview
- 12.1.8.2. Products
- 12.1.8.3. Company Financials
- 12.1.8.4. SWOT Analysis
- 12.1.9 7 Petrofac Limited
- 12.1.9.1. Company Overview
- 12.1.9.2. Products
- 12.1.9.3. Company Financials
- 12.1.9.4. SWOT Analysis
- 12.1.10 4 ExxonMobil Corp
- 12.1.10.1. Company Overview
- 12.1.10.2. Products
- 12.1.10.3. Company Financials
- 12.1.10.4. SWOT Analysis
- 12.1.11 1 Modec Inc
- 12.1.11.1. Company Overview
- 12.1.11.2. Products
- 12.1.11.3. Company Financials
- 12.1.11.4. SWOT Analysis
- 12.1.12 3 BW Offshore Limited
- 12.1.12.1. Company Overview
- 12.1.12.2. Products
- 12.1.12.3. Company Financials
- 12.1.12.4. SWOT Analysis
- 12.1.13 FPSO Operators
- 12.1.13.1. Company Overview
- 12.1.13.2. Products
- 12.1.13.3. Company Financials
- 12.1.13.4. SWOT Analysis
- 12.1.14 2 SBM Offshore NV
- 12.1.14.1. Company Overview
- 12.1.14.2. Products
- 12.1.14.3. Company Financials
- 12.1.14.4. SWOT Analysis
- 12.1.15 2 CNOOC Ltd
- 12.1.15.1. Company Overview
- 12.1.15.2. Products
- 12.1.15.3. Company Financials
- 12.1.15.4. SWOT Analysis
- 12.1.16 FPSO Contractors
- 12.1.16.1. Company Overview
- 12.1.16.2. Products
- 12.1.16.3. Company Financials
- 12.1.16.4. SWOT Analysis
- 12.1.1 6 Shell PLC
- 12.2. Market Entropy
- 12.2.1 Company's Key Areas Served
- 12.2.2 Recent Developments
- 12.3. Company Market Share Analysis 2025
- 12.3.1 Top 5 Companies Market Share Analysis
- 12.3.2 Top 3 Companies Market Share Analysis
- 12.4. List of Potential Customers
- 13. Research Methodology
List of Figures
- Figure 1: Global FPSO Market Revenue Breakdown (Million, %) by Region 2025 & 2033
- Figure 2: North America FPSO Market Revenue (Million), by Ownership 2025 & 2033
- Figure 3: North America FPSO Market Revenue Share (%), by Ownership 2025 & 2033
- Figure 4: North America FPSO Market Revenue (Million), by Water Depth 2025 & 2033
- Figure 5: North America FPSO Market Revenue Share (%), by Water Depth 2025 & 2033
- Figure 6: North America FPSO Market Revenue (Million), by Country 2025 & 2033
- Figure 7: North America FPSO Market Revenue Share (%), by Country 2025 & 2033
- Figure 8: Europe FPSO Market Revenue (Million), by Ownership 2025 & 2033
- Figure 9: Europe FPSO Market Revenue Share (%), by Ownership 2025 & 2033
- Figure 10: Europe FPSO Market Revenue (Million), by Water Depth 2025 & 2033
- Figure 11: Europe FPSO Market Revenue Share (%), by Water Depth 2025 & 2033
- Figure 12: Europe FPSO Market Revenue (Million), by Country 2025 & 2033
- Figure 13: Europe FPSO Market Revenue Share (%), by Country 2025 & 2033
- Figure 14: Asia Pacific FPSO Market Revenue (Million), by Ownership 2025 & 2033
- Figure 15: Asia Pacific FPSO Market Revenue Share (%), by Ownership 2025 & 2033
- Figure 16: Asia Pacific FPSO Market Revenue (Million), by Water Depth 2025 & 2033
- Figure 17: Asia Pacific FPSO Market Revenue Share (%), by Water Depth 2025 & 2033
- Figure 18: Asia Pacific FPSO Market Revenue (Million), by Country 2025 & 2033
- Figure 19: Asia Pacific FPSO Market Revenue Share (%), by Country 2025 & 2033
- Figure 20: South America FPSO Market Revenue (Million), by Ownership 2025 & 2033
- Figure 21: South America FPSO Market Revenue Share (%), by Ownership 2025 & 2033
- Figure 22: South America FPSO Market Revenue (Million), by Water Depth 2025 & 2033
- Figure 23: South America FPSO Market Revenue Share (%), by Water Depth 2025 & 2033
- Figure 24: South America FPSO Market Revenue (Million), by Country 2025 & 2033
- Figure 25: South America FPSO Market Revenue Share (%), by Country 2025 & 2033
- Figure 26: Middle East and Africa FPSO Market Revenue (Million), by Ownership 2025 & 2033
- Figure 27: Middle East and Africa FPSO Market Revenue Share (%), by Ownership 2025 & 2033
- Figure 28: Middle East and Africa FPSO Market Revenue (Million), by Water Depth 2025 & 2033
- Figure 29: Middle East and Africa FPSO Market Revenue Share (%), by Water Depth 2025 & 2033
- Figure 30: Middle East and Africa FPSO Market Revenue (Million), by Country 2025 & 2033
- Figure 31: Middle East and Africa FPSO Market Revenue Share (%), by Country 2025 & 2033
List of Tables
- Table 1: Global FPSO Market Revenue Million Forecast, by Ownership 2020 & 2033
- Table 2: Global FPSO Market Revenue Million Forecast, by Water Depth 2020 & 2033
- Table 3: Global FPSO Market Revenue Million Forecast, by Region 2020 & 2033
- Table 4: Global FPSO Market Revenue Million Forecast, by Ownership 2020 & 2033
- Table 5: Global FPSO Market Revenue Million Forecast, by Water Depth 2020 & 2033
- Table 6: Global FPSO Market Revenue Million Forecast, by Country 2020 & 2033
- Table 7: United States FPSO Market Revenue (Million) Forecast, by Application 2020 & 2033
- Table 8: Canada FPSO Market Revenue (Million) Forecast, by Application 2020 & 2033
- Table 9: Mexico FPSO Market Revenue (Million) Forecast, by Application 2020 & 2033
- Table 10: Rest of North America FPSO Market Revenue (Million) Forecast, by Application 2020 & 2033
- Table 11: Global FPSO Market Revenue Million Forecast, by Ownership 2020 & 2033
- Table 12: Global FPSO Market Revenue Million Forecast, by Water Depth 2020 & 2033
- Table 13: Global FPSO Market Revenue Million Forecast, by Country 2020 & 2033
- Table 14: Norway FPSO Market Revenue (Million) Forecast, by Application 2020 & 2033
- Table 15: United Kingdom FPSO Market Revenue (Million) Forecast, by Application 2020 & 2033
- Table 16: Russia FPSO Market Revenue (Million) Forecast, by Application 2020 & 2033
- Table 17: Netherland FPSO Market Revenue (Million) Forecast, by Application 2020 & 2033
- Table 18: France FPSO Market Revenue (Million) Forecast, by Application 2020 & 2033
- Table 19: Italy FPSO Market Revenue (Million) Forecast, by Application 2020 & 2033
- Table 20: NORDIC FPSO Market Revenue (Million) Forecast, by Application 2020 & 2033
- Table 21: Germany FPSO Market Revenue (Million) Forecast, by Application 2020 & 2033
- Table 22: Spain FPSO Market Revenue (Million) Forecast, by Application 2020 & 2033
- Table 23: Rest of Europe FPSO Market Revenue (Million) Forecast, by Application 2020 & 2033
- Table 24: Global FPSO Market Revenue Million Forecast, by Ownership 2020 & 2033
- Table 25: Global FPSO Market Revenue Million Forecast, by Water Depth 2020 & 2033
- Table 26: Global FPSO Market Revenue Million Forecast, by Country 2020 & 2033
- Table 27: China FPSO Market Revenue (Million) Forecast, by Application 2020 & 2033
- Table 28: India FPSO Market Revenue (Million) Forecast, by Application 2020 & 2033
- Table 29: Australia FPSO Market Revenue (Million) Forecast, by Application 2020 & 2033
- Table 30: Indonesia FPSO Market Revenue (Million) Forecast, by Application 2020 & 2033
- Table 31: Malaysia FPSO Market Revenue (Million) Forecast, by Application 2020 & 2033
- Table 32: Thailand FPSO Market Revenue (Million) Forecast, by Application 2020 & 2033
- Table 33: Japan FPSO Market Revenue (Million) Forecast, by Application 2020 & 2033
- Table 34: Vietnam FPSO Market Revenue (Million) Forecast, by Application 2020 & 2033
- Table 35: Rest of Asia Pacific FPSO Market Revenue (Million) Forecast, by Application 2020 & 2033
- Table 36: Global FPSO Market Revenue Million Forecast, by Ownership 2020 & 2033
- Table 37: Global FPSO Market Revenue Million Forecast, by Water Depth 2020 & 2033
- Table 38: Global FPSO Market Revenue Million Forecast, by Country 2020 & 2033
- Table 39: Brazil FPSO Market Revenue (Million) Forecast, by Application 2020 & 2033
- Table 40: Argentina FPSO Market Revenue (Million) Forecast, by Application 2020 & 2033
- Table 41: Venezuela FPSO Market Revenue (Million) Forecast, by Application 2020 & 2033
- Table 42: Colombia FPSO Market Revenue (Million) Forecast, by Application 2020 & 2033
- Table 43: Rest of South America FPSO Market Revenue (Million) Forecast, by Application 2020 & 2033
- Table 44: Global FPSO Market Revenue Million Forecast, by Ownership 2020 & 2033
- Table 45: Global FPSO Market Revenue Million Forecast, by Water Depth 2020 & 2033
- Table 46: Global FPSO Market Revenue Million Forecast, by Country 2020 & 2033
- Table 47: Saudi Arabia FPSO Market Revenue (Million) Forecast, by Application 2020 & 2033
- Table 48: United Arab Emirates FPSO Market Revenue (Million) Forecast, by Application 2020 & 2033
- Table 49: Nigeria FPSO Market Revenue (Million) Forecast, by Application 2020 & 2033
- Table 50: Algeria FPSO Market Revenue (Million) Forecast, by Application 2020 & 2033
- Table 51: Qatar FPSO Market Revenue (Million) Forecast, by Application 2020 & 2033
- Table 52: South Africa FPSO Market Revenue (Million) Forecast, by Application 2020 & 2033
- Table 53: Egypt FPSO Market Revenue (Million) Forecast, by Application 2020 & 2033
- Table 54: Rest of Middle East and Africa FPSO Market Revenue (Million) Forecast, by Application 2020 & 2033
Frequently Asked Questions
1. What is the projected Compound Annual Growth Rate (CAGR) of the FPSO Market?
The projected CAGR is approximately 8.50%.
2. Which companies are prominent players in the FPSO Market?
Key companies in the market include 6 Shell PLC, 5 Bluewater Holding BV, 6 Saipem SpA, 7 BP PLC*List Not Exhaustive, 1 Petroleo Brasileiro SA (Petrobras), 4 Teekay Offshore Partners LP, 5 Chevron Corporation, 3 TotalEnergies SE, 7 Petrofac Limited, 4 ExxonMobil Corp, 1 Modec Inc, 3 BW Offshore Limited, FPSO Operators, 2 SBM Offshore NV, 2 CNOOC Ltd, FPSO Contractors.
3. What are the main segments of the FPSO Market?
The market segments include Ownership, Water Depth.
4. Can you provide details about the market size?
The market size is estimated to be USD 12.04 Million as of 2022.
5. What are some drivers contributing to market growth?
4.; Increasing Offshore Oil and Gas Exploration and Production Activities4.; Growing Demand for Energy.
6. What are the notable trends driving market growth?
Contractor-owned FPSO Expected to Dominate the Market.
7. Are there any restraints impacting market growth?
4.; High Upfront Costs.
8. Can you provide examples of recent developments in the market?
May 2023: SBM Offshore and Esso Exploration & Production Guyana entered a 10-year Operations and Maintenance Enabling Agreement. The agreement entails SBM Offshore being responsible for the operations and maintenance of four FPSOs: Liza Destiny, Liza Unity, Prosperity, and ONE GUYANA.
9. What pricing options are available for accessing the report?
Pricing options include single-user, multi-user, and enterprise licenses priced at USD 4750, USD 5250, and USD 8750 respectively.
10. Is the market size provided in terms of value or volume?
The market size is provided in terms of value, measured in Million.
11. Are there any specific market keywords associated with the report?
Yes, the market keyword associated with the report is "FPSO Market," which aids in identifying and referencing the specific market segment covered.
12. How do I determine which pricing option suits my needs best?
The pricing options vary based on user requirements and access needs. Individual users may opt for single-user licenses, while businesses requiring broader access may choose multi-user or enterprise licenses for cost-effective access to the report.
13. Are there any additional resources or data provided in the FPSO Market report?
While the report offers comprehensive insights, it's advisable to review the specific contents or supplementary materials provided to ascertain if additional resources or data are available.
14. How can I stay updated on further developments or reports in the FPSO Market?
To stay informed about further developments, trends, and reports in the FPSO Market, consider subscribing to industry newsletters, following relevant companies and organizations, or regularly checking reputable industry news sources and publications.
Methodology
Step 1 - Identification of Relevant Samples Size from Population Database


Step 2 - Approaches for Defining Global Market Size (Value, Volume* & Price*)

Note*: In applicable scenarios
Step 3 - Data Sources
Primary Research
- Web Analytics
- Survey Reports
- Research Institute
- Latest Research Reports
- Opinion Leaders
Secondary Research
- Annual Reports
- White Paper
- Latest Press Release
- Industry Association
- Paid Database
- Investor Presentations

Step 4 - Data Triangulation
Involves using different sources of information in order to increase the validity of a study
These sources are likely to be stakeholders in a program - participants, other researchers, program staff, other community members, and so on.
Then we put all data in single framework & apply various statistical tools to find out the dynamic on the market.
During the analysis stage, feedback from the stakeholder groups would be compared to determine areas of agreement as well as areas of divergence