

Key Insights
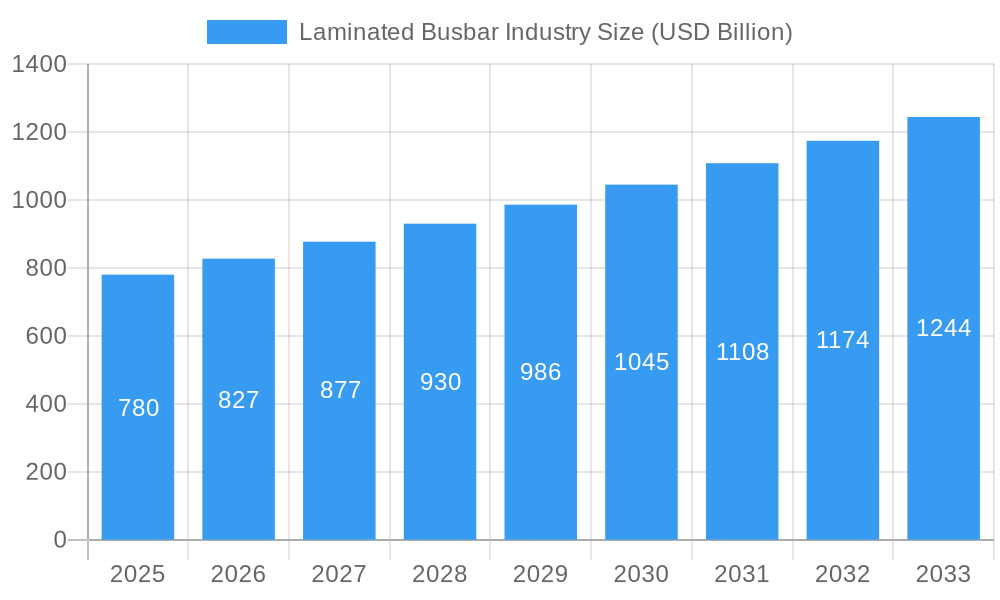
The global laminated busbar market is poised for robust expansion, currently valued at an estimated $0.78 billion in 2025. This growth is fueled by an impressive Compound Annual Growth Rate (CAGR) of 6.02%, projecting a significant upward trajectory through 2033. The increasing demand for efficient and compact power distribution solutions across various sectors, including power utilities, industrial applications, and the burgeoning transportation electrification, are key drivers. Advancements in insulation materials, such as enhanced epoxy powder coatings and sophisticated heat-resistant fibers, are enabling higher current densities and improved thermal management, thus boosting the adoption of laminated busbars. Furthermore, the growing emphasis on miniaturization and space optimization in electrical systems within residential and commercial buildings also contributes to market momentum.
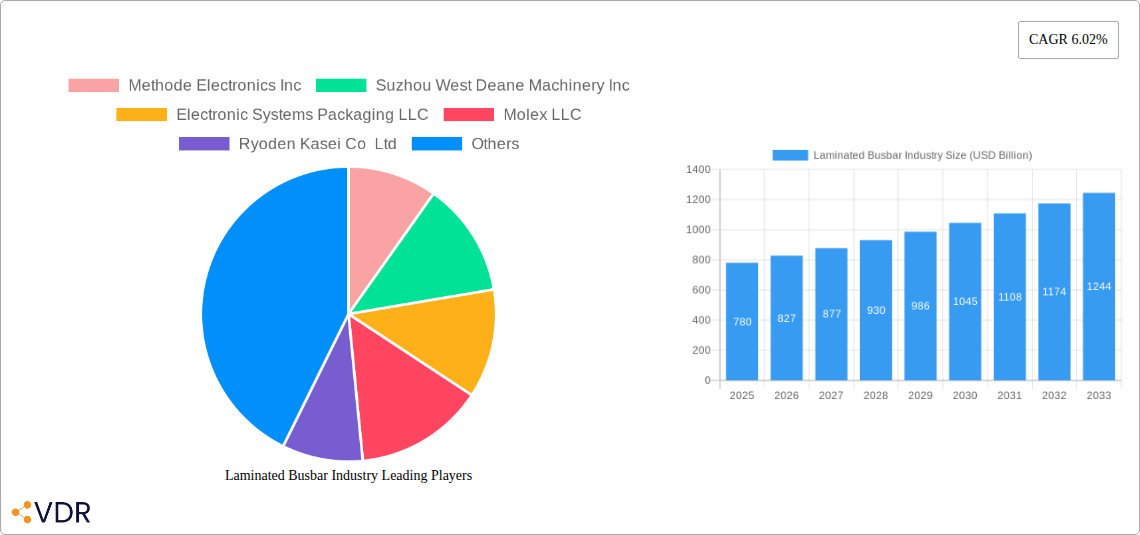
Laminated Busbar Industry Market Size (In Million)
The laminated busbar industry is characterized by a dynamic competitive landscape with prominent players like Methode Electronics Inc., Molex LLC, and Eaton Corporation PLC spearheading innovation. Emerging trends point towards the development of higher voltage and higher current capacity busbars, alongside the integration of smart functionalities for real-time monitoring and control. While the market exhibits strong growth potential, certain restraints such as the initial cost of specialized manufacturing processes and the need for skilled labor in installation and maintenance could pose challenges. However, the overarching trend of electrification and the persistent need for reliable and efficient power transmission are expected to outweigh these limitations, ensuring sustained market growth. The Asia Pacific region is anticipated to be a dominant force, driven by rapid industrialization and significant investments in power infrastructure.
Laminated Busbar Industry Company Market Share
Laminated Busbar Industry: Comprehensive Market Analysis, Trends, and Forecast (2019-2033)
This in-depth report delivers a strategic overview of the global Laminated Busbar industry, meticulously analyzing market dynamics, growth trajectories, and competitive landscapes. Covering parent and child market segments, this research provides actionable insights for stakeholders navigating the evolving needs of power distribution and electronic systems. With a focus on high-traffic keywords such as "laminated busbar," "busbar market," "electrical components," "power distribution solutions," and "industrial electrification," this report is optimized for maximum search engine visibility. Discover key growth drivers, emerging opportunities, and the strategic positioning of leading companies from 2019 to 2033, with a base year of 2025 and a forecast period from 2025 to 2033.
Laminated Busbar Industry Market Dynamics & Structure
The global laminated busbar market exhibits a moderately concentrated structure, driven by a blend of established players and emerging innovators. Technological innovation is a significant driver, with continuous advancements in insulation materials and manufacturing processes enhancing performance and cost-effectiveness. Regulatory frameworks, particularly those focused on electrical safety and energy efficiency standards, play a crucial role in shaping product development and adoption. Competitive product substitutes, such as traditional wiring and flexible busbars, present ongoing challenges, necessitating continuous differentiation through superior electrical performance and integrated functionalities. End-user demographics are increasingly sophisticated, demanding tailored solutions for diverse applications ranging from heavy industrial machinery to advanced transportation systems and residential smart grids. Mergers and acquisitions (M&A) trends indicate strategic consolidation, with larger entities acquiring specialized capabilities to expand their product portfolios and market reach. For instance, the acquisition of smaller, innovative firms by major electrical component manufacturers is a recurring theme, bolstering market share and technological prowess. Innovation barriers include the high capital investment required for advanced manufacturing facilities and the stringent certification processes for new electrical products.
- Market Concentration: Moderately concentrated with key players dominating market share.
- Technological Innovation Drivers: Advancements in insulation materials, miniaturization, and increased current carrying capacity.
- Regulatory Frameworks: Strict safety standards and growing emphasis on energy efficiency in electrical systems.
- Competitive Product Substitutes: Traditional wiring, flexible busbars, and cable assemblies.
- End-User Demographics: Diverse needs from industrial automation to renewable energy integration and electric vehicles.
- M&A Trends: Strategic acquisitions aimed at expanding product lines and technological expertise.
- Innovation Barriers: High R&D costs, complex certification processes, and long product development cycles.
Laminated Busbar Industry Growth Trends & Insights
The laminated busbar industry is poised for significant expansion, projected to grow at a compound annual growth rate (CAGR) of approximately 7.5% from 2025 to 2033. This robust growth is propelled by the escalating demand for efficient and reliable power distribution solutions across various end-user segments. Market size is estimated to reach USD 18.2 Billion by 2033, up from an estimated USD 10.5 Billion in 2025. Adoption rates are accelerating, particularly within the industrial and transportation sectors, as they increasingly embrace electrification and advanced automation. Technological disruptions are a key factor, with innovations in materials science leading to lighter, more durable, and higher-performing laminated busbars. For example, the development of advanced composite insulation materials enhances thermal management and electrical isolation, enabling higher current densities and smaller form factors. Consumer behavior shifts are also influencing market dynamics, with a growing preference for integrated, compact, and aesthetically pleasing electrical solutions. The push towards smart grids and the proliferation of electric vehicles (EVs) are creating substantial new avenues for growth, demanding innovative busbar designs that can handle high power densities and stringent safety requirements. Historical data from 2019-2024 indicates a steady upward trajectory, reflecting the foundational demand from traditional power infrastructure and the nascent stages of advanced applications. The estimated market size in 2019 was USD 7.1 Billion, and by 2024, it is projected to reach USD 9.8 Billion. This consistent growth underscores the indispensable role of laminated busbars in modern electrical systems. The increasing integration of renewable energy sources also contributes significantly, as these systems often require complex and high-capacity power distribution networks where laminated busbars offer a superior solution compared to conventional cabling.
Dominant Regions, Countries, or Segments in Laminated Busbar Industry
The Industrial end-user segment is emerging as the dominant force in the global laminated busbar market, projected to account for over 35% of the market share by 2033. This segment's growth is fueled by the relentless drive for automation, digitalization, and energy efficiency in manufacturing plants, data centers, and industrial facilities worldwide. Key drivers within this segment include significant capital investments in smart factories and the increasing demand for high-density power distribution in complex machinery and control systems. Economic policies supporting industrial modernization and infrastructure development in emerging economies further bolster this trend.
Asia Pacific, particularly China, is identified as the leading region, driven by its vast manufacturing base, rapid industrialization, and substantial investments in power infrastructure. The country's commitment to renewable energy expansion and the burgeoning electric vehicle market are significant accelerators for laminated busbar demand. Government initiatives promoting energy efficiency and technological upgrades in industrial sectors further solidify its dominance.
Within the Material segment, Copper continues to be the preferred choice due to its superior electrical conductivity and reliability, holding an estimated 65% market share. However, Aluminum is gaining traction as a cost-effective and lighter alternative, especially for applications where weight reduction is critical. The Insulation Material landscape is diverse, with Epoxy Powder Coating and Polyester being widely adopted for their excellent dielectric properties and thermal resistance. The growing demand for high-performance solutions in demanding environments is also driving the adoption of advanced insulation materials like Heat-Resistant Fiber.
- Dominant End-User Segment: Industrial, driven by automation and smart manufacturing.
- Leading Region: Asia Pacific, with China at the forefront due to its manufacturing prowess and infrastructure development.
- Dominant Material: Copper, favored for its conductivity, with Aluminum as a growing alternative.
- Key Insulation Materials: Epoxy Powder Coating and Polyester, with increasing use of Heat-Resistant Fiber for high-performance applications.
- Growth Potential: High in industrial automation, data centers, renewable energy integration, and electric vehicle infrastructure.
- Market Share Influence: Economic policies, government subsidies for industrial upgrades, and technological adoption rates.
Laminated Busbar Industry Product Landscape
The laminated busbar industry is characterized by continuous product innovation focused on enhancing performance, reliability, and integration capabilities. Manufacturers are developing compact, high-density busbar systems capable of handling increased current loads with improved thermal management. Applications span across critical sectors, including electric vehicles (EVs), renewable energy systems, industrial automation, and advanced power distribution units. Unique selling propositions often revolve around superior electrical efficiency, reduced electromagnetic interference (EMI), enhanced safety features, and simplified installation. Technological advancements include the use of advanced insulation materials, sophisticated plating techniques, and integrated sensing capabilities for real-time monitoring of voltage and temperature. These innovations allow for smaller, lighter, and more robust electrical interconnections, meeting the evolving demands of modern technological applications.
Key Drivers, Barriers & Challenges in Laminated Busbar Industry
Key Drivers:
The laminated busbar industry is propelled by several critical factors. The escalating global demand for electricity, driven by population growth and industrialization, necessitates more efficient and reliable power distribution infrastructure. The rapid expansion of renewable energy sources, such as solar and wind power, which require robust interconnection solutions, is a significant growth catalyst. Furthermore, the burgeoning electric vehicle (EV) market is a major driver, demanding high-performance busbars for battery packs, charging infrastructure, and power electronics. Advancements in material science, leading to improved insulation and conductivity, enable the development of lighter, smaller, and more efficient busbar systems. Government initiatives promoting energy efficiency and electrification further stimulate market growth.
Barriers & Challenges:
Despite the positive outlook, the industry faces several challenges. The high initial cost of advanced manufacturing equipment and R&D investments can be a barrier to entry for smaller players. Fluctuations in raw material prices, particularly for copper and aluminum, can impact profit margins and product pricing. Stringent regulatory requirements and certification processes for electrical components can lead to extended product development timelines. Intense competition from traditional wiring solutions and other busbar technologies also presents a challenge, requiring continuous innovation and cost optimization. Supply chain disruptions, as witnessed in recent global events, can affect the availability of essential raw materials and components, leading to production delays and increased costs.
Emerging Opportunities in Laminated Busbar Industry
Emerging opportunities within the laminated busbar industry are centered around several key areas. The continued growth of the electric vehicle (EV) sector presents a massive opportunity for specialized, high-voltage busbar solutions for battery management systems and power electronics. The expansion of smart grid technologies and the integration of decentralized energy resources (DERs) are creating demand for modular and intelligent busbar systems. Furthermore, the aerospace and defense sectors, with their stringent requirements for lightweight and highly reliable electrical interconnections, offer untapped potential. The increasing focus on miniaturization in consumer electronics and industrial control systems also opens doors for compact, high-performance laminated busbars. Opportunities also lie in developing more sustainable and recyclable busbar materials and manufacturing processes.
Growth Accelerators in the Laminated Busbar Industry Industry
Several factors are accelerating the growth of the laminated busbar industry. Technological breakthroughs in advanced composite materials are enabling the creation of busbars with superior thermal conductivity and electrical insulation, allowing for higher power densities and reduced size. Strategic partnerships between busbar manufacturers and key players in the automotive, renewable energy, and electronics sectors are fostering co-development and market penetration. Market expansion strategies, including geographical diversification into high-growth emerging economies, are crucial for sustained growth. The increasing adoption of additive manufacturing (3D printing) techniques in busbar production is also a potential accelerator, offering greater design flexibility and on-demand manufacturing capabilities. Investments in research and development focused on enhancing safety features and reducing the overall cost of ownership for laminated busbar solutions are vital for long-term growth.
Key Players Shaping the Laminated Busbar Industry Market
- Methode Electronics Inc
- Suzhou West Deane Machinery Inc
- Electronic Systems Packaging LLC
- Molex LLC
- Ryoden Kasei Co Ltd
- Rogers Corporation
- Shanghai Eagtop Electronic Technology Co Ltd
- Eaton Corporation PLC
- Amphenol Corporation
- Segue Electronics Inc
- Zhejiang RHI ELectric Co Ltd
- Mersen SA
- Zhuzhou CRRC Times Electric Co Ltd
- Sun King Power Electronics Group Ltd
- Raychem RPG Private Limited
- EMS Industrial & Service Company
- Storm Power Components
Notable Milestones in Laminated Busbar Industry Sector
- February 2020: ABB Ltd planned to introduce laminated bus plate technology for low-voltage switchgear, aiming for highest reliability, better efficiency, maximum safety, more flexibility, and measurable return on investment (ROI) with the ABB Ability platform.
- March 2020: BRAR announced the successful completion of factory cold tests of busbars and Aluminium Power Conducting Arms for SMS Group.
In-Depth Laminated Busbar Industry Market Outlook
The laminated busbar industry is on a trajectory of sustained and robust growth, driven by pervasive electrification trends and technological advancements. The outlook is highly positive, fueled by the insatiable demand from the electric vehicle (EV) sector, which is rapidly adopting laminated busbars for their high power density and safety features. The continued expansion of renewable energy infrastructure, coupled with the modernization of industrial power systems and the proliferation of data centers, further solidifies this growth. Strategic opportunities lie in developing customized solutions for emerging applications such as advanced battery energy storage systems (BESS) and high-speed rail. Manufacturers focusing on sustainable materials and energy-efficient designs are well-positioned to capture significant market share. Collaborative efforts between industry players and end-users to address specific application challenges will be critical in unlocking the full potential of this dynamic market. The predicted market size of USD 18.2 Billion by 2033 highlights the immense future potential and strategic importance of the laminated busbar industry.
Laminated Busbar Industry Segmentation
-
1. Material
- 1.1. Aluminum
- 1.2. Copper
-
2. Insulation Material
- 2.1. Epoxy Powder Coating
- 2.2. Polyvinyl Fluoride Film
- 2.3. Polyester
- 2.4. Heat-Resistant Fiber
- 2.5. Other Insulation Materials
-
3. End-User
- 3.1. Power Utilities
- 3.2. Industrial
- 3.3. Transportation
- 3.4. Residential and Commercial
Laminated Busbar Industry Segmentation By Geography
- 1. North America
- 2. Europe
- 3. Asia Pacific
- 4. South America
- 5. Middle East
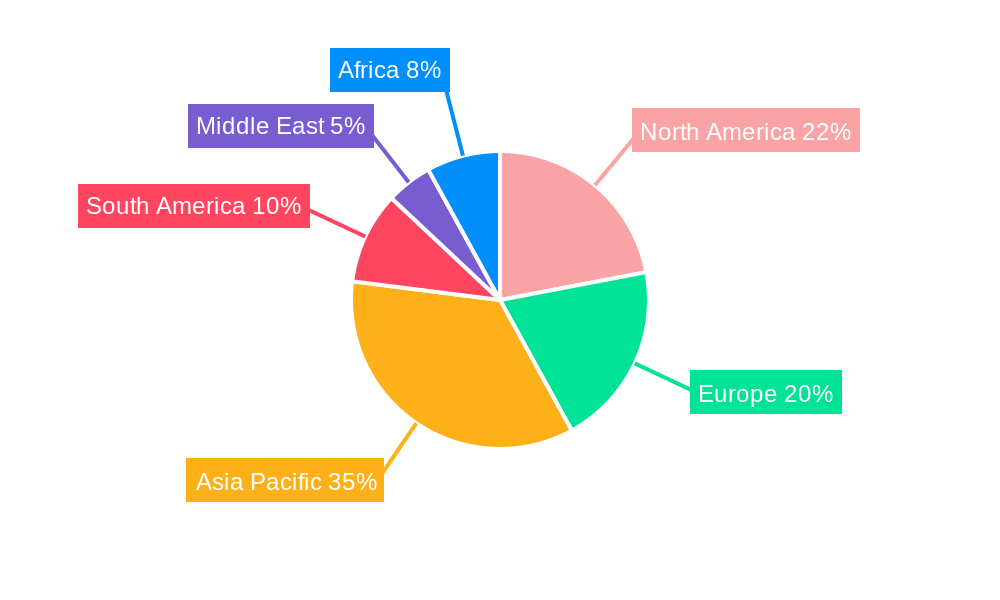
Laminated Busbar Industry Regional Market Share
Geographic Coverage of Laminated Busbar Industry
Laminated Busbar Industry REPORT HIGHLIGHTS
| Aspects | Details |
|---|---|
| Study Period | 2020-2034 |
| Base Year | 2025 |
| Estimated Year | 2026 |
| Forecast Period | 2026-2034 |
| Historical Period | 2020-2025 |
| Growth Rate | CAGR of 6.02% from 2020-2034 |
| Segmentation |
|
Table of Contents
- 1. Introduction
- 1.1. Research Scope
- 1.2. Market Segmentation
- 1.3. Research Objective
- 1.4. Definitions and Assumptions
- 2. Executive Summary
- 2.1. Market Snapshot
- 3. Market Dynamics
- 3.1. Market Drivers
- 3.2. Market Restrains
- 3.3. Market Trends
- 3.4. Market Opportunities
- 4. Market Factor Analysis
- 4.1. Porters Five Forces
- 4.1.1. Bargaining Power of Suppliers
- 4.1.2. Bargaining Power of Buyers
- 4.1.3. Threat of New Entrants
- 4.1.4. Threat of Substitutes
- 4.1.5. Competitive Rivalry
- 4.2. PESTEL analysis
- 4.3. BCG Analysis
- 4.3.1. Stars (High Growth, High Market Share)
- 4.3.2. Cash Cows (Low Growth, High Market Share)
- 4.3.3. Question Mark (High Growth, Low Market Share)
- 4.3.4. Dogs (Low Growth, Low Market Share)
- 4.4. Ansoff Matrix Analysis
- 4.5. Supply Chain Analysis
- 4.6. Regulatory Landscape
- 4.7. Current Market Potential and Opportunity Assessment (TAM–SAM–SOM Framework)
- 4.8. VDR Analyst Note
- 4.1. Porters Five Forces
- 5. Market Analysis, Insights and Forecast 2021-2033
- 5.1. Market Analysis, Insights and Forecast - by Material
- 5.1.1. Aluminum
- 5.1.2. Copper
- 5.2. Market Analysis, Insights and Forecast - by Insulation Material
- 5.2.1. Epoxy Powder Coating
- 5.2.2. Polyvinyl Fluoride Film
- 5.2.3. Polyester
- 5.2.4. Heat-Resistant Fiber
- 5.2.5. Other Insulation Materials
- 5.3. Market Analysis, Insights and Forecast - by End-User
- 5.3.1. Power Utilities
- 5.3.2. Industrial
- 5.3.3. Transportation
- 5.3.4. Residential and Commercial
- 5.4. Market Analysis, Insights and Forecast - by Region
- 5.4.1. North America
- 5.4.2. Europe
- 5.4.3. Asia Pacific
- 5.4.4. South America
- 5.4.5. Middle East
- 5.1. Market Analysis, Insights and Forecast - by Material
- 6. Global Laminated Busbar Industry Analysis, Insights and Forecast, 2021-2033
- 6.1. Market Analysis, Insights and Forecast - by Material
- 6.1.1. Aluminum
- 6.1.2. Copper
- 6.2. Market Analysis, Insights and Forecast - by Insulation Material
- 6.2.1. Epoxy Powder Coating
- 6.2.2. Polyvinyl Fluoride Film
- 6.2.3. Polyester
- 6.2.4. Heat-Resistant Fiber
- 6.2.5. Other Insulation Materials
- 6.3. Market Analysis, Insights and Forecast - by End-User
- 6.3.1. Power Utilities
- 6.3.2. Industrial
- 6.3.3. Transportation
- 6.3.4. Residential and Commercial
- 6.1. Market Analysis, Insights and Forecast - by Material
- 7. North America Laminated Busbar Industry Analysis, Insights and Forecast, 2021-2033
- 7.1. Market Analysis, Insights and Forecast - by Material
- 7.1.1. Aluminum
- 7.1.2. Copper
- 7.2. Market Analysis, Insights and Forecast - by Insulation Material
- 7.2.1. Epoxy Powder Coating
- 7.2.2. Polyvinyl Fluoride Film
- 7.2.3. Polyester
- 7.2.4. Heat-Resistant Fiber
- 7.2.5. Other Insulation Materials
- 7.3. Market Analysis, Insights and Forecast - by End-User
- 7.3.1. Power Utilities
- 7.3.2. Industrial
- 7.3.3. Transportation
- 7.3.4. Residential and Commercial
- 7.1. Market Analysis, Insights and Forecast - by Material
- 8. Europe Laminated Busbar Industry Analysis, Insights and Forecast, 2021-2033
- 8.1. Market Analysis, Insights and Forecast - by Material
- 8.1.1. Aluminum
- 8.1.2. Copper
- 8.2. Market Analysis, Insights and Forecast - by Insulation Material
- 8.2.1. Epoxy Powder Coating
- 8.2.2. Polyvinyl Fluoride Film
- 8.2.3. Polyester
- 8.2.4. Heat-Resistant Fiber
- 8.2.5. Other Insulation Materials
- 8.3. Market Analysis, Insights and Forecast - by End-User
- 8.3.1. Power Utilities
- 8.3.2. Industrial
- 8.3.3. Transportation
- 8.3.4. Residential and Commercial
- 8.1. Market Analysis, Insights and Forecast - by Material
- 9. Asia Pacific Laminated Busbar Industry Analysis, Insights and Forecast, 2021-2033
- 9.1. Market Analysis, Insights and Forecast - by Material
- 9.1.1. Aluminum
- 9.1.2. Copper
- 9.2. Market Analysis, Insights and Forecast - by Insulation Material
- 9.2.1. Epoxy Powder Coating
- 9.2.2. Polyvinyl Fluoride Film
- 9.2.3. Polyester
- 9.2.4. Heat-Resistant Fiber
- 9.2.5. Other Insulation Materials
- 9.3. Market Analysis, Insights and Forecast - by End-User
- 9.3.1. Power Utilities
- 9.3.2. Industrial
- 9.3.3. Transportation
- 9.3.4. Residential and Commercial
- 9.1. Market Analysis, Insights and Forecast - by Material
- 10. South America Laminated Busbar Industry Analysis, Insights and Forecast, 2021-2033
- 10.1. Market Analysis, Insights and Forecast - by Material
- 10.1.1. Aluminum
- 10.1.2. Copper
- 10.2. Market Analysis, Insights and Forecast - by Insulation Material
- 10.2.1. Epoxy Powder Coating
- 10.2.2. Polyvinyl Fluoride Film
- 10.2.3. Polyester
- 10.2.4. Heat-Resistant Fiber
- 10.2.5. Other Insulation Materials
- 10.3. Market Analysis, Insights and Forecast - by End-User
- 10.3.1. Power Utilities
- 10.3.2. Industrial
- 10.3.3. Transportation
- 10.3.4. Residential and Commercial
- 10.1. Market Analysis, Insights and Forecast - by Material
- 11. Middle East Laminated Busbar Industry Analysis, Insights and Forecast, 2021-2033
- 11.1. Market Analysis, Insights and Forecast - by Material
- 11.1.1. Aluminum
- 11.1.2. Copper
- 11.2. Market Analysis, Insights and Forecast - by Insulation Material
- 11.2.1. Epoxy Powder Coating
- 11.2.2. Polyvinyl Fluoride Film
- 11.2.3. Polyester
- 11.2.4. Heat-Resistant Fiber
- 11.2.5. Other Insulation Materials
- 11.3. Market Analysis, Insights and Forecast - by End-User
- 11.3.1. Power Utilities
- 11.3.2. Industrial
- 11.3.3. Transportation
- 11.3.4. Residential and Commercial
- 11.1. Market Analysis, Insights and Forecast - by Material
- 12. Competitive Analysis
- 12.1. Company Profiles
- 12.1.1 Methode Electronics Inc
- 12.1.1.1. Company Overview
- 12.1.1.2. Products
- 12.1.1.3. Company Financials
- 12.1.1.4. SWOT Analysis
- 12.1.2 Suzhou West Deane Machinery Inc
- 12.1.2.1. Company Overview
- 12.1.2.2. Products
- 12.1.2.3. Company Financials
- 12.1.2.4. SWOT Analysis
- 12.1.3 Electronic Systems Packaging LLC
- 12.1.3.1. Company Overview
- 12.1.3.2. Products
- 12.1.3.3. Company Financials
- 12.1.3.4. SWOT Analysis
- 12.1.4 Molex LLC
- 12.1.4.1. Company Overview
- 12.1.4.2. Products
- 12.1.4.3. Company Financials
- 12.1.4.4. SWOT Analysis
- 12.1.5 Ryoden Kasei Co Ltd
- 12.1.5.1. Company Overview
- 12.1.5.2. Products
- 12.1.5.3. Company Financials
- 12.1.5.4. SWOT Analysis
- 12.1.6 Rogers Corporation
- 12.1.6.1. Company Overview
- 12.1.6.2. Products
- 12.1.6.3. Company Financials
- 12.1.6.4. SWOT Analysis
- 12.1.7 Shanghai Eagtop Electronic Technology Co Ltd
- 12.1.7.1. Company Overview
- 12.1.7.2. Products
- 12.1.7.3. Company Financials
- 12.1.7.4. SWOT Analysis
- 12.1.8 Eaton Corporation PLC
- 12.1.8.1. Company Overview
- 12.1.8.2. Products
- 12.1.8.3. Company Financials
- 12.1.8.4. SWOT Analysis
- 12.1.9 Amphenol Corporation
- 12.1.9.1. Company Overview
- 12.1.9.2. Products
- 12.1.9.3. Company Financials
- 12.1.9.4. SWOT Analysis
- 12.1.10 Segue Electronics Inc *List Not Exhaustive
- 12.1.10.1. Company Overview
- 12.1.10.2. Products
- 12.1.10.3. Company Financials
- 12.1.10.4. SWOT Analysis
- 12.1.11 Zhejiang RHI ELectric Co Ltd
- 12.1.11.1. Company Overview
- 12.1.11.2. Products
- 12.1.11.3. Company Financials
- 12.1.11.4. SWOT Analysis
- 12.1.12 Mersen SA
- 12.1.12.1. Company Overview
- 12.1.12.2. Products
- 12.1.12.3. Company Financials
- 12.1.12.4. SWOT Analysis
- 12.1.13 Zhuzhou CRRC Times Electric Co Ltd
- 12.1.13.1. Company Overview
- 12.1.13.2. Products
- 12.1.13.3. Company Financials
- 12.1.13.4. SWOT Analysis
- 12.1.14 Sun King Power Electronics Group Ltd
- 12.1.14.1. Company Overview
- 12.1.14.2. Products
- 12.1.14.3. Company Financials
- 12.1.14.4. SWOT Analysis
- 12.1.15 Raychem RPG Private Limited
- 12.1.15.1. Company Overview
- 12.1.15.2. Products
- 12.1.15.3. Company Financials
- 12.1.15.4. SWOT Analysis
- 12.1.16 EMS Industrial & Service Company
- 12.1.16.1. Company Overview
- 12.1.16.2. Products
- 12.1.16.3. Company Financials
- 12.1.16.4. SWOT Analysis
- 12.1.17 Storm Power Components
- 12.1.17.1. Company Overview
- 12.1.17.2. Products
- 12.1.17.3. Company Financials
- 12.1.17.4. SWOT Analysis
- 12.1.1 Methode Electronics Inc
- 12.2. Market Entropy
- 12.2.1 Company's Key Areas Served
- 12.2.2 Recent Developments
- 12.3. Company Market Share Analysis 2025
- 12.3.1 Top 5 Companies Market Share Analysis
- 12.3.2 Top 3 Companies Market Share Analysis
- 12.4. List of Potential Customers
- 13. Research Methodology
List of Figures
- Figure 1: Global Laminated Busbar Industry Revenue Breakdown (USD Billion, %) by Region 2025 & 2033
- Figure 2: Global Laminated Busbar Industry Volume Breakdown (K Units, %) by Region 2025 & 2033
- Figure 3: North America Laminated Busbar Industry Revenue (USD Billion), by Material 2025 & 2033
- Figure 4: North America Laminated Busbar Industry Volume (K Units), by Material 2025 & 2033
- Figure 5: North America Laminated Busbar Industry Revenue Share (%), by Material 2025 & 2033
- Figure 6: North America Laminated Busbar Industry Volume Share (%), by Material 2025 & 2033
- Figure 7: North America Laminated Busbar Industry Revenue (USD Billion), by Insulation Material 2025 & 2033
- Figure 8: North America Laminated Busbar Industry Volume (K Units), by Insulation Material 2025 & 2033
- Figure 9: North America Laminated Busbar Industry Revenue Share (%), by Insulation Material 2025 & 2033
- Figure 10: North America Laminated Busbar Industry Volume Share (%), by Insulation Material 2025 & 2033
- Figure 11: North America Laminated Busbar Industry Revenue (USD Billion), by End-User 2025 & 2033
- Figure 12: North America Laminated Busbar Industry Volume (K Units), by End-User 2025 & 2033
- Figure 13: North America Laminated Busbar Industry Revenue Share (%), by End-User 2025 & 2033
- Figure 14: North America Laminated Busbar Industry Volume Share (%), by End-User 2025 & 2033
- Figure 15: North America Laminated Busbar Industry Revenue (USD Billion), by Country 2025 & 2033
- Figure 16: North America Laminated Busbar Industry Volume (K Units), by Country 2025 & 2033
- Figure 17: North America Laminated Busbar Industry Revenue Share (%), by Country 2025 & 2033
- Figure 18: North America Laminated Busbar Industry Volume Share (%), by Country 2025 & 2033
- Figure 19: Europe Laminated Busbar Industry Revenue (USD Billion), by Material 2025 & 2033
- Figure 20: Europe Laminated Busbar Industry Volume (K Units), by Material 2025 & 2033
- Figure 21: Europe Laminated Busbar Industry Revenue Share (%), by Material 2025 & 2033
- Figure 22: Europe Laminated Busbar Industry Volume Share (%), by Material 2025 & 2033
- Figure 23: Europe Laminated Busbar Industry Revenue (USD Billion), by Insulation Material 2025 & 2033
- Figure 24: Europe Laminated Busbar Industry Volume (K Units), by Insulation Material 2025 & 2033
- Figure 25: Europe Laminated Busbar Industry Revenue Share (%), by Insulation Material 2025 & 2033
- Figure 26: Europe Laminated Busbar Industry Volume Share (%), by Insulation Material 2025 & 2033
- Figure 27: Europe Laminated Busbar Industry Revenue (USD Billion), by End-User 2025 & 2033
- Figure 28: Europe Laminated Busbar Industry Volume (K Units), by End-User 2025 & 2033
- Figure 29: Europe Laminated Busbar Industry Revenue Share (%), by End-User 2025 & 2033
- Figure 30: Europe Laminated Busbar Industry Volume Share (%), by End-User 2025 & 2033
- Figure 31: Europe Laminated Busbar Industry Revenue (USD Billion), by Country 2025 & 2033
- Figure 32: Europe Laminated Busbar Industry Volume (K Units), by Country 2025 & 2033
- Figure 33: Europe Laminated Busbar Industry Revenue Share (%), by Country 2025 & 2033
- Figure 34: Europe Laminated Busbar Industry Volume Share (%), by Country 2025 & 2033
- Figure 35: Asia Pacific Laminated Busbar Industry Revenue (USD Billion), by Material 2025 & 2033
- Figure 36: Asia Pacific Laminated Busbar Industry Volume (K Units), by Material 2025 & 2033
- Figure 37: Asia Pacific Laminated Busbar Industry Revenue Share (%), by Material 2025 & 2033
- Figure 38: Asia Pacific Laminated Busbar Industry Volume Share (%), by Material 2025 & 2033
- Figure 39: Asia Pacific Laminated Busbar Industry Revenue (USD Billion), by Insulation Material 2025 & 2033
- Figure 40: Asia Pacific Laminated Busbar Industry Volume (K Units), by Insulation Material 2025 & 2033
- Figure 41: Asia Pacific Laminated Busbar Industry Revenue Share (%), by Insulation Material 2025 & 2033
- Figure 42: Asia Pacific Laminated Busbar Industry Volume Share (%), by Insulation Material 2025 & 2033
- Figure 43: Asia Pacific Laminated Busbar Industry Revenue (USD Billion), by End-User 2025 & 2033
- Figure 44: Asia Pacific Laminated Busbar Industry Volume (K Units), by End-User 2025 & 2033
- Figure 45: Asia Pacific Laminated Busbar Industry Revenue Share (%), by End-User 2025 & 2033
- Figure 46: Asia Pacific Laminated Busbar Industry Volume Share (%), by End-User 2025 & 2033
- Figure 47: Asia Pacific Laminated Busbar Industry Revenue (USD Billion), by Country 2025 & 2033
- Figure 48: Asia Pacific Laminated Busbar Industry Volume (K Units), by Country 2025 & 2033
- Figure 49: Asia Pacific Laminated Busbar Industry Revenue Share (%), by Country 2025 & 2033
- Figure 50: Asia Pacific Laminated Busbar Industry Volume Share (%), by Country 2025 & 2033
- Figure 51: South America Laminated Busbar Industry Revenue (USD Billion), by Material 2025 & 2033
- Figure 52: South America Laminated Busbar Industry Volume (K Units), by Material 2025 & 2033
- Figure 53: South America Laminated Busbar Industry Revenue Share (%), by Material 2025 & 2033
- Figure 54: South America Laminated Busbar Industry Volume Share (%), by Material 2025 & 2033
- Figure 55: South America Laminated Busbar Industry Revenue (USD Billion), by Insulation Material 2025 & 2033
- Figure 56: South America Laminated Busbar Industry Volume (K Units), by Insulation Material 2025 & 2033
- Figure 57: South America Laminated Busbar Industry Revenue Share (%), by Insulation Material 2025 & 2033
- Figure 58: South America Laminated Busbar Industry Volume Share (%), by Insulation Material 2025 & 2033
- Figure 59: South America Laminated Busbar Industry Revenue (USD Billion), by End-User 2025 & 2033
- Figure 60: South America Laminated Busbar Industry Volume (K Units), by End-User 2025 & 2033
- Figure 61: South America Laminated Busbar Industry Revenue Share (%), by End-User 2025 & 2033
- Figure 62: South America Laminated Busbar Industry Volume Share (%), by End-User 2025 & 2033
- Figure 63: South America Laminated Busbar Industry Revenue (USD Billion), by Country 2025 & 2033
- Figure 64: South America Laminated Busbar Industry Volume (K Units), by Country 2025 & 2033
- Figure 65: South America Laminated Busbar Industry Revenue Share (%), by Country 2025 & 2033
- Figure 66: South America Laminated Busbar Industry Volume Share (%), by Country 2025 & 2033
- Figure 67: Middle East Laminated Busbar Industry Revenue (USD Billion), by Material 2025 & 2033
- Figure 68: Middle East Laminated Busbar Industry Volume (K Units), by Material 2025 & 2033
- Figure 69: Middle East Laminated Busbar Industry Revenue Share (%), by Material 2025 & 2033
- Figure 70: Middle East Laminated Busbar Industry Volume Share (%), by Material 2025 & 2033
- Figure 71: Middle East Laminated Busbar Industry Revenue (USD Billion), by Insulation Material 2025 & 2033
- Figure 72: Middle East Laminated Busbar Industry Volume (K Units), by Insulation Material 2025 & 2033
- Figure 73: Middle East Laminated Busbar Industry Revenue Share (%), by Insulation Material 2025 & 2033
- Figure 74: Middle East Laminated Busbar Industry Volume Share (%), by Insulation Material 2025 & 2033
- Figure 75: Middle East Laminated Busbar Industry Revenue (USD Billion), by End-User 2025 & 2033
- Figure 76: Middle East Laminated Busbar Industry Volume (K Units), by End-User 2025 & 2033
- Figure 77: Middle East Laminated Busbar Industry Revenue Share (%), by End-User 2025 & 2033
- Figure 78: Middle East Laminated Busbar Industry Volume Share (%), by End-User 2025 & 2033
- Figure 79: Middle East Laminated Busbar Industry Revenue (USD Billion), by Country 2025 & 2033
- Figure 80: Middle East Laminated Busbar Industry Volume (K Units), by Country 2025 & 2033
- Figure 81: Middle East Laminated Busbar Industry Revenue Share (%), by Country 2025 & 2033
- Figure 82: Middle East Laminated Busbar Industry Volume Share (%), by Country 2025 & 2033
List of Tables
- Table 1: Global Laminated Busbar Industry Revenue USD Billion Forecast, by Material 2020 & 2033
- Table 2: Global Laminated Busbar Industry Volume K Units Forecast, by Material 2020 & 2033
- Table 3: Global Laminated Busbar Industry Revenue USD Billion Forecast, by Insulation Material 2020 & 2033
- Table 4: Global Laminated Busbar Industry Volume K Units Forecast, by Insulation Material 2020 & 2033
- Table 5: Global Laminated Busbar Industry Revenue USD Billion Forecast, by End-User 2020 & 2033
- Table 6: Global Laminated Busbar Industry Volume K Units Forecast, by End-User 2020 & 2033
- Table 7: Global Laminated Busbar Industry Revenue USD Billion Forecast, by Region 2020 & 2033
- Table 8: Global Laminated Busbar Industry Volume K Units Forecast, by Region 2020 & 2033
- Table 9: Global Laminated Busbar Industry Revenue USD Billion Forecast, by Material 2020 & 2033
- Table 10: Global Laminated Busbar Industry Volume K Units Forecast, by Material 2020 & 2033
- Table 11: Global Laminated Busbar Industry Revenue USD Billion Forecast, by Insulation Material 2020 & 2033
- Table 12: Global Laminated Busbar Industry Volume K Units Forecast, by Insulation Material 2020 & 2033
- Table 13: Global Laminated Busbar Industry Revenue USD Billion Forecast, by End-User 2020 & 2033
- Table 14: Global Laminated Busbar Industry Volume K Units Forecast, by End-User 2020 & 2033
- Table 15: Global Laminated Busbar Industry Revenue USD Billion Forecast, by Country 2020 & 2033
- Table 16: Global Laminated Busbar Industry Volume K Units Forecast, by Country 2020 & 2033
- Table 17: Global Laminated Busbar Industry Revenue USD Billion Forecast, by Material 2020 & 2033
- Table 18: Global Laminated Busbar Industry Volume K Units Forecast, by Material 2020 & 2033
- Table 19: Global Laminated Busbar Industry Revenue USD Billion Forecast, by Insulation Material 2020 & 2033
- Table 20: Global Laminated Busbar Industry Volume K Units Forecast, by Insulation Material 2020 & 2033
- Table 21: Global Laminated Busbar Industry Revenue USD Billion Forecast, by End-User 2020 & 2033
- Table 22: Global Laminated Busbar Industry Volume K Units Forecast, by End-User 2020 & 2033
- Table 23: Global Laminated Busbar Industry Revenue USD Billion Forecast, by Country 2020 & 2033
- Table 24: Global Laminated Busbar Industry Volume K Units Forecast, by Country 2020 & 2033
- Table 25: Global Laminated Busbar Industry Revenue USD Billion Forecast, by Material 2020 & 2033
- Table 26: Global Laminated Busbar Industry Volume K Units Forecast, by Material 2020 & 2033
- Table 27: Global Laminated Busbar Industry Revenue USD Billion Forecast, by Insulation Material 2020 & 2033
- Table 28: Global Laminated Busbar Industry Volume K Units Forecast, by Insulation Material 2020 & 2033
- Table 29: Global Laminated Busbar Industry Revenue USD Billion Forecast, by End-User 2020 & 2033
- Table 30: Global Laminated Busbar Industry Volume K Units Forecast, by End-User 2020 & 2033
- Table 31: Global Laminated Busbar Industry Revenue USD Billion Forecast, by Country 2020 & 2033
- Table 32: Global Laminated Busbar Industry Volume K Units Forecast, by Country 2020 & 2033
- Table 33: Global Laminated Busbar Industry Revenue USD Billion Forecast, by Material 2020 & 2033
- Table 34: Global Laminated Busbar Industry Volume K Units Forecast, by Material 2020 & 2033
- Table 35: Global Laminated Busbar Industry Revenue USD Billion Forecast, by Insulation Material 2020 & 2033
- Table 36: Global Laminated Busbar Industry Volume K Units Forecast, by Insulation Material 2020 & 2033
- Table 37: Global Laminated Busbar Industry Revenue USD Billion Forecast, by End-User 2020 & 2033
- Table 38: Global Laminated Busbar Industry Volume K Units Forecast, by End-User 2020 & 2033
- Table 39: Global Laminated Busbar Industry Revenue USD Billion Forecast, by Country 2020 & 2033
- Table 40: Global Laminated Busbar Industry Volume K Units Forecast, by Country 2020 & 2033
- Table 41: Global Laminated Busbar Industry Revenue USD Billion Forecast, by Material 2020 & 2033
- Table 42: Global Laminated Busbar Industry Volume K Units Forecast, by Material 2020 & 2033
- Table 43: Global Laminated Busbar Industry Revenue USD Billion Forecast, by Insulation Material 2020 & 2033
- Table 44: Global Laminated Busbar Industry Volume K Units Forecast, by Insulation Material 2020 & 2033
- Table 45: Global Laminated Busbar Industry Revenue USD Billion Forecast, by End-User 2020 & 2033
- Table 46: Global Laminated Busbar Industry Volume K Units Forecast, by End-User 2020 & 2033
- Table 47: Global Laminated Busbar Industry Revenue USD Billion Forecast, by Country 2020 & 2033
- Table 48: Global Laminated Busbar Industry Volume K Units Forecast, by Country 2020 & 2033
Frequently Asked Questions
1. What is the projected Compound Annual Growth Rate (CAGR) of the Laminated Busbar Industry?
The projected CAGR is approximately 6.02%.
2. Which companies are prominent players in the Laminated Busbar Industry?
Key companies in the market include Methode Electronics Inc, Suzhou West Deane Machinery Inc, Electronic Systems Packaging LLC, Molex LLC, Ryoden Kasei Co Ltd, Rogers Corporation, Shanghai Eagtop Electronic Technology Co Ltd, Eaton Corporation PLC, Amphenol Corporation, Segue Electronics Inc *List Not Exhaustive, Zhejiang RHI ELectric Co Ltd, Mersen SA, Zhuzhou CRRC Times Electric Co Ltd, Sun King Power Electronics Group Ltd, Raychem RPG Private Limited, EMS Industrial & Service Company, Storm Power Components.
3. What are the main segments of the Laminated Busbar Industry?
The market segments include Material, Insulation Material, End-User.
4. Can you provide details about the market size?
The market size is estimated to be USD 0.78 USD Billion as of 2022.
5. What are some drivers contributing to market growth?
4.; Growing Energy Demand4.; Renewable Energy Transition.
6. What are the notable trends driving market growth?
Power Utility Sub-sector to Dominate the Market.
7. Are there any restraints impacting market growth?
4.; Phasing out of Conventional Sources of Electricity.
8. Can you provide examples of recent developments in the market?
In February 2020, ABB Ltd planned to introduce laminated bus plate technology for low-voltage switchgear. The new technology is combined with the ABB Ability platform, and it offers the highest reliability, better efficiency, maximum safety, more flexibility, and measurable return on investment (ROI).
9. What pricing options are available for accessing the report?
Pricing options include single-user, multi-user, and enterprise licenses priced at USD 4750, USD 5250, and USD 8750 respectively.
10. Is the market size provided in terms of value or volume?
The market size is provided in terms of value, measured in USD Billion and volume, measured in K Units.
11. Are there any specific market keywords associated with the report?
Yes, the market keyword associated with the report is "Laminated Busbar Industry," which aids in identifying and referencing the specific market segment covered.
12. How do I determine which pricing option suits my needs best?
The pricing options vary based on user requirements and access needs. Individual users may opt for single-user licenses, while businesses requiring broader access may choose multi-user or enterprise licenses for cost-effective access to the report.
13. Are there any additional resources or data provided in the Laminated Busbar Industry report?
While the report offers comprehensive insights, it's advisable to review the specific contents or supplementary materials provided to ascertain if additional resources or data are available.
14. How can I stay updated on further developments or reports in the Laminated Busbar Industry?
To stay informed about further developments, trends, and reports in the Laminated Busbar Industry, consider subscribing to industry newsletters, following relevant companies and organizations, or regularly checking reputable industry news sources and publications.
Methodology
Step 1 - Identification of Relevant Samples Size from Population Database


Step 2 - Approaches for Defining Global Market Size (Value, Volume* & Price*)

Note*: In applicable scenarios
Step 3 - Data Sources
Primary Research
- Web Analytics
- Survey Reports
- Research Institute
- Latest Research Reports
- Opinion Leaders
Secondary Research
- Annual Reports
- White Paper
- Latest Press Release
- Industry Association
- Paid Database
- Investor Presentations

Step 4 - Data Triangulation
Involves using different sources of information in order to increase the validity of a study
These sources are likely to be stakeholders in a program - participants, other researchers, program staff, other community members, and so on.
Then we put all data in single framework & apply various statistical tools to find out the dynamic on the market.
During the analysis stage, feedback from the stakeholder groups would be compared to determine areas of agreement as well as areas of divergence