

Key Insights
The global Polycrystalline Diamond Compact (PDC) drill bits market is projected for significant expansion, reaching an estimated market size of 972.74 million by 2025, with a Compound Annual Growth Rate (CAGR) of 5.62% from 2025 to 2033. This growth is driven by increasing oil and gas demand, necessitating advanced drilling technologies for efficient exploration and extraction. The need to access complex geological formations and deeper reserves fuels the adoption of high-performance PDC drill bits for superior durability and faster penetration. Continuous research and development by key industry players introducing enhanced bit designs and materials further stimulate market growth. Optimized drilling operations for cost-effectiveness and reduced environmental impact also support market expansion, areas where PDC drill bits excel.
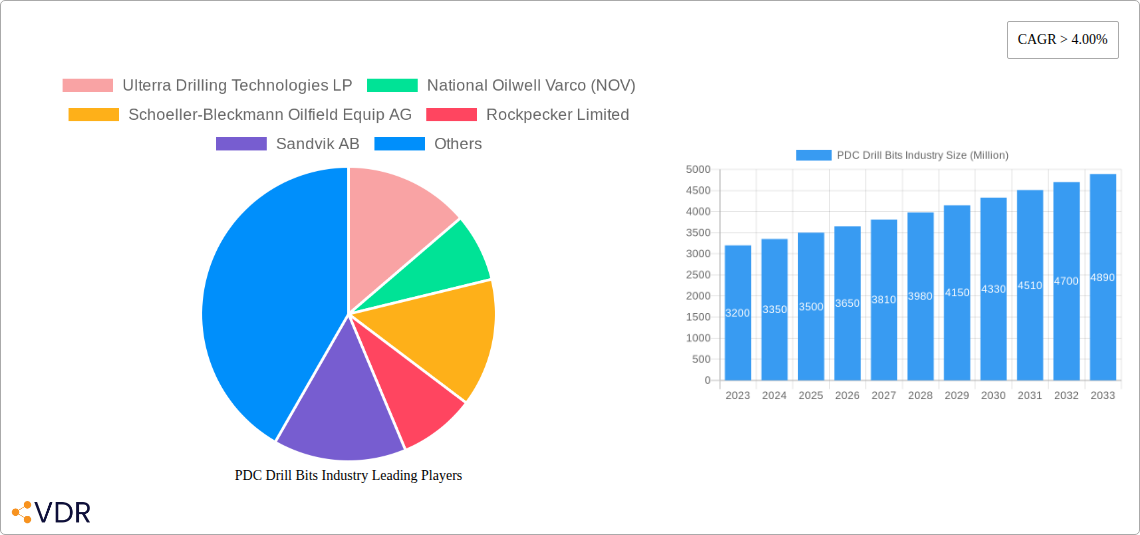
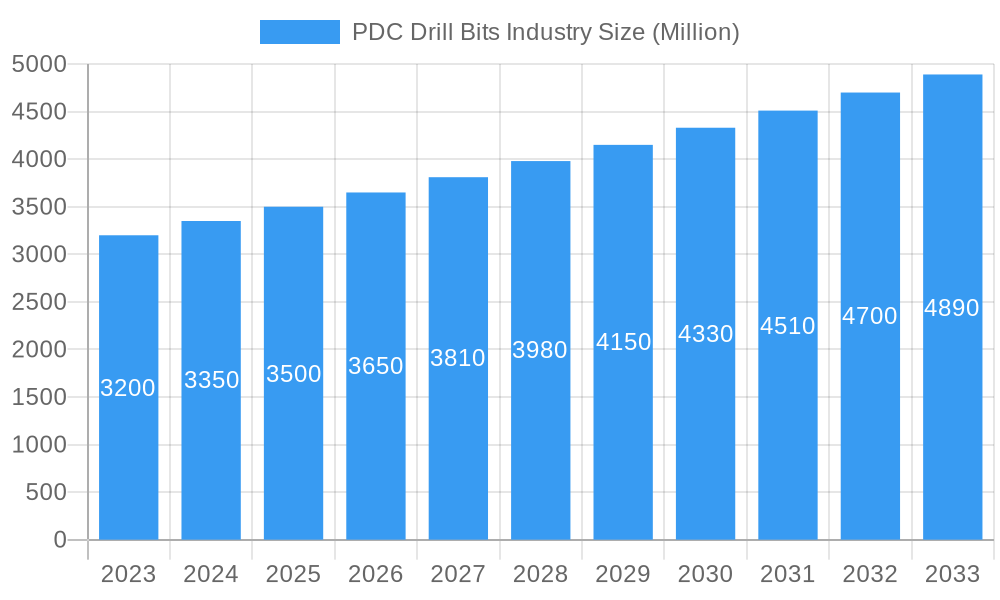
PDC Drill Bits Industry Market Size (In Million)
The market segmentation by type and deployment location reveals distinct growth avenues. Matrix body PDC drill bits, favored for their exceptional wear resistance and high-temperature tolerance, are in high demand for challenging drilling environments. Steel body PDC drill bits remain a cost-effective and versatile option across various applications. Geographically, North America and the Middle East are expected to lead due to extensive oil and gas exploration and substantial investments in new drilling projects. Asia Pacific's emerging economies will also contribute significantly as energy demand rises. Market restraints include fluctuating crude oil prices impacting upstream investment and the emergence of alternative drilling technologies. However, the inherent performance, efficiency, and longevity advantages of PDC drill bits are anticipated to ensure sustained market vitality.
PDC Drill Bits Industry Company Market Share
This comprehensive report analyzes the global PDC Drill Bits industry, detailing market dynamics, growth trends, regional leadership, product offerings, key drivers, barriers, opportunities, and a forward-looking outlook. Leveraging extensive research and proprietary data, the report provides actionable insights for stakeholders in the upstream oil and gas sector. The study period spans from 2019 to 2033, with 2025 serving as the base year and the forecast period from 2025-2033, making it an essential resource for understanding the current and future trajectory of this critical market.
PDC Drill Bits Industry Market Dynamics & Structure
The PDC drill bits industry is characterized by a moderately consolidated market structure, with a few key players holding significant market share. Technological innovation is a primary driver, with continuous advancements in materials science, bit design, and manufacturing processes enhancing drilling efficiency and durability. Regulatory frameworks, primarily driven by environmental concerns and safety standards, influence product development and adoption. Competitive product substitutes, such as roller cone bits, exist but are increasingly being outpaced by the superior performance of PDC technology in many applications. End-user demographics are evolving, with a growing demand for high-performance drill bits in challenging geological formations and for extended reach drilling. Mergers and acquisitions (M&A) trends are evident as larger companies seek to expand their product portfolios and geographic reach.
- Market Concentration: The market is dominated by a mix of large, established players and specialized manufacturers.
- Technological Innovation Drivers: Advancements in synthetic diamond technology, improved cutter geometries, and optimized bit hydraulics are key innovation drivers.
- Regulatory Frameworks: Environmental regulations pertaining to drilling operations and material sourcing impact manufacturing and product lifecycle.
- Competitive Product Substitutes: Roller cone bits remain a substitute in specific drilling conditions, but PDC bits offer higher penetration rates.
- End-User Demographics: Demand is driven by exploration and production companies focusing on efficiency and cost reduction.
- M&A Trends: Strategic acquisitions are common to gain access to new technologies or expand market presence.
PDC Drill Bits Industry Growth Trends & Insights
The global PDC Drill Bits industry is poised for substantial growth, driven by the persistent global demand for energy and the ongoing need for efficient and cost-effective drilling operations. The market size is projected to witness a healthy Compound Annual Growth Rate (CAGR) over the forecast period. Adoption rates are steadily increasing as exploration and production companies recognize the superior performance of PDC bits in terms of penetration rates and durability, especially in complex formations. Technological disruptions continue to shape the industry, with innovations in cutter technology, bit hydraulics, and advanced manufacturing techniques enabling deeper, faster, and more precise drilling. Consumer behavior shifts are observed, with operators increasingly prioritizing solutions that minimize non-productive time (NPT) and reduce overall drilling costs.
The market is expected to grow from an estimated XX million units in the base year 2025 to XX million units by the end of the forecast period in 2033, exhibiting a CAGR of approximately X.X% during the forecast period. The historical period from 2019 to 2024 saw a fluctuating but generally upward trend, influenced by global oil prices and drilling activity. The estimated market size for 2025 stands at XX million units. Key insights suggest that advancements in materials science for PDC cutters, leading to enhanced wear resistance and thermal stability, are a significant factor in driving adoption. Furthermore, the development of specialized PDC bit designs tailored for specific geological challenges, such as hard rock formations or unconsolidated sands, is expanding the application scope and contributing to market penetration. The increasing emphasis on operational efficiency and the reduction of drilling costs are pushing operators to invest in higher-performance drilling tools like PDC bits, even with a potentially higher upfront cost. The shift towards unconventional resource extraction in various regions also necessitates the use of advanced drilling technologies, further bolstering the demand for PDC drill bits. Innovations in bit monitoring and data analytics are also beginning to influence purchasing decisions, as operators seek tools that provide real-time performance feedback and enable predictive maintenance, thereby minimizing costly downtime.
Dominant Regions, Countries, or Segments in PDC Drill Bits Industry
The Onshore segment, particularly within the North America region, is currently the dominant force driving growth in the global PDC Drill Bits industry. This dominance is attributed to several interconnected factors, including extensive oil and gas exploration and production activities, a mature and technologically advanced industry infrastructure, and significant investments in both conventional and unconventional resource development. The sheer volume of drilling operations conducted onshore in countries like the United States and Canada, which have vast shale plays requiring efficient drilling solutions, directly translates into a high demand for PDC drill bits.
- North America's Dominance: Fueled by robust shale oil and gas production, particularly in the US and Canada.
- Onshore Segment Growth: High drilling activity in land-based operations significantly boosts demand for PDC bits.
- Key Drivers in North America:
- Technological Adoption: High receptiveness to advanced drilling technologies, including sophisticated PDC bit designs for optimized performance.
- Economic Policies: Favorable government policies and investment incentives supporting the oil and gas sector.
- Infrastructure Development: Well-established logistics and supply chains facilitating efficient deployment of drilling equipment.
- Resource Richness: Extensive proven reserves of hydrocarbons in geological formations suitable for PDC drilling.
- Market Share: The onshore segment within North America accounts for an estimated XX% of the global PDC drill bits market share in the base year 2025.
- Growth Potential: Continued investment in enhanced oil recovery (EOR) techniques and the exploration of new unconventional reservoirs in the region offer substantial growth potential.
While Offshore drilling also represents a significant market, the higher frequency and volume of onshore operations, especially in North America, currently give it the edge in terms of overall market size and growth contribution. The dominance of the onshore segment is further amplified by the increasing efficiency and cost-effectiveness of PDC bits in various onshore drilling scenarios, from shallow vertical wells to complex horizontal and directional wells. The continuous innovation in bit design for specific onshore geological challenges, coupled with the relentless pursuit of faster drilling speeds and longer bit life, solidifies its leading position.
PDC Drill Bits Industry Product Landscape
The PDC drill bits industry is witnessing a continuous evolution in its product landscape, driven by innovation in cutter technology, bit body design, and advanced manufacturing techniques. Products are increasingly specialized to address diverse geological challenges and optimize drilling performance. Key product innovations include enhanced PDC cutter materials with superior thermal stability and wear resistance, enabling higher penetration rates and extended run life. Advanced bit body designs, such as optimized hydraulic ports and advanced metal matrix composites, improve cleaning efficiency and directional control. Applications range from general-purpose drilling in softer formations to specialized bits for hard rock, high-temperature, or deep-well environments. Performance metrics such as Rate of Penetration (ROP), durability, and overall cost per foot are key differentiators for these products.
Key Drivers, Barriers & Challenges in PDC Drill Bits Industry
The PDC Drill Bits industry is propelled by several key drivers, including the global demand for oil and gas, the need for enhanced drilling efficiency and reduced non-productive time (NPT), and ongoing technological advancements in PDC cutter materials and bit design. The push for cost optimization in exploration and production activities also significantly favors the adoption of high-performance PDC bits.
- Key Drivers:
- Global Energy Demand: Sustained need for oil and gas fuels exploration and production activities.
- Efficiency & Cost Reduction: Drive for faster drilling and lower drilling costs per foot.
- Technological Advancements: Innovations in PDC cutter materials and bit geometries.
- Unconventional Resource Development: Growth in shale gas and tight oil extraction.
The industry faces significant barriers and challenges, including fluctuating oil prices that can impact drilling budgets, the high cost of research and development for advanced PDC technology, and potential supply chain disruptions for critical raw materials. Intense competition among manufacturers also exerts pressure on pricing and profit margins.
- Key Barriers & Challenges:
- Volatile Oil Prices: Fluctuations impact capital expenditure in E&P.
- High R&D Costs: Significant investment required for innovative bit designs and materials.
- Supply Chain Vulnerabilities: Dependence on specialized raw materials and manufacturing capabilities.
- Competitive Pressures: Intense market competition affecting pricing strategies.
- Skilled Labor Shortage: Difficulty in finding and retaining skilled personnel for advanced manufacturing and operations.
Emerging Opportunities in PDC Drill Bits Industry
Emerging opportunities within the PDC Drill Bits industry are centered around several key areas. The increasing focus on complex geological formations and deepwater exploration presents a demand for highly specialized and robust PDC bit designs. Furthermore, the integration of data analytics and Artificial Intelligence (AI) into drilling operations offers opportunities for developing "smart" drill bits that provide real-time performance data and enable predictive maintenance, thereby reducing downtime. The development of more environmentally friendly manufacturing processes and materials also represents a growing niche. Untapped markets in developing oil and gas regions, where the adoption of advanced drilling technologies is still nascent, also present significant growth potential.
Growth Accelerators in the PDC Drill Bits Industry Industry
Several catalysts are accelerating the growth of the PDC Drill Bits industry. Technological breakthroughs in composite materials and advanced manufacturing techniques, such as additive manufacturing, are enabling the creation of more durable and efficient drill bits. Strategic partnerships and collaborations between drill bit manufacturers and exploration and production companies are fostering innovation and ensuring that products meet evolving industry needs. Market expansion strategies, including entry into emerging oil and gas markets and the development of specialized solutions for niche applications like geothermal drilling, are further fueling growth. The increasing emphasis on automation and digitalization in the oilfield services sector also creates opportunities for integrated solutions involving advanced drill bits.
Key Players Shaping the PDC Drill Bits Industry Market
- Ulterra Drilling Technologies LP
- National Oilwell Varco (NOV)
- Schoeller-Bleckmann Oilfield Equip AG
- Rockpecker Limited
- Sandvik AB
- Landrill Oil Tools Co Ltd
- Baker Hughes Company
- Halliburton Company
- Weatherford International PLC
- Schlumberger Limited
Notable Milestones in PDC Drill Bits Industry Sector
- 2019: Introduction of novel PDC cutter geometries offering enhanced thermal stability and wear resistance.
- 2020: Significant investments in R&D for advanced matrix body materials leading to lighter and stronger bit structures.
- 2021: Expansion of manufacturing capabilities by key players to meet increasing demand from unconventional resource development.
- 2022: Launch of "smart" drill bits with integrated sensor technology for real-time data acquisition.
- 2023: Increased adoption of advanced simulation software for bit design optimization, reducing prototyping time.
- 2024: Growing trend towards customized PDC bit solutions tailored for specific geological formations and drilling challenges.
In-Depth PDC Drill Bits Industry Market Outlook
The future market outlook for the PDC Drill Bits industry is exceptionally robust, driven by a confluence of technological innovation and sustained global energy demand. Growth accelerators such as the development of hyper-specialized bits for extreme environments, advancements in diamond synthesis, and the integration of AI-powered predictive analytics will continue to push the boundaries of drilling efficiency. Strategic partnerships and the expansion into emerging markets, coupled with the growing importance of sustainable drilling practices, will shape the competitive landscape. The industry is well-positioned for significant expansion, with a clear trajectory towards more intelligent, efficient, and application-specific drilling solutions that will be critical for meeting future energy needs.
PDC Drill Bits Industry Segmentation
-
1. Type
- 1.1. Matrix Body
- 1.2. Steel Body
-
2. Location of Deployment
- 2.1. Onshore
- 2.2. Offshore
PDC Drill Bits Industry Segmentation By Geography
- 1. North America
- 2. Europe
- 3. Asia Pacific
- 4. South America
- 5. Middle East
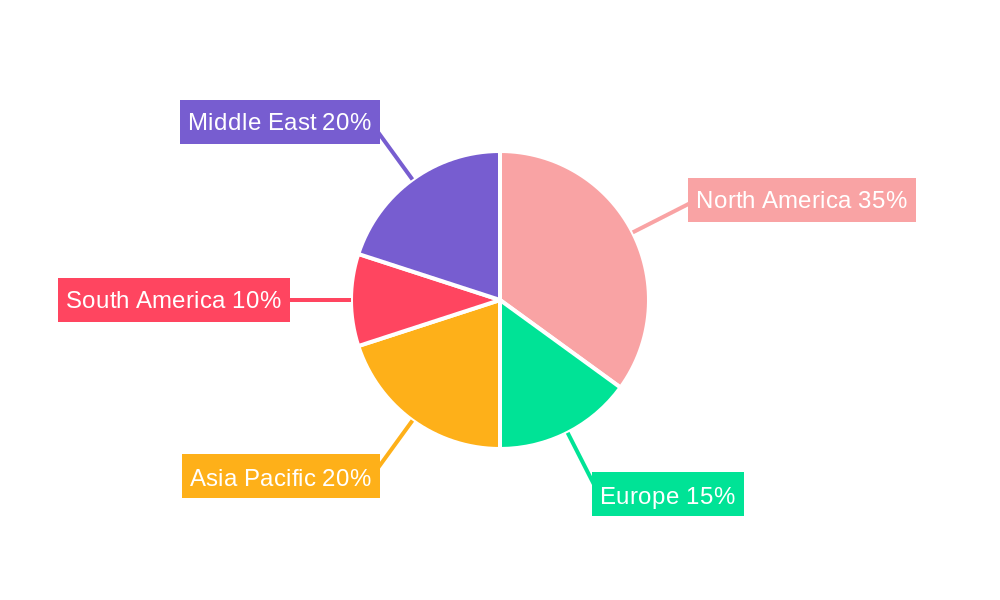
PDC Drill Bits Industry Regional Market Share
Geographic Coverage of PDC Drill Bits Industry
PDC Drill Bits Industry REPORT HIGHLIGHTS
| Aspects | Details |
|---|---|
| Study Period | 2020-2034 |
| Base Year | 2025 |
| Estimated Year | 2026 |
| Forecast Period | 2026-2034 |
| Historical Period | 2020-2025 |
| Growth Rate | CAGR of 5.62% from 2020-2034 |
| Segmentation |
|
Table of Contents
- 1. Introduction
- 1.1. Research Scope
- 1.2. Market Segmentation
- 1.3. Research Objective
- 1.4. Definitions and Assumptions
- 2. Executive Summary
- 2.1. Market Snapshot
- 3. Market Dynamics
- 3.1. Market Drivers
- 3.2. Market Restrains
- 3.3. Market Trends
- 3.4. Market Opportunities
- 4. Market Factor Analysis
- 4.1. Porters Five Forces
- 4.1.1. Bargaining Power of Suppliers
- 4.1.2. Bargaining Power of Buyers
- 4.1.3. Threat of New Entrants
- 4.1.4. Threat of Substitutes
- 4.1.5. Competitive Rivalry
- 4.2. PESTEL analysis
- 4.3. BCG Analysis
- 4.3.1. Stars (High Growth, High Market Share)
- 4.3.2. Cash Cows (Low Growth, High Market Share)
- 4.3.3. Question Mark (High Growth, Low Market Share)
- 4.3.4. Dogs (Low Growth, Low Market Share)
- 4.4. Ansoff Matrix Analysis
- 4.5. Supply Chain Analysis
- 4.6. Regulatory Landscape
- 4.7. Current Market Potential and Opportunity Assessment (TAM–SAM–SOM Framework)
- 4.8. VDR Analyst Note
- 4.1. Porters Five Forces
- 5. Market Analysis, Insights and Forecast 2021-2033
- 5.1. Market Analysis, Insights and Forecast - by Type
- 5.1.1. Matrix Body
- 5.1.2. Steel Body
- 5.2. Market Analysis, Insights and Forecast - by Location of Deployment
- 5.2.1. Onshore
- 5.2.2. Offshore
- 5.3. Market Analysis, Insights and Forecast - by Region
- 5.3.1. North America
- 5.3.2. Europe
- 5.3.3. Asia Pacific
- 5.3.4. South America
- 5.3.5. Middle East
- 5.1. Market Analysis, Insights and Forecast - by Type
- 6. Global PDC Drill Bits Industry Analysis, Insights and Forecast, 2021-2033
- 6.1. Market Analysis, Insights and Forecast - by Type
- 6.1.1. Matrix Body
- 6.1.2. Steel Body
- 6.2. Market Analysis, Insights and Forecast - by Location of Deployment
- 6.2.1. Onshore
- 6.2.2. Offshore
- 6.1. Market Analysis, Insights and Forecast - by Type
- 7. North America PDC Drill Bits Industry Analysis, Insights and Forecast, 2021-2033
- 7.1. Market Analysis, Insights and Forecast - by Type
- 7.1.1. Matrix Body
- 7.1.2. Steel Body
- 7.2. Market Analysis, Insights and Forecast - by Location of Deployment
- 7.2.1. Onshore
- 7.2.2. Offshore
- 7.1. Market Analysis, Insights and Forecast - by Type
- 8. Europe PDC Drill Bits Industry Analysis, Insights and Forecast, 2021-2033
- 8.1. Market Analysis, Insights and Forecast - by Type
- 8.1.1. Matrix Body
- 8.1.2. Steel Body
- 8.2. Market Analysis, Insights and Forecast - by Location of Deployment
- 8.2.1. Onshore
- 8.2.2. Offshore
- 8.1. Market Analysis, Insights and Forecast - by Type
- 9. Asia Pacific PDC Drill Bits Industry Analysis, Insights and Forecast, 2021-2033
- 9.1. Market Analysis, Insights and Forecast - by Type
- 9.1.1. Matrix Body
- 9.1.2. Steel Body
- 9.2. Market Analysis, Insights and Forecast - by Location of Deployment
- 9.2.1. Onshore
- 9.2.2. Offshore
- 9.1. Market Analysis, Insights and Forecast - by Type
- 10. South America PDC Drill Bits Industry Analysis, Insights and Forecast, 2021-2033
- 10.1. Market Analysis, Insights and Forecast - by Type
- 10.1.1. Matrix Body
- 10.1.2. Steel Body
- 10.2. Market Analysis, Insights and Forecast - by Location of Deployment
- 10.2.1. Onshore
- 10.2.2. Offshore
- 10.1. Market Analysis, Insights and Forecast - by Type
- 11. Middle East PDC Drill Bits Industry Analysis, Insights and Forecast, 2021-2033
- 11.1. Market Analysis, Insights and Forecast - by Type
- 11.1.1. Matrix Body
- 11.1.2. Steel Body
- 11.2. Market Analysis, Insights and Forecast - by Location of Deployment
- 11.2.1. Onshore
- 11.2.2. Offshore
- 11.1. Market Analysis, Insights and Forecast - by Type
- 12. Competitive Analysis
- 12.1. Company Profiles
- 12.1.1 Ulterra Drilling Technologies LP
- 12.1.1.1. Company Overview
- 12.1.1.2. Products
- 12.1.1.3. Company Financials
- 12.1.1.4. SWOT Analysis
- 12.1.2 National Oilwell Varco (NOV)
- 12.1.2.1. Company Overview
- 12.1.2.2. Products
- 12.1.2.3. Company Financials
- 12.1.2.4. SWOT Analysis
- 12.1.3 Schoeller-Bleckmann Oilfield Equip AG
- 12.1.3.1. Company Overview
- 12.1.3.2. Products
- 12.1.3.3. Company Financials
- 12.1.3.4. SWOT Analysis
- 12.1.4 Rockpecker Limited
- 12.1.4.1. Company Overview
- 12.1.4.2. Products
- 12.1.4.3. Company Financials
- 12.1.4.4. SWOT Analysis
- 12.1.5 Sandvik AB
- 12.1.5.1. Company Overview
- 12.1.5.2. Products
- 12.1.5.3. Company Financials
- 12.1.5.4. SWOT Analysis
- 12.1.6 Landrill Oil Tools Co Ltd
- 12.1.6.1. Company Overview
- 12.1.6.2. Products
- 12.1.6.3. Company Financials
- 12.1.6.4. SWOT Analysis
- 12.1.7 Baker Hughes Company
- 12.1.7.1. Company Overview
- 12.1.7.2. Products
- 12.1.7.3. Company Financials
- 12.1.7.4. SWOT Analysis
- 12.1.8 Halliburton Company
- 12.1.8.1. Company Overview
- 12.1.8.2. Products
- 12.1.8.3. Company Financials
- 12.1.8.4. SWOT Analysis
- 12.1.9 Weatherford International PLC*List Not Exhaustive
- 12.1.9.1. Company Overview
- 12.1.9.2. Products
- 12.1.9.3. Company Financials
- 12.1.9.4. SWOT Analysis
- 12.1.10 Schlumberger Limited
- 12.1.10.1. Company Overview
- 12.1.10.2. Products
- 12.1.10.3. Company Financials
- 12.1.10.4. SWOT Analysis
- 12.1.1 Ulterra Drilling Technologies LP
- 12.2. Market Entropy
- 12.2.1 Company's Key Areas Served
- 12.2.2 Recent Developments
- 12.3. Company Market Share Analysis 2025
- 12.3.1 Top 5 Companies Market Share Analysis
- 12.3.2 Top 3 Companies Market Share Analysis
- 12.4. List of Potential Customers
- 13. Research Methodology
List of Figures
- Figure 1: Global PDC Drill Bits Industry Revenue Breakdown (million, %) by Region 2025 & 2033
- Figure 2: Global PDC Drill Bits Industry Volume Breakdown (K Units, %) by Region 2025 & 2033
- Figure 3: North America PDC Drill Bits Industry Revenue (million), by Type 2025 & 2033
- Figure 4: North America PDC Drill Bits Industry Volume (K Units), by Type 2025 & 2033
- Figure 5: North America PDC Drill Bits Industry Revenue Share (%), by Type 2025 & 2033
- Figure 6: North America PDC Drill Bits Industry Volume Share (%), by Type 2025 & 2033
- Figure 7: North America PDC Drill Bits Industry Revenue (million), by Location of Deployment 2025 & 2033
- Figure 8: North America PDC Drill Bits Industry Volume (K Units), by Location of Deployment 2025 & 2033
- Figure 9: North America PDC Drill Bits Industry Revenue Share (%), by Location of Deployment 2025 & 2033
- Figure 10: North America PDC Drill Bits Industry Volume Share (%), by Location of Deployment 2025 & 2033
- Figure 11: North America PDC Drill Bits Industry Revenue (million), by Country 2025 & 2033
- Figure 12: North America PDC Drill Bits Industry Volume (K Units), by Country 2025 & 2033
- Figure 13: North America PDC Drill Bits Industry Revenue Share (%), by Country 2025 & 2033
- Figure 14: North America PDC Drill Bits Industry Volume Share (%), by Country 2025 & 2033
- Figure 15: Europe PDC Drill Bits Industry Revenue (million), by Type 2025 & 2033
- Figure 16: Europe PDC Drill Bits Industry Volume (K Units), by Type 2025 & 2033
- Figure 17: Europe PDC Drill Bits Industry Revenue Share (%), by Type 2025 & 2033
- Figure 18: Europe PDC Drill Bits Industry Volume Share (%), by Type 2025 & 2033
- Figure 19: Europe PDC Drill Bits Industry Revenue (million), by Location of Deployment 2025 & 2033
- Figure 20: Europe PDC Drill Bits Industry Volume (K Units), by Location of Deployment 2025 & 2033
- Figure 21: Europe PDC Drill Bits Industry Revenue Share (%), by Location of Deployment 2025 & 2033
- Figure 22: Europe PDC Drill Bits Industry Volume Share (%), by Location of Deployment 2025 & 2033
- Figure 23: Europe PDC Drill Bits Industry Revenue (million), by Country 2025 & 2033
- Figure 24: Europe PDC Drill Bits Industry Volume (K Units), by Country 2025 & 2033
- Figure 25: Europe PDC Drill Bits Industry Revenue Share (%), by Country 2025 & 2033
- Figure 26: Europe PDC Drill Bits Industry Volume Share (%), by Country 2025 & 2033
- Figure 27: Asia Pacific PDC Drill Bits Industry Revenue (million), by Type 2025 & 2033
- Figure 28: Asia Pacific PDC Drill Bits Industry Volume (K Units), by Type 2025 & 2033
- Figure 29: Asia Pacific PDC Drill Bits Industry Revenue Share (%), by Type 2025 & 2033
- Figure 30: Asia Pacific PDC Drill Bits Industry Volume Share (%), by Type 2025 & 2033
- Figure 31: Asia Pacific PDC Drill Bits Industry Revenue (million), by Location of Deployment 2025 & 2033
- Figure 32: Asia Pacific PDC Drill Bits Industry Volume (K Units), by Location of Deployment 2025 & 2033
- Figure 33: Asia Pacific PDC Drill Bits Industry Revenue Share (%), by Location of Deployment 2025 & 2033
- Figure 34: Asia Pacific PDC Drill Bits Industry Volume Share (%), by Location of Deployment 2025 & 2033
- Figure 35: Asia Pacific PDC Drill Bits Industry Revenue (million), by Country 2025 & 2033
- Figure 36: Asia Pacific PDC Drill Bits Industry Volume (K Units), by Country 2025 & 2033
- Figure 37: Asia Pacific PDC Drill Bits Industry Revenue Share (%), by Country 2025 & 2033
- Figure 38: Asia Pacific PDC Drill Bits Industry Volume Share (%), by Country 2025 & 2033
- Figure 39: South America PDC Drill Bits Industry Revenue (million), by Type 2025 & 2033
- Figure 40: South America PDC Drill Bits Industry Volume (K Units), by Type 2025 & 2033
- Figure 41: South America PDC Drill Bits Industry Revenue Share (%), by Type 2025 & 2033
- Figure 42: South America PDC Drill Bits Industry Volume Share (%), by Type 2025 & 2033
- Figure 43: South America PDC Drill Bits Industry Revenue (million), by Location of Deployment 2025 & 2033
- Figure 44: South America PDC Drill Bits Industry Volume (K Units), by Location of Deployment 2025 & 2033
- Figure 45: South America PDC Drill Bits Industry Revenue Share (%), by Location of Deployment 2025 & 2033
- Figure 46: South America PDC Drill Bits Industry Volume Share (%), by Location of Deployment 2025 & 2033
- Figure 47: South America PDC Drill Bits Industry Revenue (million), by Country 2025 & 2033
- Figure 48: South America PDC Drill Bits Industry Volume (K Units), by Country 2025 & 2033
- Figure 49: South America PDC Drill Bits Industry Revenue Share (%), by Country 2025 & 2033
- Figure 50: South America PDC Drill Bits Industry Volume Share (%), by Country 2025 & 2033
- Figure 51: Middle East PDC Drill Bits Industry Revenue (million), by Type 2025 & 2033
- Figure 52: Middle East PDC Drill Bits Industry Volume (K Units), by Type 2025 & 2033
- Figure 53: Middle East PDC Drill Bits Industry Revenue Share (%), by Type 2025 & 2033
- Figure 54: Middle East PDC Drill Bits Industry Volume Share (%), by Type 2025 & 2033
- Figure 55: Middle East PDC Drill Bits Industry Revenue (million), by Location of Deployment 2025 & 2033
- Figure 56: Middle East PDC Drill Bits Industry Volume (K Units), by Location of Deployment 2025 & 2033
- Figure 57: Middle East PDC Drill Bits Industry Revenue Share (%), by Location of Deployment 2025 & 2033
- Figure 58: Middle East PDC Drill Bits Industry Volume Share (%), by Location of Deployment 2025 & 2033
- Figure 59: Middle East PDC Drill Bits Industry Revenue (million), by Country 2025 & 2033
- Figure 60: Middle East PDC Drill Bits Industry Volume (K Units), by Country 2025 & 2033
- Figure 61: Middle East PDC Drill Bits Industry Revenue Share (%), by Country 2025 & 2033
- Figure 62: Middle East PDC Drill Bits Industry Volume Share (%), by Country 2025 & 2033
List of Tables
- Table 1: Global PDC Drill Bits Industry Revenue million Forecast, by Type 2020 & 2033
- Table 2: Global PDC Drill Bits Industry Volume K Units Forecast, by Type 2020 & 2033
- Table 3: Global PDC Drill Bits Industry Revenue million Forecast, by Location of Deployment 2020 & 2033
- Table 4: Global PDC Drill Bits Industry Volume K Units Forecast, by Location of Deployment 2020 & 2033
- Table 5: Global PDC Drill Bits Industry Revenue million Forecast, by Region 2020 & 2033
- Table 6: Global PDC Drill Bits Industry Volume K Units Forecast, by Region 2020 & 2033
- Table 7: Global PDC Drill Bits Industry Revenue million Forecast, by Type 2020 & 2033
- Table 8: Global PDC Drill Bits Industry Volume K Units Forecast, by Type 2020 & 2033
- Table 9: Global PDC Drill Bits Industry Revenue million Forecast, by Location of Deployment 2020 & 2033
- Table 10: Global PDC Drill Bits Industry Volume K Units Forecast, by Location of Deployment 2020 & 2033
- Table 11: Global PDC Drill Bits Industry Revenue million Forecast, by Country 2020 & 2033
- Table 12: Global PDC Drill Bits Industry Volume K Units Forecast, by Country 2020 & 2033
- Table 13: Global PDC Drill Bits Industry Revenue million Forecast, by Type 2020 & 2033
- Table 14: Global PDC Drill Bits Industry Volume K Units Forecast, by Type 2020 & 2033
- Table 15: Global PDC Drill Bits Industry Revenue million Forecast, by Location of Deployment 2020 & 2033
- Table 16: Global PDC Drill Bits Industry Volume K Units Forecast, by Location of Deployment 2020 & 2033
- Table 17: Global PDC Drill Bits Industry Revenue million Forecast, by Country 2020 & 2033
- Table 18: Global PDC Drill Bits Industry Volume K Units Forecast, by Country 2020 & 2033
- Table 19: Global PDC Drill Bits Industry Revenue million Forecast, by Type 2020 & 2033
- Table 20: Global PDC Drill Bits Industry Volume K Units Forecast, by Type 2020 & 2033
- Table 21: Global PDC Drill Bits Industry Revenue million Forecast, by Location of Deployment 2020 & 2033
- Table 22: Global PDC Drill Bits Industry Volume K Units Forecast, by Location of Deployment 2020 & 2033
- Table 23: Global PDC Drill Bits Industry Revenue million Forecast, by Country 2020 & 2033
- Table 24: Global PDC Drill Bits Industry Volume K Units Forecast, by Country 2020 & 2033
- Table 25: Global PDC Drill Bits Industry Revenue million Forecast, by Type 2020 & 2033
- Table 26: Global PDC Drill Bits Industry Volume K Units Forecast, by Type 2020 & 2033
- Table 27: Global PDC Drill Bits Industry Revenue million Forecast, by Location of Deployment 2020 & 2033
- Table 28: Global PDC Drill Bits Industry Volume K Units Forecast, by Location of Deployment 2020 & 2033
- Table 29: Global PDC Drill Bits Industry Revenue million Forecast, by Country 2020 & 2033
- Table 30: Global PDC Drill Bits Industry Volume K Units Forecast, by Country 2020 & 2033
- Table 31: Global PDC Drill Bits Industry Revenue million Forecast, by Type 2020 & 2033
- Table 32: Global PDC Drill Bits Industry Volume K Units Forecast, by Type 2020 & 2033
- Table 33: Global PDC Drill Bits Industry Revenue million Forecast, by Location of Deployment 2020 & 2033
- Table 34: Global PDC Drill Bits Industry Volume K Units Forecast, by Location of Deployment 2020 & 2033
- Table 35: Global PDC Drill Bits Industry Revenue million Forecast, by Country 2020 & 2033
- Table 36: Global PDC Drill Bits Industry Volume K Units Forecast, by Country 2020 & 2033
Frequently Asked Questions
1. What is the projected Compound Annual Growth Rate (CAGR) of the PDC Drill Bits Industry?
The projected CAGR is approximately 5.62%.
2. Which companies are prominent players in the PDC Drill Bits Industry?
Key companies in the market include Ulterra Drilling Technologies LP, National Oilwell Varco (NOV), Schoeller-Bleckmann Oilfield Equip AG, Rockpecker Limited, Sandvik AB, Landrill Oil Tools Co Ltd, Baker Hughes Company, Halliburton Company, Weatherford International PLC*List Not Exhaustive, Schlumberger Limited.
3. What are the main segments of the PDC Drill Bits Industry?
The market segments include Type, Location of Deployment.
4. Can you provide details about the market size?
The market size is estimated to be USD 972.74 million as of 2022.
5. What are some drivers contributing to market growth?
Growing demand for natural gas and developing gas infrastructure.; Increasing offshore oil and Gas Exploration Activities.
6. What are the notable trends driving market growth?
The Onshore Segment to Dominate the Market.
7. Are there any restraints impacting market growth?
Adoption of Cleaner Alternatives.
8. Can you provide examples of recent developments in the market?
N/A
9. What pricing options are available for accessing the report?
Pricing options include single-user, multi-user, and enterprise licenses priced at USD 4750, USD 5250, and USD 8750 respectively.
10. Is the market size provided in terms of value or volume?
The market size is provided in terms of value, measured in million and volume, measured in K Units.
11. Are there any specific market keywords associated with the report?
Yes, the market keyword associated with the report is "PDC Drill Bits Industry," which aids in identifying and referencing the specific market segment covered.
12. How do I determine which pricing option suits my needs best?
The pricing options vary based on user requirements and access needs. Individual users may opt for single-user licenses, while businesses requiring broader access may choose multi-user or enterprise licenses for cost-effective access to the report.
13. Are there any additional resources or data provided in the PDC Drill Bits Industry report?
While the report offers comprehensive insights, it's advisable to review the specific contents or supplementary materials provided to ascertain if additional resources or data are available.
14. How can I stay updated on further developments or reports in the PDC Drill Bits Industry?
To stay informed about further developments, trends, and reports in the PDC Drill Bits Industry, consider subscribing to industry newsletters, following relevant companies and organizations, or regularly checking reputable industry news sources and publications.
Methodology
Step 1 - Identification of Relevant Samples Size from Population Database


Step 2 - Approaches for Defining Global Market Size (Value, Volume* & Price*)

Note*: In applicable scenarios
Step 3 - Data Sources
Primary Research
- Web Analytics
- Survey Reports
- Research Institute
- Latest Research Reports
- Opinion Leaders
Secondary Research
- Annual Reports
- White Paper
- Latest Press Release
- Industry Association
- Paid Database
- Investor Presentations

Step 4 - Data Triangulation
Involves using different sources of information in order to increase the validity of a study
These sources are likely to be stakeholders in a program - participants, other researchers, program staff, other community members, and so on.
Then we put all data in single framework & apply various statistical tools to find out the dynamic on the market.
During the analysis stage, feedback from the stakeholder groups would be compared to determine areas of agreement as well as areas of divergence